. 2020 Sep 25:14:561857.
doi: 10.3389/fncel.2020.561857. eCollection 2020.

Synaptojanin2 Mutation Causes Progressive High-frequency Hearing Loss in Mice

Affiliations

Synaptojanin2 Mutation Causes Progressive High-frequency Hearing Loss in Mice

Elisa Martelletti et al. Front Cell Neurosci. .

Abstract

Progressive hearing loss is very common in the human population but we know little about the underlying molecular mechanisms. Synaptojanin2 (Synj2) has been reported to be involved, as a mouse mutation led to a progressive increase in auditory thresholds with age. Synaptojanin2 is a phosphatidylinositol (PI) phosphatase that removes the five-position phosphates from phosphoinositides, such as PIP2 and PIP3, and is a key enzyme in clathrin-mediated endocytosis. To investigate the mechanisms underlying progressive hearing loss, we have studied a different mutation of mouse Synj2 to look for any evidence of involvement of vesicle trafficking particularly affecting the synapses of sensory hair cells. Auditory brainstem responses (ABR) developed normally at first but started to decline between 3 and 4 weeks of age in Synj2tm1b mutants. At 6 weeks old, some evidence of outer hair cell (OHC) stereocilia fusion and degeneration was observed, but this was only seen in the extreme basal turn so cannot explain the raised ABR thresholds that correspond to more apical regions of the cochlear duct. We found no evidence of any defect in inner hair cell (IHC) exocytosis or endocytosis using single hair cell recordings, nor any sign of hair cell synaptic abnormalities. Endocochlear potentials (EP) were normal. The mechanism underlying progressive hearing loss in these mutants remains elusive, but our findings of raised distortion product otoacoustic emission (DPOAE) thresholds and signs of OHC degeneration both suggest an OHC origin for the hearing loss. Synaptojanin2 is not required for normal development of hearing but it is important for its maintenance.

Keywords: auditory function; exocytosis; hair cells; mouse mutant; progressive hearing loss; single hair cell recording; synaptojanin2.


Figures

Figure 1
Figure 1
Generation of the Synaptojanin2 (Synj2; Synj2tm1a) and Synj2tm1b mutant mice. (A) Diagram showing the design of the Synj2tm1a and Synj2tm1b alleles. Yellow boxes show exons, green triangles show FRT sites, red triangles show loxP sites, blue and green boxes show the neomycin resistance and LacZ genes, arrows marked Fw and Rv indicate the locations of the genotyping primer sites. Synj2tm1a mutant mice were crossed to CMV-Cre mice to generate the Synj2tm1b mutant mice by Cre recombinase-mediated excision of the DNA between loxP sites 1 and 3, including deletion of exons 9, 10 and 11. (B) Auditory brainstem response (ABR) thresholds show no hearing impairment in Synj2tm1a/tm1a homozygous mice at 14 weeks old. Synj2+/+ n = 7, black triangles; Synj2tm1a/tm1a n = 7, red circles. Data plotted as mean ± standard deviation. (C,D) Quantitative RT-PCR shows knockdown of Synj2 transcription in brain tissue from 4-week-old mice: Synj2tm1a/tm1a homozygotes have 22% of the normal level of transcribed mRNA and Synj2tm1b/tm1b homozygotes have 42%. Hprt was used as internal control and levels are normalized to wildtype (WT) levels (shown as 1.0 on the Y-axis). Three and four animals for each genotype were analyzed in panels (C,D) respectively. Data plotted as mean ± standard deviation. Mann–Whitney rank-sum test was performed: Synj2tm1a homozygous, *p = 0.05; Synj2tm1b homozygous, *p = 0.02. (E) Schematic representation of the WT Synj2 transcript and the Synj2tm1b allele, where exons 9, 10, and 11 are excised and the LacZ gene is present. The two arrows correspond to the forward (Fw) primer on exon 8 and reverse (Rv) primer on exon 13 used for PCR amplification for genotyping. (F) Electrophoresis gel shows all the Synj2+/+ (WT) samples have a band of 694 bp, while the band from the Synj2tm1b/tm1b (Hom) samples is around 400 bp. (G) Sanger sequencing results confirm the presence of exons 9, 10, and 11 in the Synj2+/+ samples and their deletion in the Synj2tm1b/tm1b samples where the sequence of the LacZ gene is present between exons 8 and 12 instead. Four mice for each genotype were sequenced.
Figure 2
Figure 2
Synj2 expression in the cochlea. Synj2 is expressed in the outer and inner hair cells, some organs of Corti supporting cells (including the Boettcher cells shown here), and spiral ganglion at 4 weeks old, n = 2 for each genotype. (A,C) WT littermate controls were used to check the specificity of the X-gal staining. (B,D) X-gal staining (blue label) of sections of the inner ear of Synj2+/tm1b heterozygous mutant mice indicates the location of Synaptojanin2 expression. Scale bars: 10 μm. OHCs, outer hair cells; IHC, inner hair cells; BCs, Boettcher cells; SG, spiral ganglion.
Figure 3
Figure 3
ABR thresholds decline with age in Synj2tm1b homozygotes. Mean ABR thresholds (± standard deviation) for clicks and tone pips are plotted for controls (black triangles) and homozygous Synj2tm1b mice (red circles). Pale gray lines show thresholds of individual homozygotes. The littermate control group included both WT and heterozygous mice as no difference was observed between them. The data were analyzed using separate linear models for each frequency with a compound symmetric covariance structure followed by the Bonferroni post hoc test. (A,B) ABR thresholds show no difference between controls (n = 20 in A, n = 12 in B) and mutants (n = 8 in both A,B). The variability in the 2 weeks old mice might be due to variability in the state of development of the hearing system, which is not uncommon at this early age. (C–G) The ABR thresholds at 30, 36, and 42 kHz increased progressively from 4 to 14 weeks in the mutants (n = 6) in comparison to the littermate controls (n = 7). Asterisks indicate *p < 0.05, **p ≤ 0.01 and ***p ≤ 0.001. (H) The ABR thresholds of the mutant mice are plotted for the age groups of 3, 6, and 14 weeks, showing a progressive rise of the thresholds at 30, 36, and 42 kHz.
Figure 4
Figure 4
ABR waveform analysis and frequency tuning curves (FTCs). (A) ABR thresholds of the mice used in (B–E) are plotted for click stimuli and pure tones of 6–42 kHz. Thresholds of individual mutant mice are plotted in gray. Mean (± standard deviation) thresholds are plotted for controls (black triangles) and mutants (red circles). (B,C) Tone evoked ABR waveforms, recorded at 20 dB sensation level, are plotted for 12 kHz and 30 kHz stimuli. Responses from individual control mice are plotted as fine black lines and from individual mutant mice as fine red lines. The averaged waveform for each group is plotted as a thick line. (B,C) The mean amplitude (± standard deviation) of ABR waves 1–4 (W1, W2, W3, and W4) is plotted as a function of dB sensation level for control mice (black triangles) and mutant mice (red circles) for 12 kHz stimuli (D) and 30 kHz stimuli (E). (F) FTC of control (black triangles; n = 5 WT, n = 2 heterozygote) and mutant (red circles, n = 9 homozygotes) mice, aged 6 weeks. Mean (± standard deviation) masked thresholds were comparable in control and mutant mice, using probe tones of 12, 18, and 24 kHz.
Figure 5
Figure 5
Distortion product otoacoustic emissions (DPOAE) show raised thresholds at high frequencies. (A) Mean (± standard deviation) 2f1–f2 thresholds for control (black triangles; WT, n = 9) and mutant (red circles; homozygote, n = 12) mice. f2 frequencies where significant threshold elevations were noted in mutant mice are indicated by asterisks (ANOVA, p < 0.05). (B,C) Mean (± standard deviation) 2f1–f2 amplitude is plotted as a function of dB SPL for control (black triangles) and mutant (red circles) mice, for f2 frequencies of 12 kHz (B) and 30 kHz (C). (D,E) Mean (± standard deviation) 2f1–f2 amplitude is plotted as a function of dB sensation level SPL for control (black triangles) and mutant (red circles) mice, for f2 frequencies of 12 kHz (D) and 30 kHz (E).
Figure 6
Figure 6
Endocochlear potentials (EP) are normal in mutants. Mean (± standard deviation) EP is plotted for heterozygote control mice (filled black, n = 4) and homozygote mutant mice (filled red, n = 4) aged 6 weeks. Empty symbols represent recordings from single mice. There was no difference in the normal positive EP (upper part of the graph shown by circles. ANOVA, p = 0.204), nor in the anoxia potential or negative EP (lower part of the graph shown by triangles. ANOVA, p = 0.898) between control and mutant mice. Both positive and negative EP were measured from the same mouse.
Figure 7
Figure 7
Scanning electron microscopy (SEM) of the organ of Corti in Synj2tm1b mutant mice. The littermate WTs, heterozygotes and homozygous mice at 6 weeks old were compared along the cochlear duct. Differences between genotypes were seen in the lower basal turns. Three basal regions of the cochlea are presented corresponding to best frequency regions of 60 kHz (A–C; 5–10% of the distance along the cochlear duct from the hook), 45 kHz (D–F; 15–20% distance) and 30 kHz (G–I; 35% distance). OHC degeneration was observed at the extreme base of the cochlea of Synj2tm1b/tm1b mice. All IHCs appeared normal in homozygotes compared with WTs and heterozygotes. (A–C) In the 60 kHz region, all OHCs were affected in Synj2tm1b/tm1b mice, showing fused stereocilia or missing bundles (C), while in control mice, only a few OHCs have stereocilia fusion or are very rarely missing (as indicated by circles). (D–F) At the 45 kHz region, Synj2tm1b/tm1b mice (F) showed more frequent OHC stereocilia fusion (some examples in red circles) than controls (D). (G–I) At the 30 kHz location, Synj2tm1b/tm1b mice (I) had a very similar appearance compared with Synj2+/tm1b or WTs (G,H). (J) This shows an enlargement of the framed area in (C). Red arrows point to examples of fused stereocilia. (K) Example of OHCs from another homozygote. Red arrows point to fused stereocilia and some hair bundles are missing. Scale bar: 10 μm in (A–I); 5 μm in (J,K). Synj2tm1b/tm1b n = 5; Synj2+/tm1b n = 6; Synj2+/+ n = 3. (L) Quantification of hair bundle survival showed a significant reduction of OHC hair bundles at the location 0–10% of the distance along the cochlear duct from the hook (**p ≤ 0.01). No missing IHC hair bundles were observed in either controls or Synj2tm1b/tm1b mice. The five cochlear positions plotted correspond to the following frequency ranges: 0–10% ≥60 kHz; 11–20% = 45–58 kHz; 21–30% = 34–44 kHz; 31–40% = 26–33 kHz; 41–50% = 20–25 kHz. All data are shown as mean ± SD. 0–10% p = 0.006, controls n = 6 mice, Synj2tm1b/tm1b n = 5 mice; 11–20% p = 0.053, controls n = 9 mice, Synj2tm1b/tm1b n = 5 mice; 21–30% p = 0.633, controls n = 9 mice, Synj2tm1b/tm1b n = 5 mice; 31–40% p = 0.209, controls n = 7 mice, Synj2tm1b/tm1b n = 6 mice; 41–50% p = 0.938, controls n = 2 mice, Synj2tm1b/tm1b n = 3 mice. The littermate control group included both Synj2+/+and Synj2+/tm1b mice as no statistical difference was observed between them.
Figure 8
Figure 8
Innervation of the organ of Corti appears normal in mutants. (A–D). The normal neuronal pattern in Synj2tm1b/tm1b mice. Maximum projection of stacks of confocal images of the whole-mount organ of Corti stained for neurofilament (green) and CtBP2 (red). The 12 k and 30 kHz best frequency regions of the cochlea were compared between the Synj2+/+ mice (A,C) and the corresponding littermate Synj2tm1b/tm1b (B,D). Synj2tm1b/tm1b n = 5; Controls n = 4 (three WT and one Heterozygote). Scale bar: 5 μm. (E–H) Confocal images of the whole-mount organ of Corti with Ribeye labeling of pre-synaptic ribbons in red, post-synaptic labeling of GluR2 in green, and the nuclei of cells in gray (DAPI). The cochlear regions corresponding to 12 and 30 kHz are compared between littermate Synj2+/+ (E,G) and Synj2tm1b/tm1b (F,H) mice. Scale bar: 5 μm, n = 4 for both genotypes. (I) Quantification of ribbon synapses per IHC reveals no difference between Synj2tm1b/tm1b and control mice. Co-localized Ribeye and GluR2 puncta are counted and divided by the number of IHC nuclei in WT and Synj2tm1b/tm1b mice. All data are shown as mean ± SD and statistically analyzed by one-way ANOVA test, n = 4 for both genotypes. Number of synapses: WT 12 kHz 17.8 ± 1.8, 30 kHz 16.6 ± 1.9; Synj2tm1b/tm1b 12 kHz 17.6 ± 2.4 (p = 0.905); 30 kHz 16.3 ± 4.0 (p = 0.924).
Figure 9
Figure 9
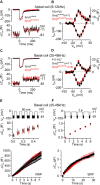
Exocytosis is normal in apical and basal IHCs from Synj2 mice. (A,B) Calcium current (ICa) and changes in membrane capacitance (ΔCm) recorded from control (Synj2+/tm1b, n = 7) and mutant (Synj2tm1b/tm1b, n = 6) apical-coil IHCs (6–12 kHz) of P20–P25 mice. Recordings were obtained in response to 50 ms voltage steps from −81 mV in 10 mV increments (in panel A only maximal responses at −11 mV are shown). (C,D) ICa and ΔCm recorded from 11 Synj2+/tm1b and nine Synj2tm1b/tm1b basal-coil IHCs (25–45 kHz) of P18–P23 mice using the protocol described above. (E,F) ΔCm elicited using repetitive voltage steps to −11 mV of 50 ms and 1 s in duration to elicit the readily releasable pool (RRP) and secondary releasable pool (SRP), respectively. The inter-step-interval was either 50 ms (E) or 200 ms (F). For clarity, only the first few steps are shown. The voltage protocol used is shown above the traces. Average cumulative ΔCm values (bottom panels) obtained in response to the 50 ms and 1 s protocol, respectively, from 6 Synj2+/tm1b and 10 Synj2tm1b/tm1b IHCs. Error bars in all panels indicate SEM.
Figure 10
Figure 10
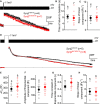
Endocytic responses in IHCs from Synj2 mice. (A) Average depolarization-evoked exocytosis from basal coil IHCs of P17–P27 Synj2 mice using mild stimuli (100 ms voltage step to −11 mV shown above the traces) able to mainly release the RRP. Continuous lines are the fits to the data using a linear function. (B,C) Average time required for the Cm to return to baseline (B) and average slope of the linear component of exocytosis (C) obtained from the fits to single IHC recordings (open symbols) to 100 ms voltage steps. (D) Average depolarization-evoked exocytosis from IHCs of P17–P27 Synj2 mice using large stimuli (1 s voltage step to −11 mV) able to release the SRP. Continuous lines are the fits to the data using an exponential and linear function (see “Results” section). (E) Average ΔCm elicited following a 1 s voltage step. (F,G) Average amplitudes (F) and time constants (G) of the exponential functions fitted to the data from single IHC recordings to 1 s stimulus. (H) The average slope of the linear component of exocytosis to 1 s voltage step.
Figure 11
Figure 11
Current responses in mature IHCs from Synj2 mice. (A,B) Potassium currents recorded from P45 control (Synj2+/tm1b: A) and mutant (Synj2tm1b/tm1b: B) basal-coil IHCs (25–45 kHz) of P45 mice, elicited by depolarizing voltage steps (10 mV nominal increments) from –124 mV to more depolarized values from the holding potential of –84 mV. The adult-type K+ current IK,f and IK,n are present in IHCs from both genotypes. (C) Steady-state current-voltage relationship for the total K+ current measured at 160 ms from eight Synj2+/tm1b and 7 Synj2tm1b/tm1b IHCs. (D,E) IK,n was more clearly visible when the K+ currents were recorded by using depolarizing voltage steps in 10 mV nominal increments from the holding potential of –64 mV.

References

    1. Bosher S. K. (1979). The nature of the negative endocochlear potentials produced by anoxia and ethacrynic acid in the rat and guinea-pig. J. Physiol. 293, 329–345. 10.1113/jphysiol.1979.sp012892 - DOI - PMC - PubMed
    1. Bullen A., Forge A., Wright A., Richardson G. P., Goodyear R. J., Taylor R. (2019). Ultrastructural defects in stereocilia and tectorial membrane in aging mouse and human cochleae. J. Neurosci. Res. 98, 1745–1763. 10.1002/jnr.24556 - DOI - PubMed
    1. Chen J., Ingham N., Kelly J., Jadeja S., Goulding D., Pass J., et al. . (2014a). Spinster homolog 2 (spns2) deficiency causes early onset progressive hearing loss. PLoS Genet. 10:e1004688. 10.1371/journal.pgen.1004688 - DOI - PMC - PubMed
    1. Chen J., Johnson S. L., Lewis M. A., Hilton J. M., Huma A., Marcotti W., et al. . (2014b). A reduction in Ptprq associated with specific features of the deafness phenotype of the miR-96 mutant mouse diminuendo. Eur. J. Neurosci. 39, 744–756. 10.1111/ejn.12484 - DOI - PMC - PubMed
    1. Corns L. F., Bardhan T., Houston O., Olt J., Holley M. C., Masetto S., et al. (2014). “Functional development of hair cells in the mammalian inner ear,” in Development of Auditory and Vestibular Systems, eds Romand R., Varela-Nieto I. (New York, NY: Academic Press; ), 155–188.

LinkOut - more resources