. 2020 Sep 24:11:543148.
doi: 10.3389/fphys.2020.543148. eCollection 2020.

Progesterone Regulates Glucose Metabolism Through Glucose Transporter 1 to Promote Endometrial Receptivity

Affiliations

Progesterone Regulates Glucose Metabolism Through Glucose Transporter 1 to Promote Endometrial Receptivity

Hongshuo Zhang et al. Front Physiol. .

Abstract

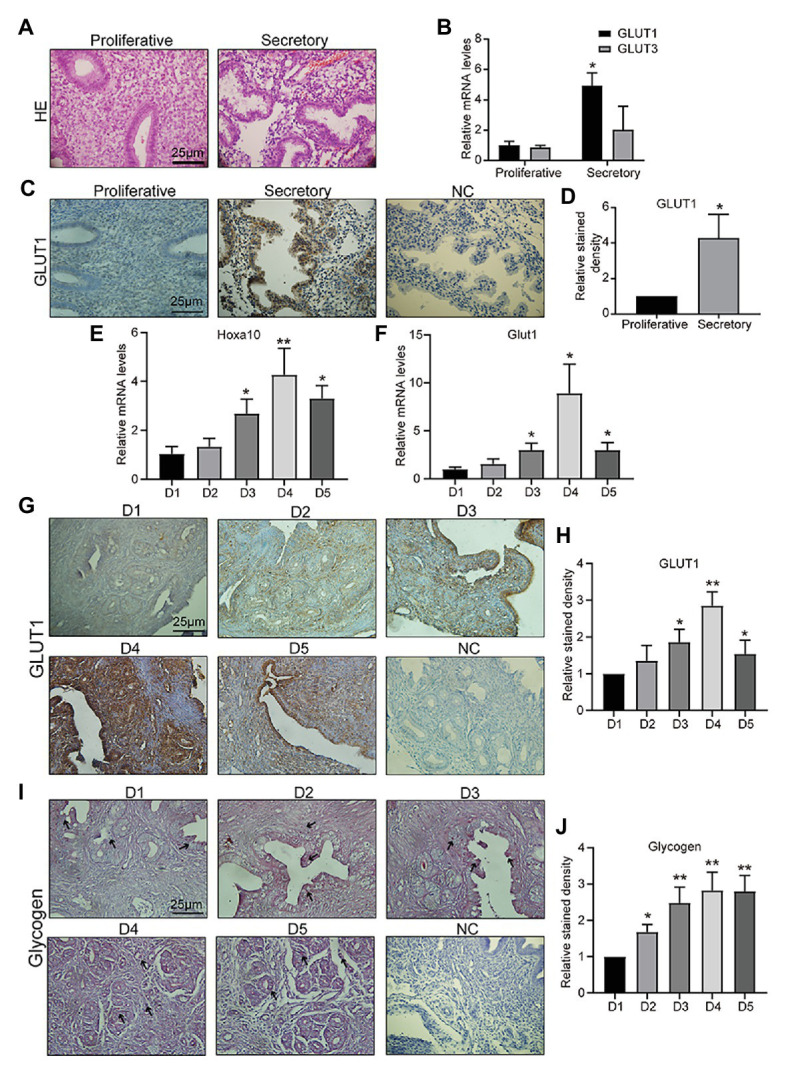
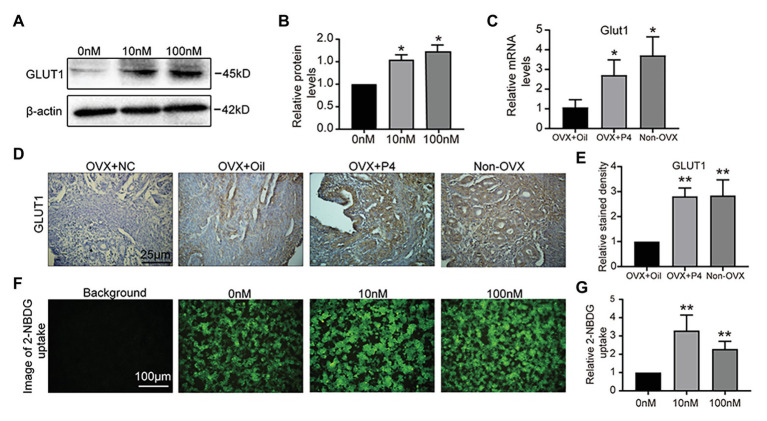
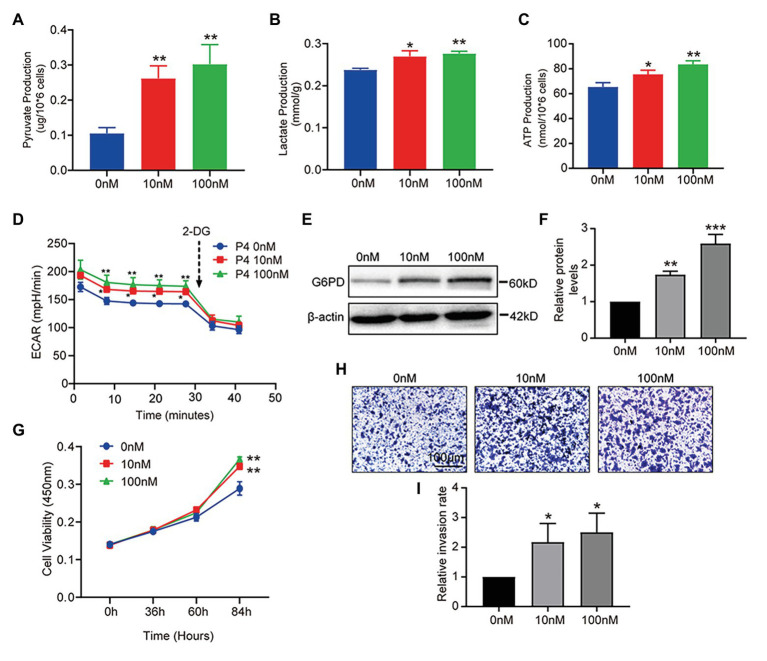
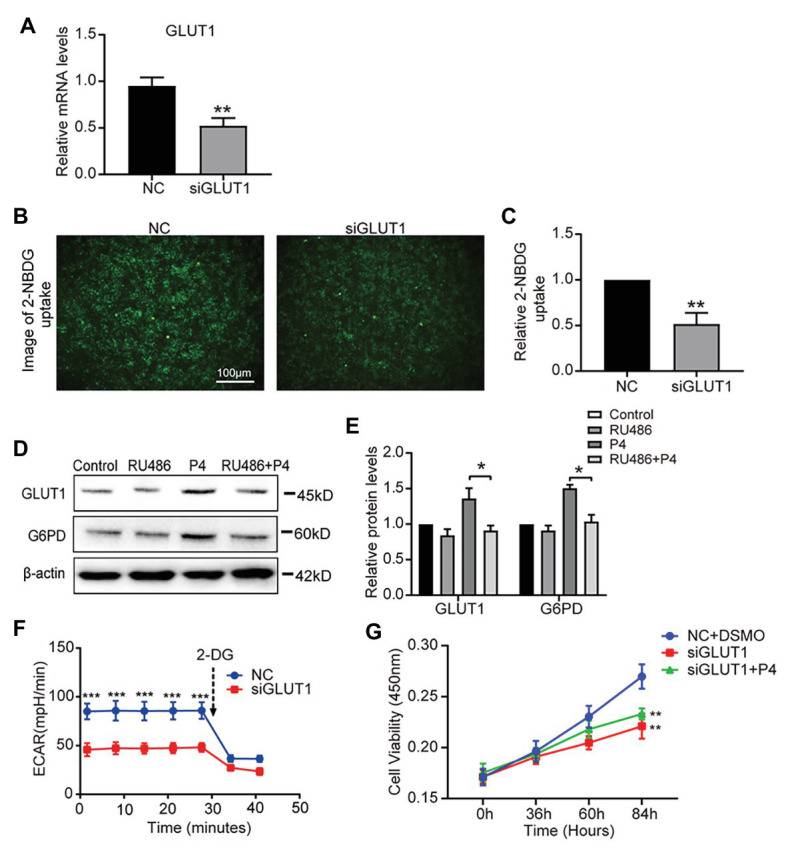
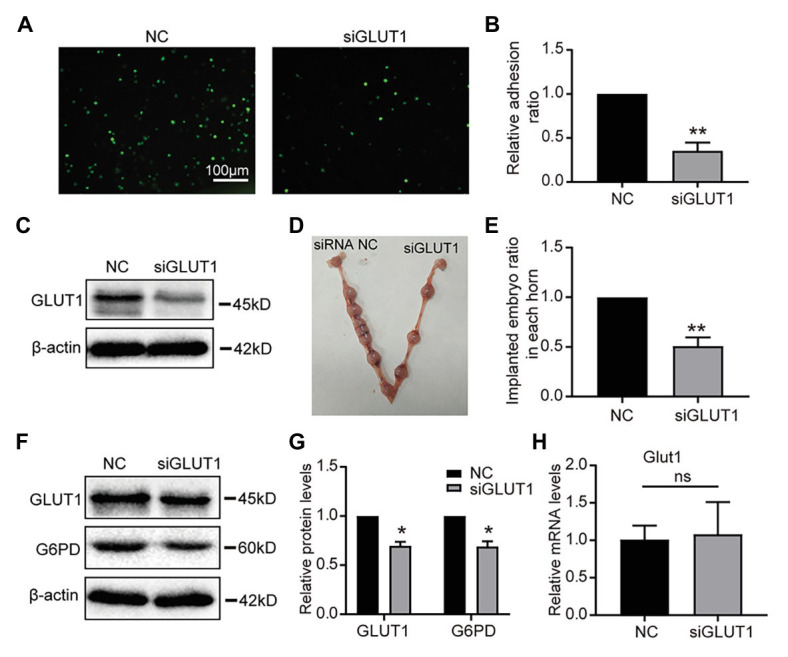
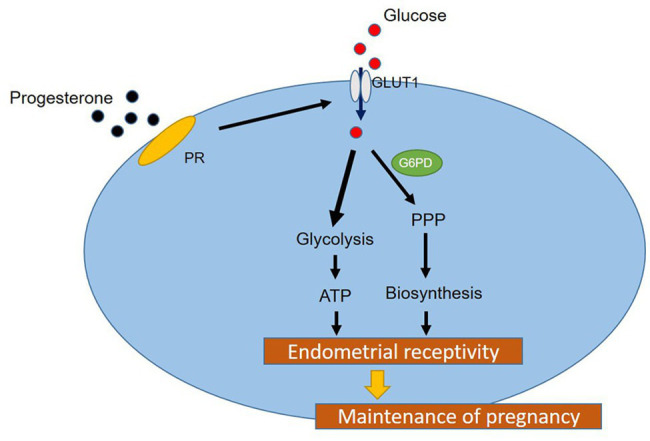
Successful embryo implantation requires receptive endometrium, which is conducive to the process of embryo recognition, adhesion, and invasion within a certain period of time and is inseparable from the dynamic interaction between 17β-estradiol (E2) and progesterone (P4). Proper glucose metabolism is critical for the profound physiological changes in the endometrium entering the receptive state. And glucose transporters (GLUTs) are responsible for intracellular uptake of glucose and are the first step in glucose metabolism. Prior literature has reported the presence of GLUTs in the endometrium. However, we still do not understand the specific mechanisms of this process. In this study, we identified the effect of P4 on glucose transporter 1 (GLUT1) using in vivo animal models and determined the regulation of glucose metabolism by P4 in cells. We highly suspect that this pregnancy failure may be due to reduced GLUT1-mediated glucose metabolism, resulting in a decrease in endometrial receptivity caused by an inadequate energy supply and synthesis of substrate. Here, we propose a possible mechanism to explain how embryo implantation is affected by P4 and glucose utilization under abnormal endometrial conditions.

Keywords: endometrial receptivity; glucose metabolism; glucose transporter 1; implantation; progesterone.


Figures

Figure 1
Figure 1
Glucose transporter 1 (GLUT1) expression during the peri-implantation period. (A) HE staining of human endometrial tissue (n = 5, scale bar = 25 μm). (B) The quantitative PCR (qPCR) analysis of GLUT1 and GLUT3 mRNA levels in human endometrial tissues at different phases (n = 10, normalized by β-actin, * vs. proliferative). (C) Immunohistochemistry (IHC) staining of the GLUT1 in the human endometrial tissues at different phases (n = 10, scale bar = 25 μm). (D) Relative stained density of GLUT1 in human endometrial tissue was counted with Image Pro-Plus software. * vs. Proliferative. (E) The qPCR analysis of Hoxa10 mRNA levels in mice uterus tissues on D1–D5 (n = 5, normalized by Gapdh, * vs. D1). (F) The qPCR analysis of GLUT1 mRNA levels in mice uterus tissues on D1–D5 (n = 5, normalized by Gapdh, * vs. D1). (G) IHC staining of GLUT1 protein in the mice uterus tissues on D1–D5 (n = 5, scale bar = 25 μm). (H) Relative stained density of GLUT1 in mice uterus tissues was counted with Image Pro-Plus software. * vs. D1. (I) The glycogen in the mice uterus tissues of D1–D5 were analyzed by periodic acid Schiff (PAS) staining assay kit (n = 5; scale bar = 25 μm). (J) Relative stained density of glycogen in mice uterus tissues was counted with Image Pro-Plus software. * vs. D1. Error bars represent the mean ± SD. Student’s t-test, * p < 0.05, ** p < 0.01.
Figure 2
Figure 2
GLUT1 expression is induced by progesterone (P4). (A) Western blot analysis of GLUT1 in RL95-2 cells treated with P4 (0, 10, and 100 nM, 0 nM group was added consistent DMSO as control) for 48 h. (B) Relative density analysis of the GLUT1 protein by Image Lab 4.0 software (n = 3, * vs. 0 nM). (C) The qPCR analysis of GLUT1 mRNA levels in the ovariectomized (OVX) mouse uterus treated with oil or P4 (n = 5, normalized by Gapdh, * vs. OVX + oil, non-OVX as the positive control). (D) IHC staining of the GLUT1 in the uterus of OVX + oil, OVX + P4, and non-OVX mice (n = 5, scale bar = 25 μm). (E) Relative stained density of GLUT1 in mice uterus tissues was counted with Image Pro-Plus. * vs. OVX + oil, non-OVX as the positive control. (F) Fluorescent image of 2-[N-(7-nitrobenz-2-oxa-1,3-diazol-4-yl)amino]-2-deoxy-D-glucose (2-NBDG) uptake in cells treated with P4 (0, 10, and 100 nM) for 48 h. (G) Relative 2-NBDG uptake ratio was analyzed by Image Pro-Plus (n = 3). Error bars represent the mean ± SD. Student’s t-test, * p < 0.05, ** p < 0.01.
Figure 3
Figure 3
P4 activates glucose metabolism and endometrial cell proliferation. RL95-2 intracellular pyruvate (A), lactate (B), and ATP levels (C) were detected using assay kits after stimulation with P4 (0, 10, and 100 nM) for 48 h (n = 3, * vs. 0 nM). (D) The extracellular acidification rate (ECAR; mpH/min) was measured under basal conditions in RL95-2 cells treated with different P4 concentrations (0, 10, and 100 nM). (E) Western blot analysis of glucose-6-phosphate dehydrogenase (G6PD) in RL95-2 cells treated with P4 (0, 10, and 100 nM) for 48 h. (F) Relative density analysis of the G6PD protein Image Lab 4.0 software (n = 3, * vs. 0 nM). (G) Cell proliferation assays of RL95-2 cells treated with P4 (0, 10, and 100 nM) for 48 h by Cell Counting Kit-8 (CCK-8). (H) Cell invasion in P4 (0, 10, and 100 nM)-treated RL95-2 cells by Transwell assay (scale bar = 100 μm). (I) Relative invasion rates were analyzed by Image Pro-Plus software (n = 3). Error bars represent the mean ± SD. Student’s t-test, * p < 0.05, ** p < 0.01, *** p < 0.001.
Figure 4
Figure 4
The down-regulation of GLUT1 inhibits glycolysis and proliferation. (A) The qPCR analysis of GLUT1 mRNA levels in RL95-2 cells treated with negative control (NC) small interfering RNA (siRNA) or GLUT1 siRNA (n = 3, normalized by β-actin). (B) Fluorescent image of 2-NBDG uptake into cells treated with NC siRNA or GLUT1 siRNA (scale bar = 100 μm) (C) The relative 2-NBDG uptake ratio was analyzed by Image-Pro Plus software. (D) Western blot analysis of GLUT1 and G6PD in RL95-2 cells treated with control, P4 (10 nM), RU486 (10 μM), and P4 + RU486. The cells were pretreated with RU486 for 1 h before the P4 treatment. (E) Relative density analysis of the GLUT1 and G6PD proteins by Image Lab 4.0 software (n = 3). (F) The ECAR (mpH/min) was measured under basal conditions in RL95-2 cells treated with NC siRNA or GLUT1 siRNA (n = 3). (G) Cell proliferation assays of RL95-2 cells treated with NC + DSMO, siGLUT1, and siGLUT1 + P4 (100 nM) by CCK-8; n = 3, * vs. NC + DSMO. Error bars represent the mean ± SD. Student’s t-test, * p < 0.05, ** p < 0.01, *** p < 0.001.
Figure 5
Figure 5
Effect of GLUT1 on embryo implantation in mice. (A) Adhesion of JAR cells onto RL95-2 endometrial epithelial cells was observed in response to GLUT1 silencing in vitro (scale bar = 100 μm). (B) The relative adhesion ratio of JAR cells on endometrial cells was analyzed by Image-Pro Plus software (n = 3). (C) Western blot analysis of GLUT1 in RL95-2 cells treated with NC siRNA or GLUT1 siRNA. (D) Typical photograph showing mice uteri on D7 of mating after injecting mus-NC siRNA (left) or GLUT1 siRNA (right). (E) The implanted embryos ratio was analyzed after injecting NC siRNA or GLUT1 siRNA (n = 5). (F) Western blot analysis of GLUT1 and G6PD in mice uteri on D7 of mating after injecting mus-NC siRNA (left) or GLUT1 siRNA (right). (G) Relative density analysis of the GLUT1 and G6PD by Image Lab 4.0 software (n = 3). (H) The qPCR analysis of Glut1 mRNA levels of embryos in the uterus of the transfection group and the NC group (n = 3, normalized by Gapdh, ns, no significant difference). Error bars represent the mean ± SD. Student’s t-test, * p < 0.05, ** p < 0.01.
Figure 6
Figure 6
A hypothetical working model of the molecular regulatory mechanism of P4 on GLUT1 in glucose metabolism.

Similar articles

Cited by

References

    1. Angulo C., Rauch M. C., Droppelmann A., Reyes A. M., Slebe J. C., Delgado-López F., et al. . (1998). Hexose transporter expression and function in mammalian spermatozoa: cellular localization and transport of hexoses and vitamin C. J. Cell. Biochem. 71, 189–203. 10.1002/(SICI)1097-4644(19981101)71:2<189::AID-JCB5>3.0.CO;2-R, PMID: - DOI - PubMed
    1. Bagot C. N., Troy P. J., Taylor H. S. (2000). Alteration of maternal Hoxa10 expression by in vivo gene transfection affects implantation. Gene Ther. 7, 1378–1384. 10.1038/sj.gt.3301245, PMID: - DOI - PubMed
    1. Carson D. D., Bagchi I., Dey S. K., Enders A. C., Fazleabas A. T., Lessey B. A., et al. . (2000). Embryo implantation. Dev. Biol. 223, 217–237. 10.1006/dbio.2000.9767, PMID: - DOI - PubMed
    1. Choi H. J., Chung T. W., Park M. J., Jung Y. S., Lee S. O., Kim K. J., et al. . (2017). Water-extracted tubers of Cyperus rotundus L. enhance endometrial receptivity through leukemia inhibitory factor-mediated expression of integrin αVβ3 and αVβ5. J. Ethnopharmacol. 208, 16–23. 10.1016/j.jep.2017.06.051, PMID: - DOI - PubMed
    1. Cui D., Sui L., Han X., Zhang M., Guo Z., Chen W., et al. . (2018). Aquaporin-3 mediates ovarian steroid hormone-induced motility of endometrial epithelial cells. Hum. Reprod. 33, 2060–2073. 10.1093/humrep/dey290, PMID: - DOI - PMC - PubMed