

Muscle Twitch Kinetics Are Dependent on Muscle Group, Disease State, and Age in Duchenne Muscular Dystrophy Mouse Models
- PMID: 33101056
- PMCID: PMC7545010
- DOI: 10.3389/fphys.2020.568909
Muscle Twitch Kinetics Are Dependent on Muscle Group, Disease State, and Age in Duchenne Muscular Dystrophy Mouse Models
Erratum in
-
Corrigendum: Muscle Twitch Kinetics Are Dependent on Muscle Group, Disease State, and Age in Duchenne Muscular Dystrophy Mouse Models.Front Physiol. 2022 Jan 5;12:820245. doi: 10.3389/fphys.2021.820245. eCollection 2021. Front Physiol. 2022. PMID: 35069268 Free PMC article.
Abstract
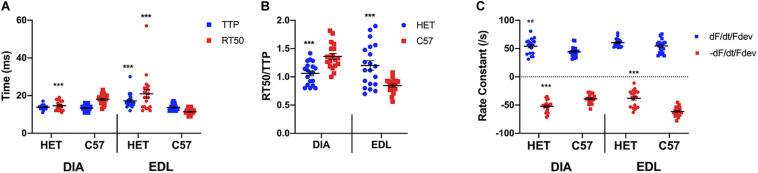
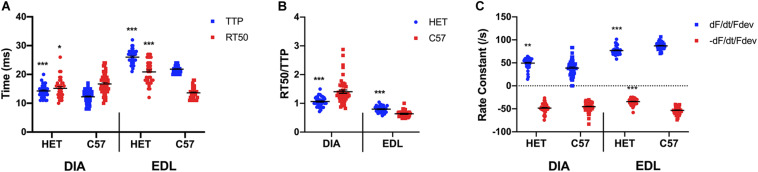
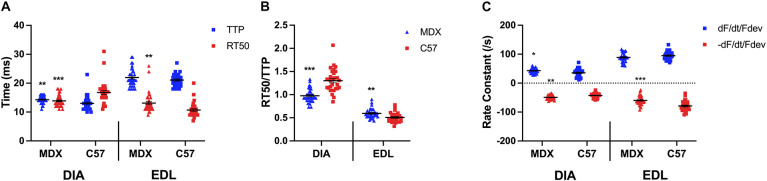
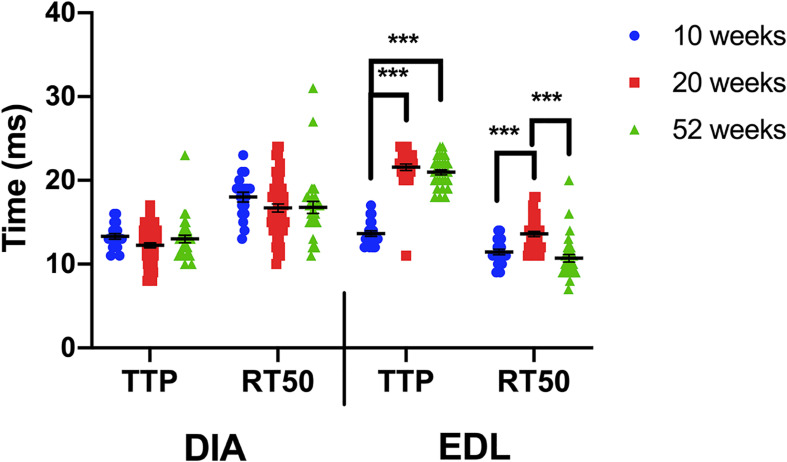
Duchenne muscular dystrophy (DMD) is an X-linked disorder caused by the lack of functional dystrophin protein. In muscular dystrophy preclinical research, it is pertinent to analyze the force of the muscles affected by the disease to assess pathology and potential effectiveness of therapeutic interventions. Although muscles function at sub-maximal levels in vivo, maximal tetanic contractions are most commonly used to assess and report muscle function in muscular dystrophy studies. At submaximal activation, the kinetics of contraction and relaxation are heavily impacted by the kinetics of the single twitch. However, maximal tetanic force is often the main, if not sole, outcome measured in most studies, while contractile kinetics are rarely reported. To investigate the effect of muscle disease on twitch contraction kinetics, isolated diaphragm and extensor digitorum longus (EDL) muscles of 10-, 20-week, "het" (dystrophin deficient and utrophin haplo-insufficient), and 52-week mdx (dystrophin deficient) mice were analyzed and compared to wild-type controls. We observed that twitch contractile kinetics are dependent on muscle type, age, and disease state. Specific findings include that diaphragm from wildtype mice has a greater time to 50% relaxation (RT50) than time to peak tension (TTP) compared to the het and mdx dystrophic models, where there is a similar TTP compared to RT50. Diaphragm twitch kinetics remain virtually unchanged with age, while the EDL from het and mdx mice initially has a greater RT50 than TTP, but the TTP increases with age. The difference between EDL contractile kinetics of dystrophic and wildtype mice is more prominent at young age. Differences in kinetics yielded greater statistical significance compared to previously published force measurements, thus, using kinetics as an outcome parameter could potentially allow for use of smaller experimental groups in future study designs. Although this study focused on DMD models, our findings may be applicable to other skeletal muscle conditions and diseases.
Keywords: age; contraction; muscular dystrophies; relaxation; skeletal muscle.
Copyright © 2020 Peczkowski, Rastogi, Lowe, Floyd, Schultz, Karaze, Davis, Rafael-Fortney and Janssen.
Figures
Similar articles
-
Contractile efficiency of dystrophic mdx mouse muscle: in vivo and ex vivo assessment of adaptation to exercise of functional end points.J Appl Physiol (1985). 2017 Apr 1;122(4):828-843. doi: 10.1152/japplphysiol.00776.2015. Epub 2017 Jan 5. J Appl Physiol (1985). 2017. PMID: 28057817
-
Neopterin/7,8-dihydroneopterin is elevated in Duchenne muscular dystrophy patients and protects mdx skeletal muscle function.Exp Physiol. 2018 Jul;103(7):995-1009. doi: 10.1113/EP087031. Exp Physiol. 2018. PMID: 29791760 Free PMC article.
-
Dystrophin-negative slow-twitch soleus muscles are not susceptible to eccentric contraction induced injury over the lifespan of the mdx mouse.Am J Physiol Cell Physiol. 2021 Oct 1;321(4):C704-C720. doi: 10.1152/ajpcell.00122.2021. Epub 2021 Aug 25. Am J Physiol Cell Physiol. 2021. PMID: 34432537
-
Utrophin haploinsufficiency does not worsen the functional performance, resistance to eccentric contractions and force production of dystrophic mice.PLoS One. 2018 Jun 7;13(6):e0198408. doi: 10.1371/journal.pone.0198408. eCollection 2018. PLoS One. 2018. PMID: 29879154 Free PMC article.
-
Hypochlorous acid exposure impairs skeletal muscle function and Ca2+ signalling: implications for Duchenne muscular dystrophy pathology.J Physiol. 2023 Dec;601(23):5257-5275. doi: 10.1113/JP285263. Epub 2023 Oct 21. J Physiol. 2023. PMID: 37864413
Cited by
-
Extensor carpi ulnaris muscle shows unexpected slow-to-fast fiber-type switch in Duchenne muscular dystrophy dogs.Dis Model Mech. 2021 Dec 1;14(12):dmm049006. doi: 10.1242/dmm.049006. Epub 2021 Dec 16. Dis Model Mech. 2021. PMID: 34704592 Free PMC article.
-
Loss of α-actinin-3 confers protection from eccentric contraction damage in fast-twitch EDL muscles from aged mdx dystrophic mice by reducing pathological fibre branching.Hum Mol Genet. 2022 May 4;31(9):1417-1429. doi: 10.1093/hmg/ddab326. Hum Mol Genet. 2022. PMID: 34761268 Free PMC article.
-
Lifespan Analysis of Dystrophic mdx Fast-Twitch Muscle Morphology and Its Impact on Contractile Function.Front Physiol. 2021 Dec 7;12:771499. doi: 10.3389/fphys.2021.771499. eCollection 2021. Front Physiol. 2021. PMID: 34950049 Free PMC article.
References
-
- Addinsall A. B., Forgan L. G., McRae N. L., Kelly R. W., McDonald P. L., McNeill B., et al. (2020). Treatment of dystrophic mdx mice with an ADAMTS-5 specific monoclonal antibody increases the ex vivo strength of isolated fast twitch hindlimb muscles. Biomolecules 10:416. 10.3390/biom10030416 - DOI - PMC - PubMed
Grants and funding
LinkOut - more resources
Full Text Sources
Molecular Biology Databases