. 2020 Sep 30:11:542372.
doi: 10.3389/fmicb.2020.542372. eCollection 2020.

Seasonal and Geographical Transitions in Eukaryotic Phytoplankton Community Structure in the Atlantic and Pacific Oceans

Affiliations

Seasonal and Geographical Transitions in Eukaryotic Phytoplankton Community Structure in the Atlantic and Pacific Oceans

Chang Jae Choi et al. Front Microbiol. .

Abstract

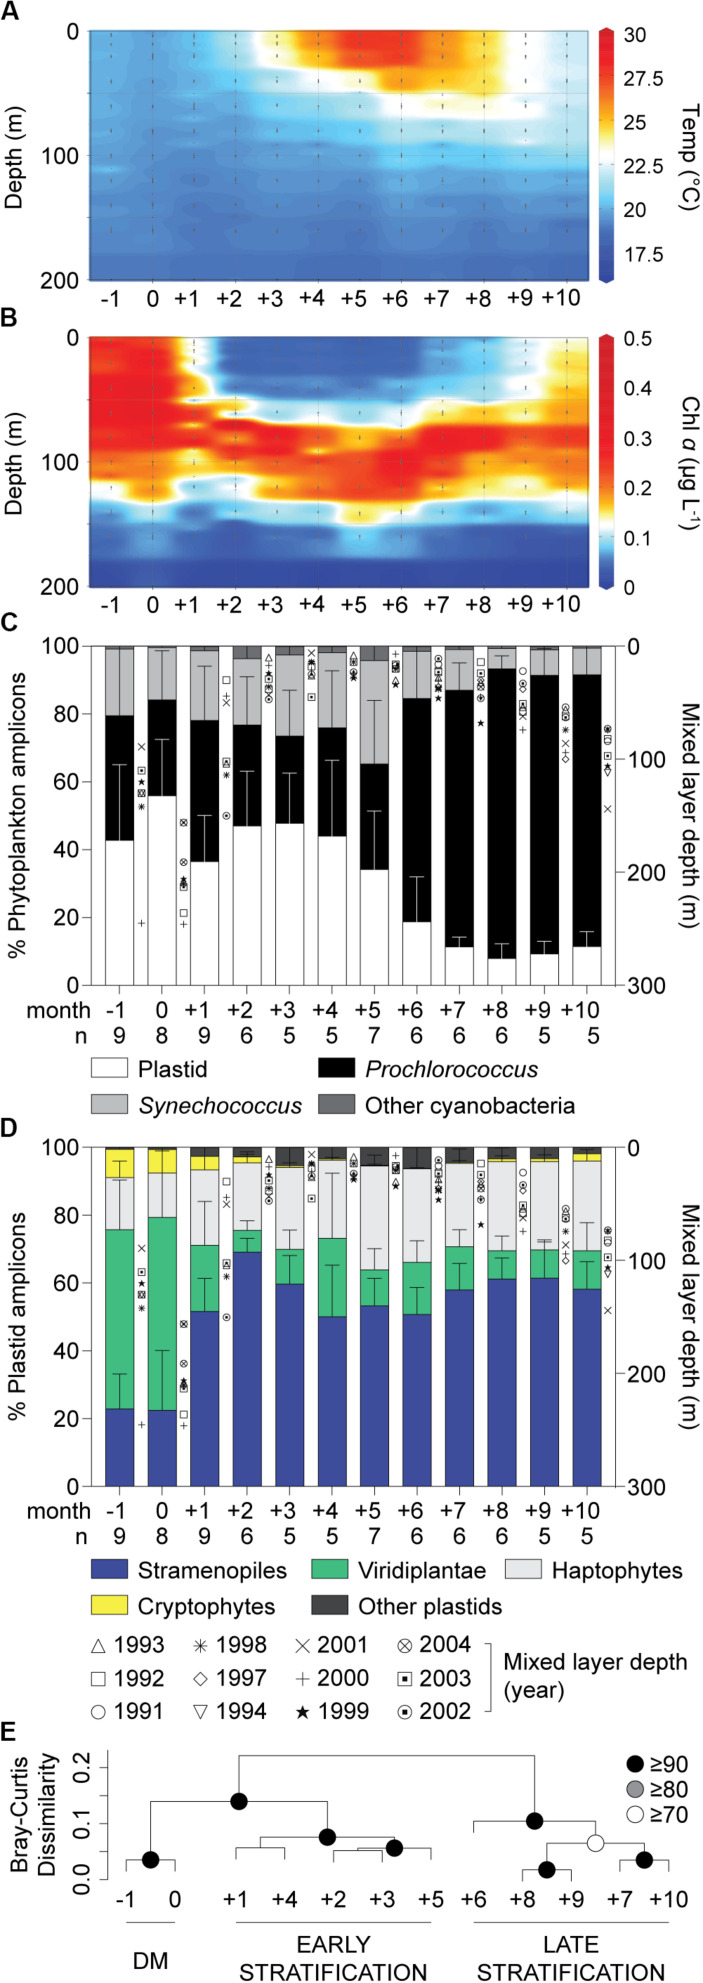
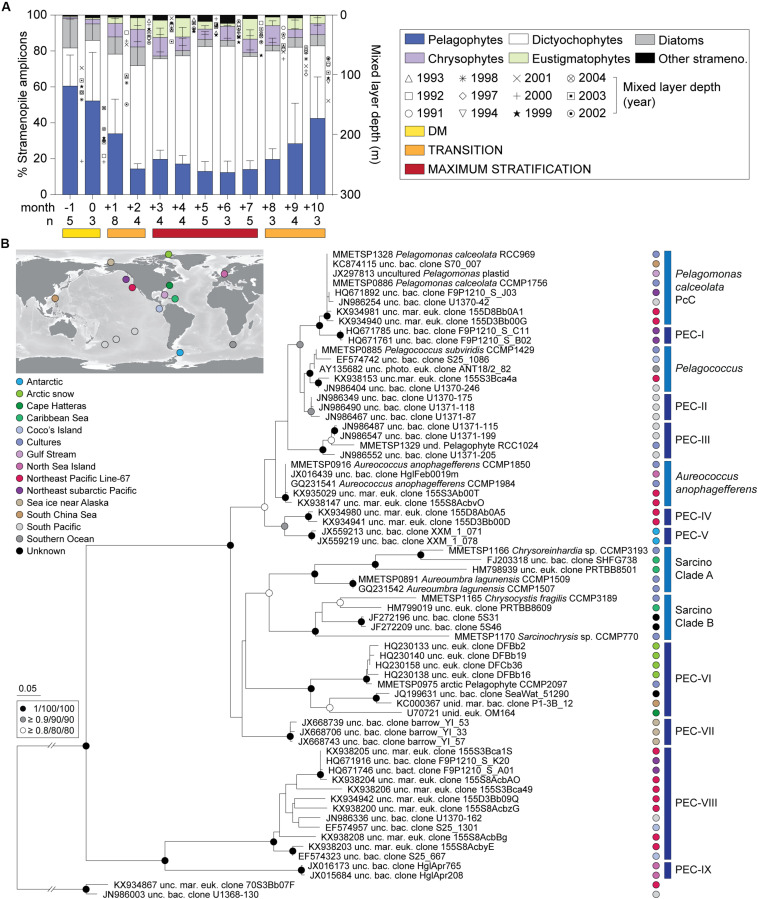
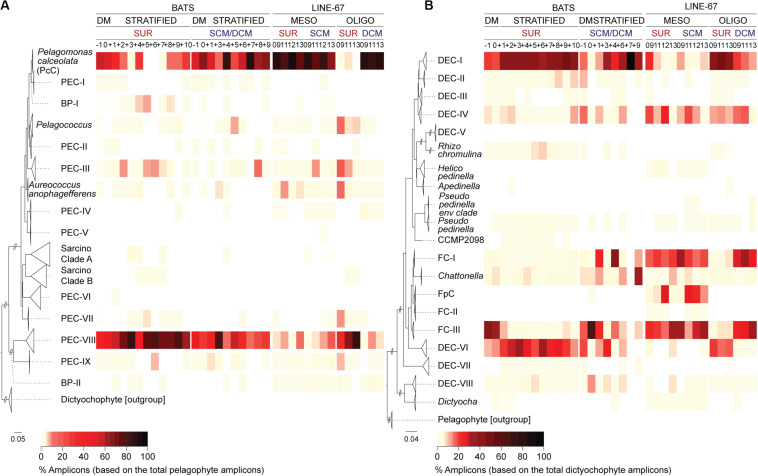
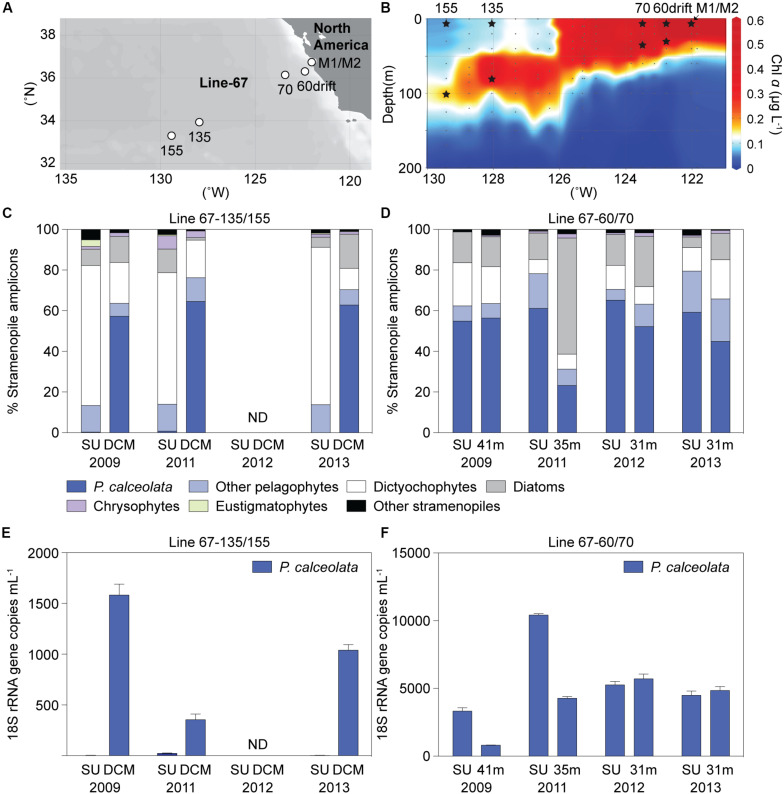
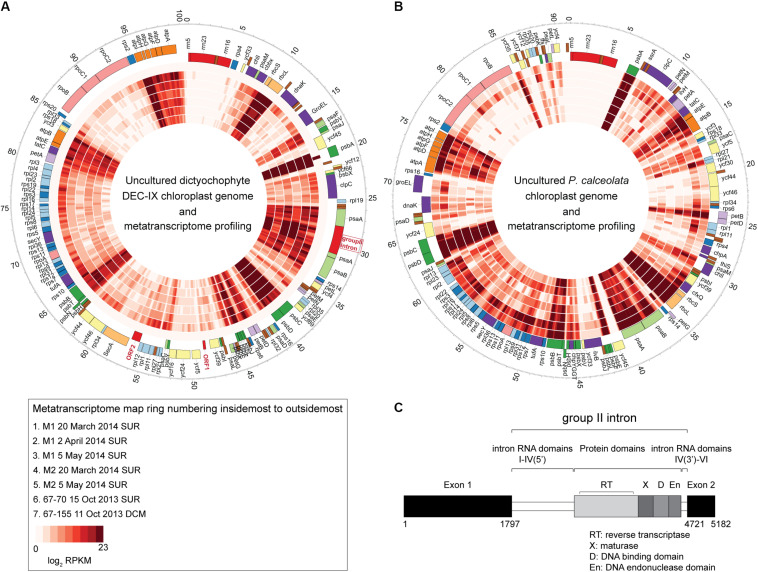
Much is known about how broad eukaryotic phytoplankton groups vary according to nutrient availability in marine ecosystems. However, genus- and species-level dynamics are generally unknown, although important given that adaptation and acclimation processes differentiate at these levels. We examined phytoplankton communities across seasonal cycles in the North Atlantic (BATS) and under different trophic conditions in the eastern North Pacific (ENP), using phylogenetic classification of plastid-encoded 16S rRNA amplicon sequence variants (ASVs) and other methodologies, including flow cytometric cell sorting. Prasinophytes dominated eukaryotic phytoplankton amplicons during the nutrient-rich deep-mixing winter period at BATS. During stratification ('summer') uncultured dictyochophytes formed ∼35 ± 10% of all surface plastid amplicons and dominated those from stramenopile algae, whereas diatoms showed only minor, ephemeral contributions over the entire year. Uncultured dictyochophytes also comprised a major fraction of plastid amplicons in the oligotrophic ENP. Phylogenetic reconstructions of near-full length 16S rRNA sequences established 11 uncultured Dictyochophyte Environmental Clades (DEC). DEC-I and DEC-VI dominated surface dictyochophytes under stratification at BATS and in the ENP, and DEC-IV was also important in the latter. Additionally, although less common at BATS, Florenciella-related clades (FC) were prominent at depth in the ENP. In both ecosystems, pelagophytes contributed notably at depth, with PEC-VIII (Pelagophyte Environmental Clade) and (cultured) Pelagomonas calceolata being most important. Q-PCR confirmed the near absence of P. calceolata at the surface of the same oligotrophic sites where it reached ∼1,500 18S rRNA gene copies ml-1 at the DCM. To further characterize phytoplankton present in our samples, we performed staining and at-sea single-cell sorting experiments. Sequencing results from these indicated several uncultured dictyochophyte clades are comprised of predatory mixotrophs. From an evolutionary perspective, these cells showed both conserved and unique features in the chloroplast genome. In ENP metatranscriptomes we observed high expression of multiple chloroplast genes as well as expression of a selfish element (group II intron) in the psaA gene. Comparative analyses across the Pacific and Atlantic sites support the conclusion that predatory dictyochophytes thrive under low nutrient conditions. The observations that several uncultured dictyochophyte lineages are seemingly capable of photosynthesis and predation, raises questions about potential shifts in phytoplankton trophic roles associated with seasonality and long-term ocean change.

Keywords: chloroplast genome; dictyochophytes; phytoplankton diversity; single-cell genomics; time-series.


Figures

FIGURE 1
FIGURE 1
Characteristics of the water column and phytoplankton distributions in the northwestern Sargasso Sea. (A) Mean temperature and (B) chlorophyll a concentrations show the oceanographic details in this study site. (C) The relative abundance of overall phytoplankton 16S V1-V2 amplicons expressed as a percentage of amplicons phylogenetically assigned to plastids, Prochlorococcus, Synechococcus and other cyanobacterial groups and (D) major eukaryotic phytoplankton lineages illustrate broad spatiotemporal dynamics of phytoplankton diversity and distribution in surface waters. Integrated monthly data from 1991 to 2004 at the BATS site after adjusting to the month of the maximum mixed layer depth (month 0). (E) Hierarchical clustering analysis with Bray-Curtis dissimilarity based on the relative abundance of plastid amplicons after assignment to broad taxonomic groups alongside cyanobacterial amplicons in surface waters. Approximately unbiased (AU) probability values based on multiscale bootstrap resampling (10,000 replicates) were calculated and expressed as p-values (%). The annual transition from the deep mixing (DM) period to early (Early Stratification) and late stratified (Late Stratification) periods is indicated. Error bars represent the standard deviation. The number of samples used (with each having all data types) for developing unweighted means and pooled standard deviation is indicated by n.
FIGURE 2
FIGURE 2
Photosynthetic stramenopile class distributions in the northwestern Sargasso Sea and reference trees for finer-scale analyses. (A) Photosynthetic stramenopile distributions expressed as a percentage of amplicons phylogenetically assigned to stramenopile classes at BATS surface (0.3–7.6 m). Error bars represent the standard deviation and ‘n’ indicates the number of samples used for the analysis. Phylogenetic reference trees were developed to then resolve clades within the (B) pelagophytes and dictyochophytes (Supplementary Figure S5) using near full-length 16S rRNA gene sequences. For pelagophytes, sequences came from nine cultured species, 56 environmental clones and two dictyochophyte sequences as an outgroup. The tree was constructed with Maximum Likelihood inference (RAxML) under the gamma corrected GTR model of evolution with 1,000 bootstrap replicates. Additional phylogenetic reconstructions were performed with PhyML and MrBayes and the node statistical supports are indicated. Five known clades were resolved and previously unrecognized nine additional clades were identified Pelagophyte Environmental Clades I-IX (PEC-I to PEC-IX). These were primarily comprised of environmental sequences. Colors indicate oceanic region of origin.
FIGURE 3
FIGURE 3
Diversity and distributions of newly resolved dictyochophyte and pelagophyte clades at BATS and in the ENP. High-taxonomic resolution of (A) pelagophyte and (B) dictyochophyte distributions at the surface (SUR) and depth (SCM/DCM) at BATS and ENP. Reference trees to the left of each panel indicate clades. Heatmaps show the percentage of amplicons relative to those of pelagophytes (A) and dictyochophytes (B) during each BATS month or ENP samples (vertical columns; see Figure 4 for additional details on ENP samples). Bootstrap support and phylogenetic inferences are as detailed in Figure 2B and Supplementary Figure S5. ENP samples are partitioned based on standing stock nutrient concentrations which were considered mesotrophic (MESO) or oligotrophic (OLIGO) (Supplementary Table S5).
FIGURE 4
FIGURE 4
ENP (A) stations and (B) chlorophyll a depth profile in 2009 with sampling for DNA indicated by stars (Stations 67-60drift and 67-70, mesotrophic sites; Stations 67-135 and 67-155, oligotrophic sites). Relative abundance of stramenopile V1-V2 16S rRNA gene amplicons assigned to the Pelagomonas calceolata Clade or other groups in Line-67 samples. (C) Taxon distributions at sites with well stratified water columns where nitrate was 0.02 and 0.08 μM (plus 1 sample < 30 nM detection limit) at the surface and 0.05 to 0.3 μM (0.17 ± 0.13 μM, n = 3) in the deep chlorophyll maximum (DCM). (D) Distributions in surface (SU, 2–14 m) or near the base of the photic zone (31-41 m) at mesotrophic sites. (E,F) P. calceolata 18S rRNA gene copies ml–1 enumerated by qPCR in the same samples as analyzed for panels C, D. Note the different scale on the y-axis in (E) and (F). ND: no data. Error bars represent the standard deviation of three technical replicates.
FIGURE 5
FIGURE 5
The complete chloroplast genome of (A) uncultured dictyochophyte DEC-IX (B) and wild P. calceolata (Worden et al., 2012), and transcriptional activity in the ENP. Recruitment of metatranscriptomic reads (inner layers) at ≥ 99% nucleotide identity shown as mapped reads binned at 100 bp increments and log2 transformed for the heat plots which reflect the normalized transcripts. While the metatranscriptomes were unreplicated and therefore unsuitable for quantifying expression, qualitatively, similar patterns of expression were observed for genes present in both the DEC-IX and P. calceolata chloroplast genomes. All come from surface samples except the 67-155 metatranscriptome (100 m, DCM). Outermost ticks represent kilobase pairs (chloroplast genome size). (C) Structure of the psaA gene group II intron, showing upstream and downstream exons, intron domains and conserved IEP consisting of a reverse transcriptase (RT), a maturase domain (X), a DNA-binding domain (D) and an endonuclease domain (En).

References

    1. Allers E., Wright J. J., Konwar K. M., Howes C. G., Beneze E., Hallam S. J., et al. (2013). Diversity and population structure of marine group a bacteria in the Northeast subarctic Pacific Ocean. ISME J. 7 256–268. 10.1038/ismej.2012.108 - DOI - PMC - PubMed
    1. Anders S., Pyl P. T., Huber W. (2015). HTSeq–a Python framework to work with high-throughput sequencing data. Bioinformatics 31 166–169. 10.1093/bioinformatics/btu638 - DOI - PMC - PubMed
    1. Andersen R. A. (2004). Biology and systematics of heterokont and haptophyte algae. Am. J. Bot. 91 1508–1522. 10.3732/ajb.91.10.1508 - DOI - PubMed
    1. Andersen R. A., Bidigare R. R., Keller M. D., Latasa M. (1996). A comparison of HPLC pigment signatures and electron microscopic observations for oligotrophic waters of the North Atlantic and Pacific Oceans. Deep Sea Res. Part II Top. Stud. Oceanogr. 43 517–537. 10.1016/0967-0645(95)00095-x - DOI
    1. Andersen R. A., Saunders G. W., Paskind M. P., Sexton J. P. (1993). Ultrastructure and 18S rRNA gene sequence for Pelagomonas calceolata gen. et sp. nov. and the description of a new algal class, the Pelagophyceae classis nov. J. Phycol. 29 701–715. 10.1111/j.0022-3646.1993.00701.x - DOI