

Genetic Spectrum and Distinct Evolution Patterns of SARS-CoV-2
- PMID: 33101264
- PMCID: PMC7545136
- DOI: 10.3389/fmicb.2020.593548
Genetic Spectrum and Distinct Evolution Patterns of SARS-CoV-2
Abstract
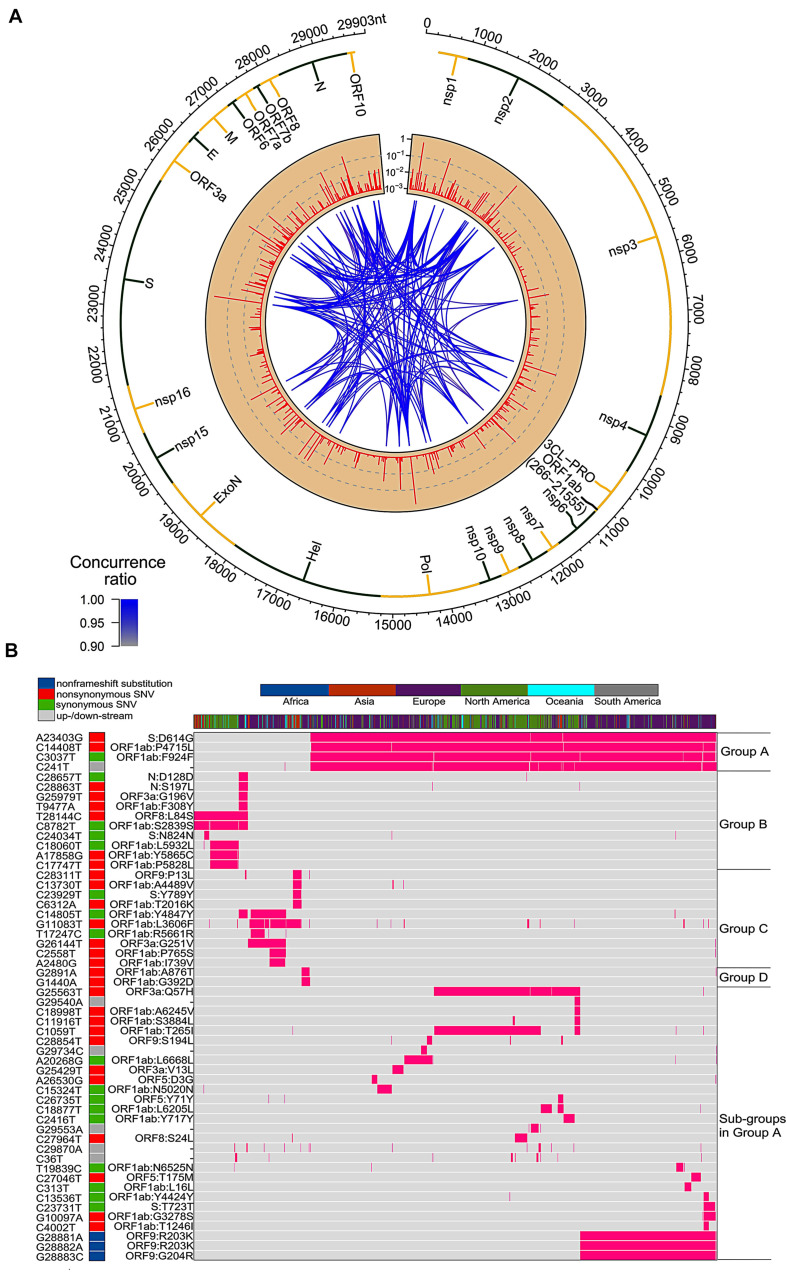
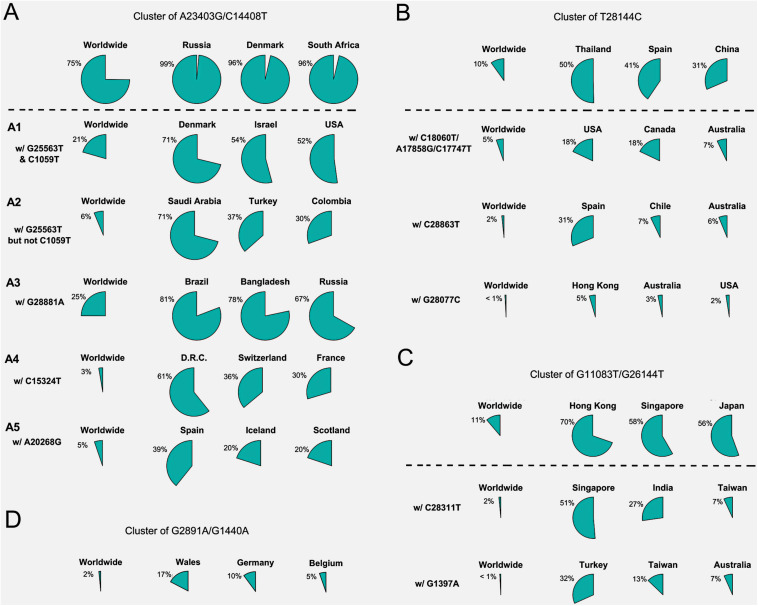
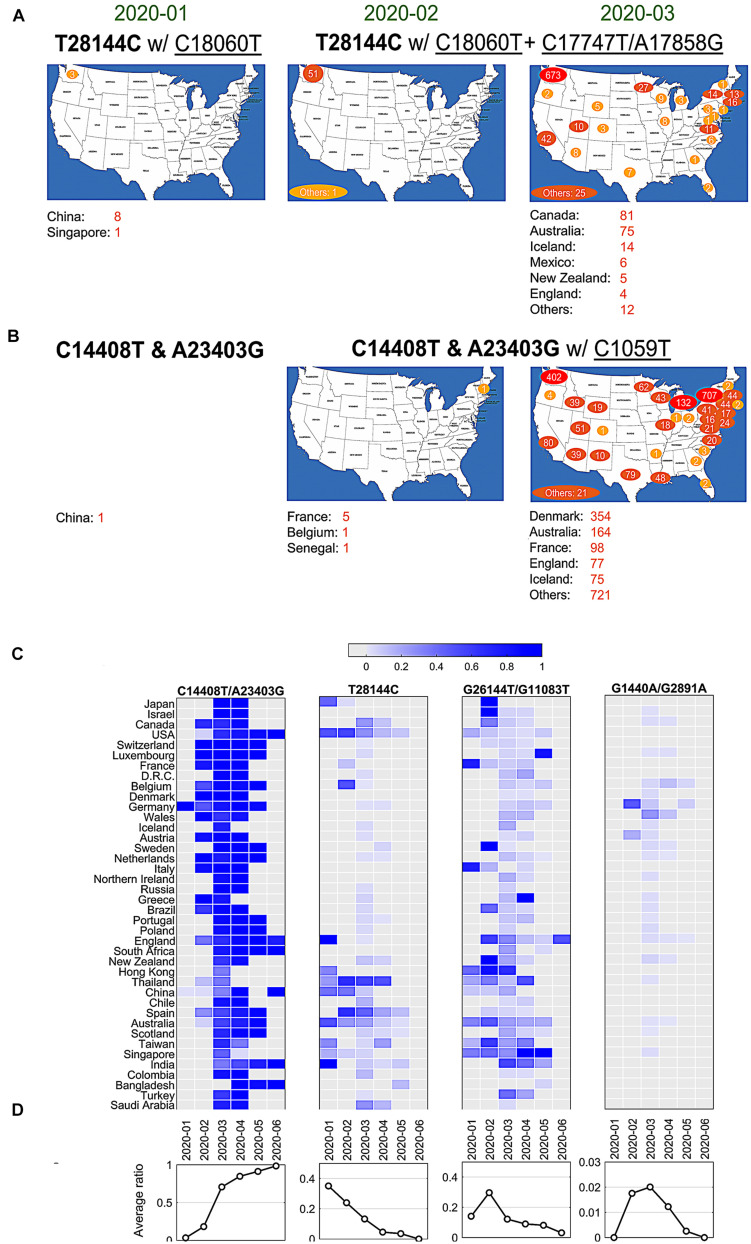
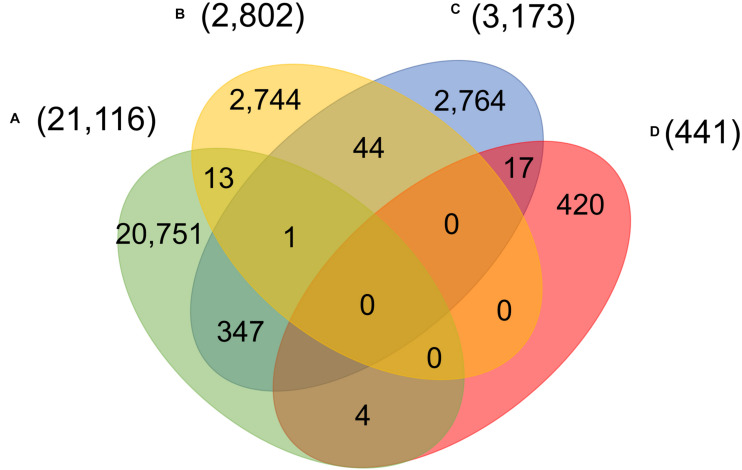
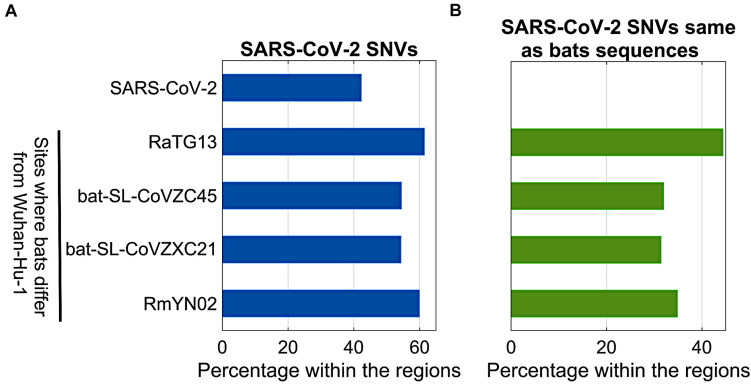
Four signature groups of frequently occurred single-nucleotide variants (SNVs) were identified in over twenty-eight thousand high-quality and high-coverage SARS-CoV-2 complete genome sequences, representing different viral strains. Some SNVs predominated but were mutually exclusively presented in patients from different countries and areas. These major SNV signatures exhibited distinguishable evolution patterns over time. A few hundred patients were detected with multiple viral strain-representing mutations simultaneously, which may stand for possible co-infection or potential homogenous recombination of SARS-CoV-2 in environment or within the viral host. Interestingly nucleotide substitutions among SARS-CoV-2 genomes tended to switch between bat RaTG13 coronavirus sequence and Wuhan-Hu-1 genome, indicating the higher genetic instability or tolerance of mutations on those sites or suggesting that major viral strains might exist between Wuhan-Hu-1 and RaTG13 coronavirus.
Keywords: COVID-19; SARS-CoV-2 genome; clustering; co-infection; evolution; genetic variants.
Copyright © 2020 Liu, Shen, Fang, Li, Liu, Yang, Hu and Wan.
Figures
Update of
-
Genetic spectrum and distinct evolution patterns of SARS-CoV-2.medRxiv [Preprint]. 2020 Aug 5:2020.06.16.20132902. doi: 10.1101/2020.06.16.20132902. medRxiv. 2020. Update in: Front Microbiol. 2020 Sep 25;11:593548. doi: 10.3389/fmicb.2020.593548. PMID: 32588000 Free PMC article. Updated. Preprint.
Similar articles
-
Genetic spectrum and distinct evolution patterns of SARS-CoV-2.medRxiv [Preprint]. 2020 Aug 5:2020.06.16.20132902. doi: 10.1101/2020.06.16.20132902. medRxiv. 2020. Update in: Front Microbiol. 2020 Sep 25;11:593548. doi: 10.3389/fmicb.2020.593548. PMID: 32588000 Free PMC article. Updated. Preprint.
-
Insertion-and-Deletion Mutations between the Genomes of SARS-CoV, SARS-CoV-2, and Bat Coronavirus RaTG13.Microbiol Spectr. 2022 Jun 29;10(3):e0071622. doi: 10.1128/spectrum.00716-22. Epub 2022 Jun 6. Microbiol Spectr. 2022. PMID: 35658573 Free PMC article.
-
Computational Inference of Selection Underlying the Evolution of the Novel Coronavirus, Severe Acute Respiratory Syndrome Coronavirus 2.J Virol. 2020 Jun 1;94(12):e00411-20. doi: 10.1128/JVI.00411-20. Print 2020 Jun 1. J Virol. 2020. PMID: 32238584 Free PMC article.
-
Molecular Evolution of Human Coronavirus 229E in Hong Kong and a Fatal COVID-19 Case Involving Coinfection with a Novel Human Coronavirus 229E Genogroup.mSphere. 2021 Feb 10;6(1):e00819-20. doi: 10.1128/mSphere.00819-20. mSphere. 2021. PMID: 33568452 Free PMC article.
-
Evolutionary dynamics of the severe acute respiratory syndrome coronavirus 2 genomes.Med Rev (2021). 2022 Mar 1;2(1):3-22. doi: 10.1515/mr-2021-0035. eCollection 2022 Feb 1. Med Rev (2021). 2022. PMID: 35658106 Free PMC article. Review.
Cited by
-
Early Diffusion of SARS-CoV-2 Infection in the Inner Area of the Italian Sardinia Island.Front Microbiol. 2021 Feb 12;11:628194. doi: 10.3389/fmicb.2020.628194. eCollection 2020. Front Microbiol. 2021. PMID: 33643227 Free PMC article.
-
Investigating Cellular Trajectories in the Severity of COVID-19 and Their Transcriptional Programs Using Machine Learning Approaches.Genes (Basel). 2021 Apr 24;12(5):635. doi: 10.3390/genes12050635. Genes (Basel). 2021. PMID: 33923155 Free PMC article.
-
Novel and emerging mutations of SARS-CoV-2: Biomedical implications.Biomed Pharmacother. 2021 Jul;139:111599. doi: 10.1016/j.biopha.2021.111599. Epub 2021 Apr 23. Biomed Pharmacother. 2021. PMID: 33915502 Free PMC article. Review.
-
V483A: an emerging mutation hotspot of SARS-CoV-2.Future Virol. 2021 May:10.2217/fvl-2020-0384. doi: 10.2217/fvl-2020-0384. Future Virol. 2021. PMID: 34194534 Free PMC article. Review.
-
SARS-CoV-2, Zika viruses and mycoplasma: Structure, pathogenesis and some treatment options in these emerging viral and bacterial infectious diseases.Biochim Biophys Acta Mol Basis Dis. 2021 Dec 1;1867(12):166264. doi: 10.1016/j.bbadis.2021.166264. Epub 2021 Sep 3. Biochim Biophys Acta Mol Basis Dis. 2021. PMID: 34481867 Free PMC article.
References
Grants and funding
LinkOut - more resources
Full Text Sources
Miscellaneous