. 2020 Sep 30:11:1814.
doi: 10.3389/fimmu.2020.01814. eCollection 2020.

Molecular and Functional Diversity of Distinct Subpopulations of the Stressed Insulin-Secreting Cell's Vesiculome

Affiliations

Molecular and Functional Diversity of Distinct Subpopulations of the Stressed Insulin-Secreting Cell's Vesiculome

Khem Raj Giri et al. Front Immunol. .

Abstract

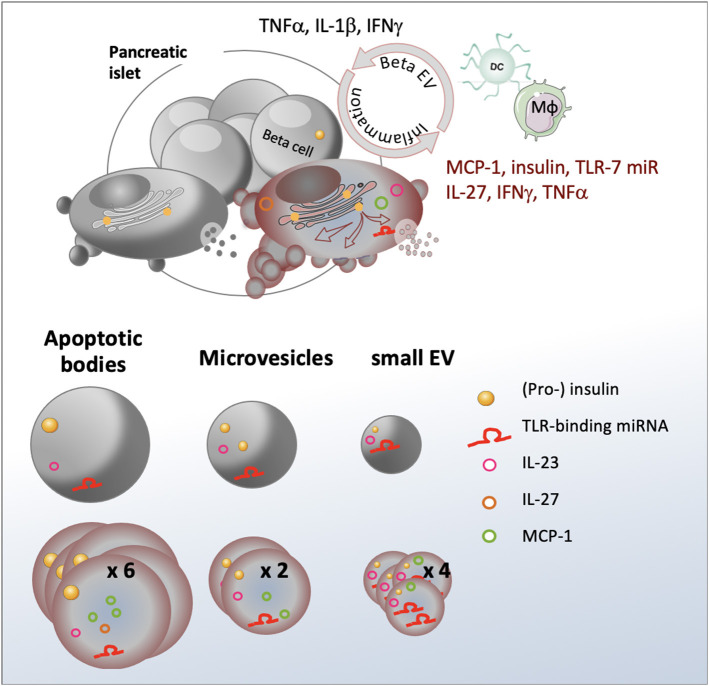
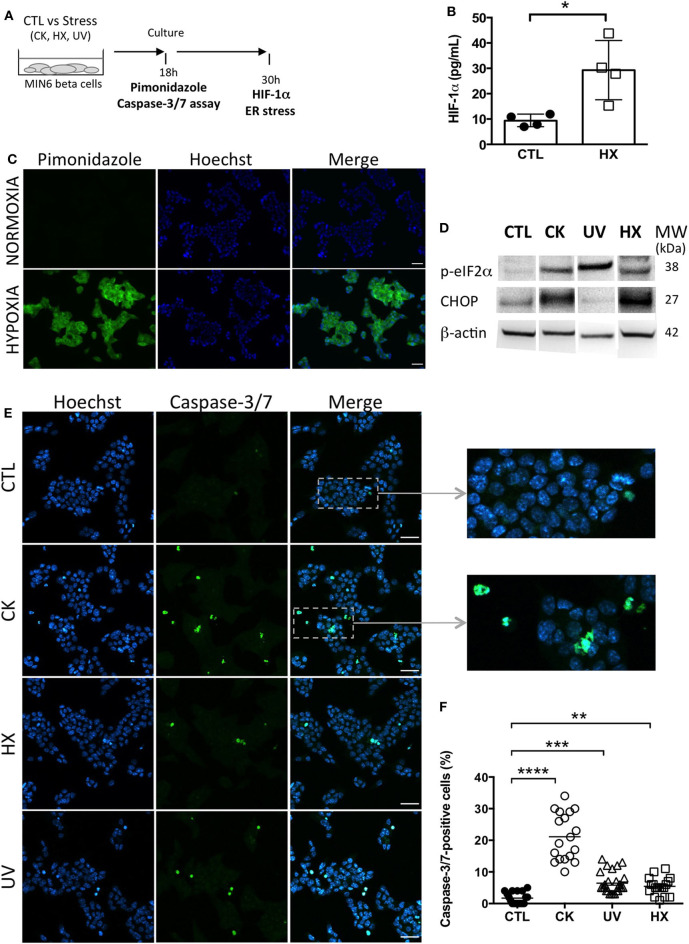
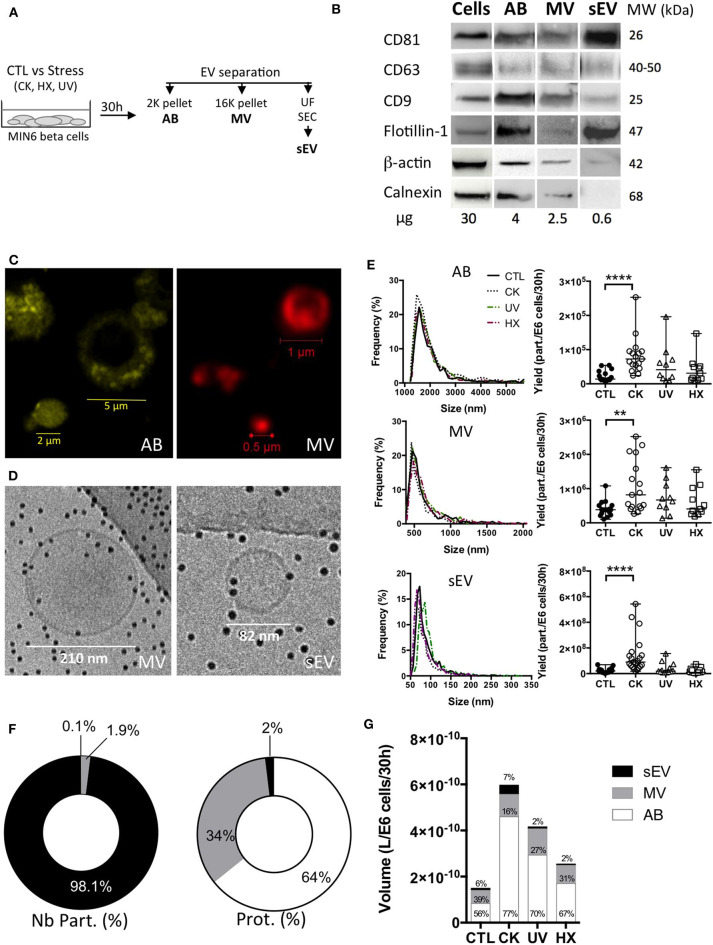
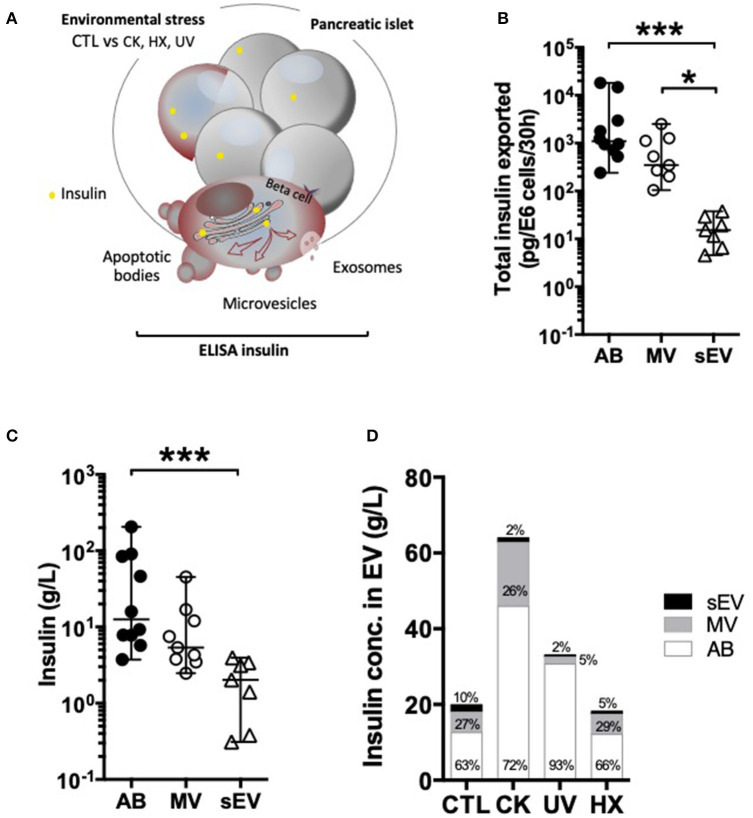
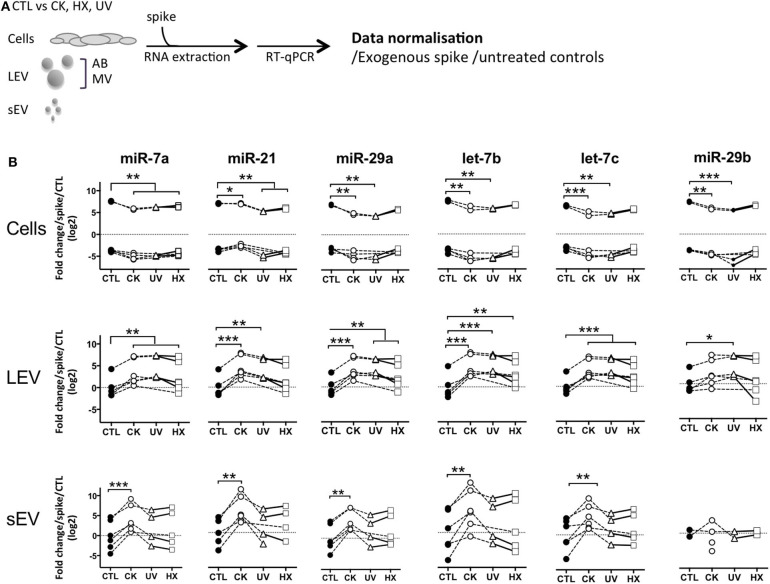
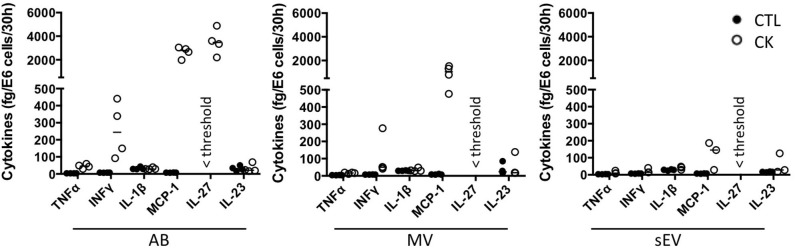
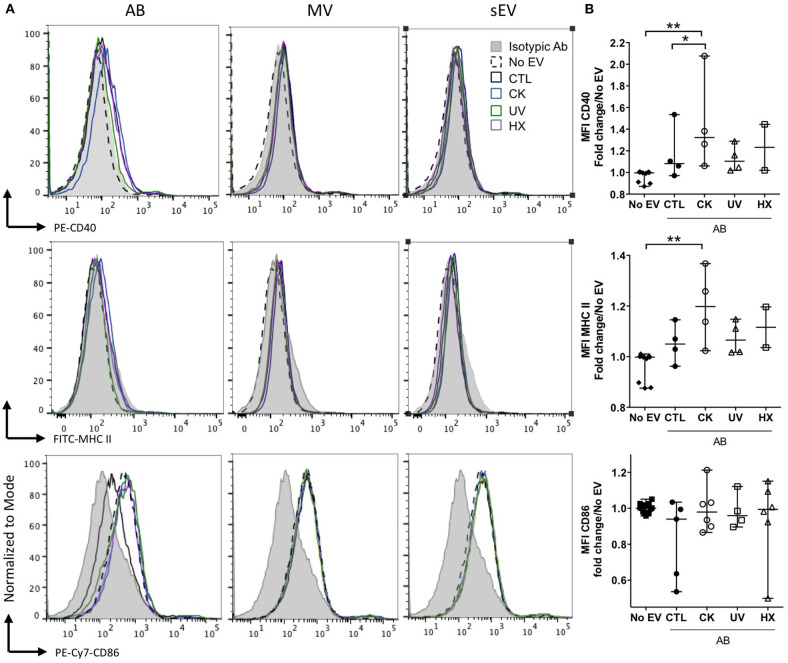
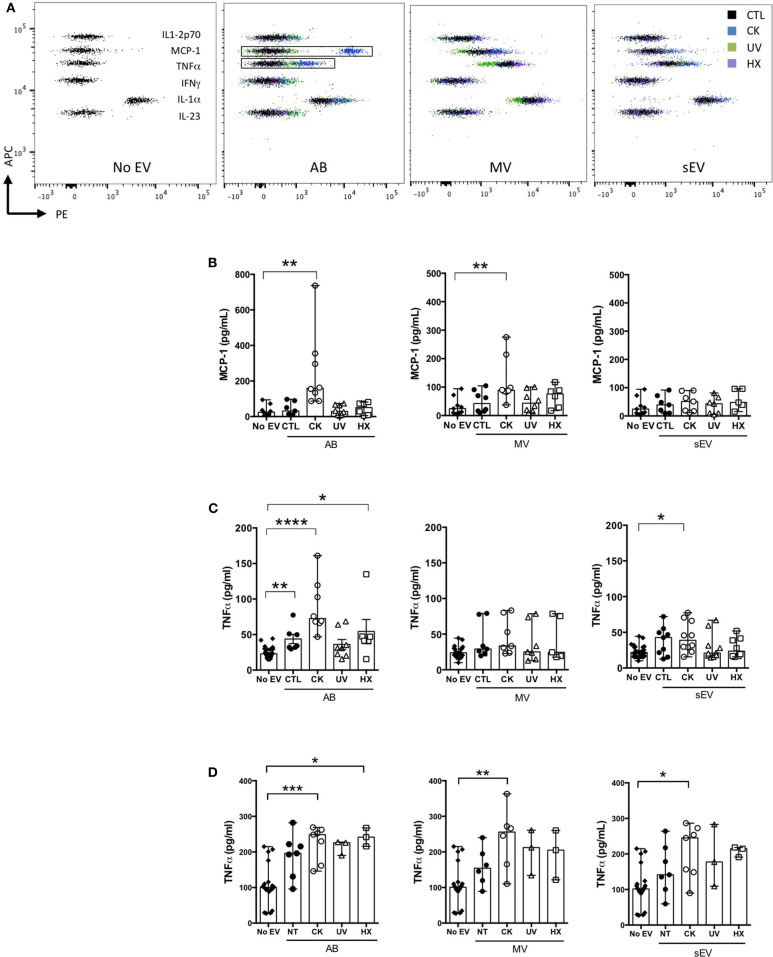
Beta cell failure and apoptosis following islet inflammation have been associated with autoimmune type 1 diabetes pathogenesis. As conveyors of biological active material, extracellular vesicles (EV) act as mediators in communication with immune effectors fostering the idea that EV from inflamed beta cells may contribute to autoimmunity. Evidence accumulates that beta exosomes promote diabetogenic responses, but relative contributions of larger vesicles as well as variations in the composition of the beta cell's vesiculome due to environmental changes have not been explored yet. Here, we made side-by-side comparisons of the phenotype and function of apoptotic bodies (AB), microvesicles (MV) and small EV (sEV) isolated from an equal amount of MIN6 beta cells exposed to inflammatory, hypoxic or genotoxic stressors. Under normal conditions, large vesicles represent 93% of the volume, but only 2% of the number of the vesicles. Our data reveal a consistently higher release of AB and sEV and to a lesser extent of MV, exclusively under inflammatory conditions commensurate with a 4-fold increase in the total volume of the vesiculome and enhanced export of immune-stimulatory material including the autoantigen insulin, microRNA, and cytokines. Whilst inflammation does not change the concentration of insulin inside the EV, specific Toll-like receptor-binding microRNA sequences preferentially partition into sEV. Exposure to inflammatory stress engenders drastic increases in the expression of monocyte chemoattractant protein 1 in all EV and of interleukin-27 solely in AB suggesting selective sorting toward EV subspecies. Functional in vitro assays in mouse dendritic cells and macrophages reveal further differences in the aptitude of EV to modulate expression of cytokines and maturation markers. These findings highlight the different quantitative and qualitative imprints of environmental changes in subpopulations of beta EV that may contribute to the spread of inflammation and sustained immune cell recruitment at the inception of the (auto-) immune response.

Keywords: Toll-like receptor; apoptotic bodies; exosomes; extracellular vesicles; microRNA; microvesicles; type 1 diabetes.


Figures

Graphical Abstract
Graphical Abstract
Figure 1
Figure 1
Experimental beta cell stress induces apoptosis. (A) After exposure to stress [TNFα, IL-1β, IFN-γ cytokines; CK], hypoxia (HX), ultraviolet (UV)] or not [control (CTL)], MIN6 cells were cultured in 1% FCS exosome-depleted OptiMEM medium. (B,C) For cultures grown under normoxic and hypoxic conditions, (B) After 24 h of culture, MIN6 cells were treated with 100 μM pimonidazole and incubated for 2 h followed by immunohistochemical detection of pimonidazole adducts (green). Nuclei were counterstained with Hoechst 33342 (blue). Scalebar 30 μm. Representative images of one out of three independent experiments are shown. (C) ELISA of the expression of HIF-1α in cells grown under normoxia or hypoxia for 30 h. Data from 4 independent experiments are depicted with median and range. Mann-Whitney test, one-tailed, *p < 0.05. (D) After 30 h of culture, expression of markers of ER stress p-eIF2α and CHOP was analyzed by western blotting and then the membranes were reprobed to β-actin. (E,F) After 18 h of culture, the cells were stained with CellEvent Caspase-3/7 reagent (green) or Hoechst 33342 (nucleic dye, blue). (E) Fluorescence microscopy images of MIN6 cells reveal cells undergoing apoptosis as shown by the presence of caspase-3/7- positive cells. Scale bar 30 μm. (F) The quantitative analysis showed a significant increase in the percentage of caspase-positive cells for treated in comparison to untreated control cells. Each data point represents results obtained for one image. Data are compiled from n = 18 images (> 8,000 nuclei) per situation from two independent experiments. Kruskal–Wallis test (**p < 0.01, ***p < 0.001 and ****p < 0.0001).
Figure 2
Figure 2
Apoptotic beta cells release a heterogeneous population of EV. (A) After exposure to stress, MIN6 cells were cultured for 30 h prior to EV separation by differential centrifugation, ultrafiltration (UF) and size-exclusion chromatography (SEC). (B) Representative Western blot images of markers of extracellular vesicles (membrane CD81, CD63, CD9, Flotillin-1, cytosolic β-actin) or cells (Calnexin). (C) Confocal images of EV from untreated MIN6 cells stained with MB-Cy3 (AB) or MB-Cy5 (MV) (D) Cryo-electron microscopy images of MV and sEV. (E–G) The particle size distribution of EV subpopulations was determined by TRPS analysis. Histograms show the particle size distribution of samples from one representative experiment. Scatter dot plots represent the number of particles recovered per million of cells (data from n = 10–21 independent experiments; median with range). Yields of EV obtained from MIN6 cells after treatment were compared to the yield from untreated controls using the Kruskal-Wallis test (**P < 0.01 ****P < 0.0001). (F,G) Relative quantities of material released inside EV based on TRPS and Bradford protein content analyses of extracellular vesicles harvested per million of MIN6 cells after 30 h of culture. Relative volumes occupied by vesicle subtypes are estimated based on mean sizes and concentrations measured by TRPS. (F) Percentage of numbers of particles (Nb part.) and total protein of EV subtypes derived from untreated control cells. Results are depicted as median percentages from n = 7–9 replicates from independent experiments. (G) Volumes (median) measured for EV from treated and control MIN6 cells. Results from n = 10–17 independent experiments are shown.
Figure 3
Figure 3
Differential partition of the autoantigen insulin inside EV. (A–D) After 30 h of culture, EV were collected from supernatants from CTL, CK, UV, or HX MIN6 cells and assessed for total insulin (pro-insulin and mature insulin) content by ELISA. (B,C) On EV derived from untreated control cells (CTL) (B) Quantities of insulin measured inside AB, MV and sEV collected per million of CTL cells. (C) Insulin concentrations measured in association with AB, MV, and sEV from CTL MIN6 cells. (D) Evolution of sorting of insulin toward EV following exposure to stress. Data from n = 7–11 independent experiments are shown with median and range and compared using the Kruskal-Wallis test (*P < 0.05 ***P < 0.001).
Figure 4
Figure 4
Beta cell stress favors export of TLR-binding miRNA in EV. (A) Following exposure to stress, MIN6 cells were cultured for 30 h followed by isolation of large EV (comprising AB and MV) and sEV. All samples were spiked with an exogenous control prior to total RNA extraction and processed for quantitative RT-PCR. After amplification, relative quantities were normalized with respect to the spike and untreated controls. (B) Quantitative RT-PCR analysis of miRNA expression in a fixed number of cells and EV derived thereof. Individual replicates from 4 to 6 independent EV isolations are represented as fold-changes compared to mean expression values measured in untreated controls. Tukey's range test *P < 0.05, **P < 0.01 and ***P < 0.001.
Figure 5
Figure 5
Cytokine profile of beta EV. Multiplex CBA monitoring of cytokine expression in association with EV collected from 30 h culture supernatants from cytokine-treated MIN6 cells and untreated controls. Data (with median) from 3 to 4 independent experiments are shown.
Figure 6
Figure 6
Modulation of co-stimulatory molecules in NOD bmDC by beta AB. NODShi mice derived bmDC were incubated for 18 h with AB, MV or sEV derived from 8 × 10⁷ MIN6 cells. (A) Flow cytometric analysis of the expression of the CD40, MHC II, and CD86 activation markers. Histograms with dashed lines represent bmDC treated with AB derived from cytokine beta cells. Histograms with solid lines represent bmDC treated with AB from untreated beta cells. Gray histograms represent isotypic controls. Data from one representative out of 2–5 independent experiments are shown. (B) Scatter plots show the median fluorescence intensity (MFI) of co-stimulatory molecules expression in bmDC after AB treatment normalized to No EV controls (median with range). Tukey's range test *P < 0.05 and **P < 0.01.
Figure 7
Figure 7
Modulation of cytokine secretion profiles in innate immune cells by beta EV. (A–C) NODShi mice derived bmDC were incubated for 18 h with AB, MV, or sEV derived from 8 × 10⁷ MIN6 cells (A,B) CBA of cytokine concentration in bmDC culture supernatants. (A) Dot plots of fluorescence intensity of beads from one representative experiment are shown. (B) CBA of MCP-1 in culture supernatants from bmDC treated with AB or No EV controls. Data from 6 to 7 independent experiments are shown (median with range). (C) TNFα supernatant levels as confirmed by ELISA. Data from 6 to 8 independent experiments are shown. (D) RAW264.7 macrophages were treated for 18 h with AB, MV or sEV derived from 8 × 10⁷ MIN6 cells. TNFα cytokine levels in culture supernatants were measured by ELISA. Data from 3 to 6 independent experiments are shown. Kruskal Wallis test *P < 0.05, **P < 0.01, ***P < 0.001, and ****P < 0.0001.

References

    1. Atkinson MA, Eisenbarth GS, Michels AW. Type 1 diabetes. Lancet. (2014) 383:69–82. 10.1016/S0140-6736(13)60591-7 - DOI - PMC - PubMed
    1. Livingstone SJ, Levin D, Looker HC, Lindsay RS, Wild SH, Joss N, et al. . Estimated life expectancy in a Scottish cohort with type 1 diabetes, 2008-2010. JAMA. (2015) 313:37–44. 10.1001/jama.2014.16425 - DOI - PMC - PubMed
    1. Patterson CC, Harjutsalo V, Rosenbauer J, Neu A, Cinek O, Skrivarhaug T, et al. . Trends and cyclical variation in the incidence of childhood type 1 diabetes in 26 European centres in the 25 year period 1989-2013: a multicentre prospective registration study. Diabetologia. (2019) 62:408–17. 10.1007/s00125-018-4763-3 - DOI - PubMed
    1. Fonseca SG, Gromada J, Urano F. Endoplasmic reticulum stress and pancreatic beta-cell death. Trends Endocrinol Metab. (2011) 22:266–74. 10.1016/j.tem.2011.02.008 - DOI - PMC - PubMed
    1. Szegezdi E, Logue SE, Gorman AM, Samali A. Mediators of endoplasmic reticulum stress-induced apoptosis. Embo Rep. (2006) 7:880–5. 10.1038/sj.embor.7400779 - DOI - PMC - PubMed

Publication types

MeSH terms