Comparative Study
. 2020 Sep 24:11:572634.
doi: 10.3389/fimmu.2020.572634. eCollection 2020.

Comparison of Bead-Based Fluorescence Versus Planar Electrochemiluminescence Multiplex Immunoassays for Measuring Cytokines in Human Plasma

Affiliations
Comparative Study

Comparison of Bead-Based Fluorescence Versus Planar Electrochemiluminescence Multiplex Immunoassays for Measuring Cytokines in Human Plasma

Anna Günther et al. Front Immunol. .

Abstract

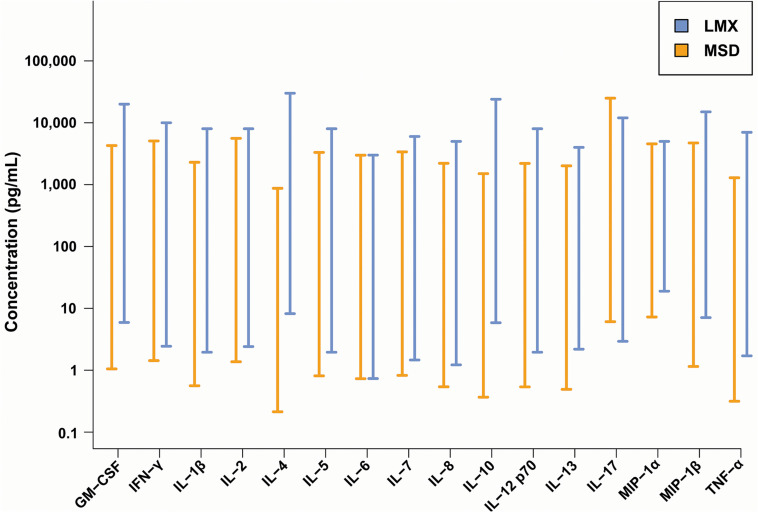
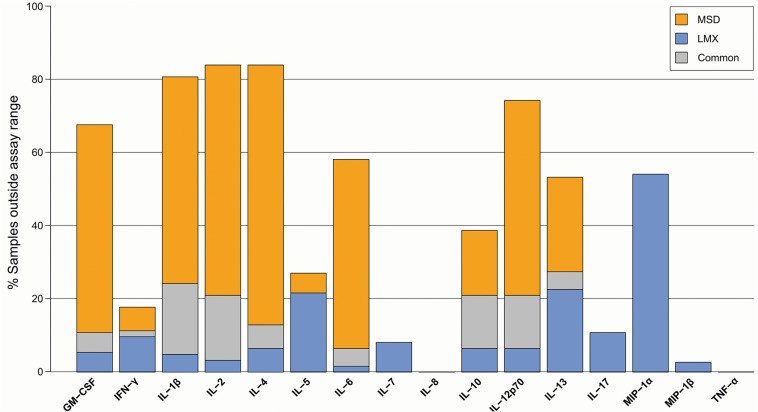
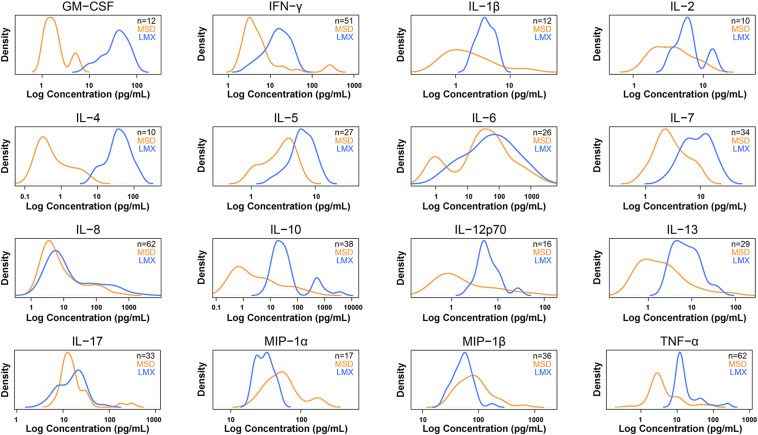
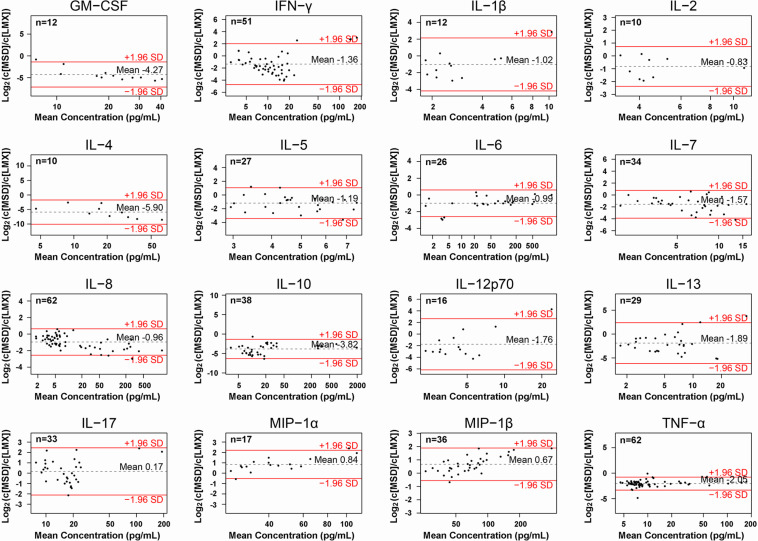
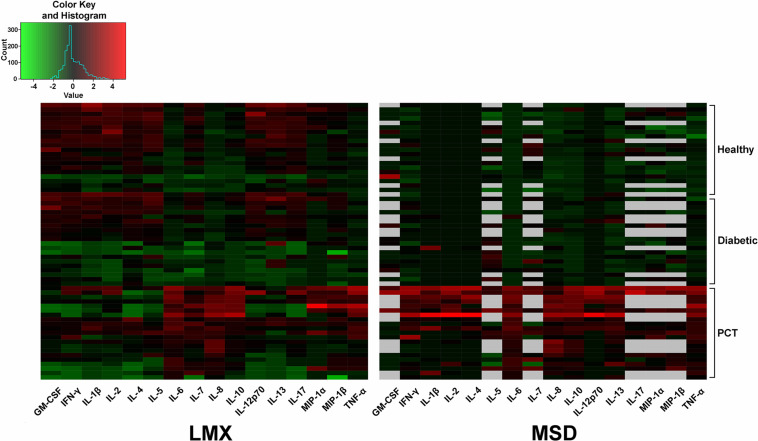
This study compared two 96-well multiplex immunoassay platforms for analytical performance in assessing cytokine concentrations in standards, quality controls and human plasma samples (n = 62), and evaluated assay time requirements. Assays included a bead-based fluorescence MILLIPLEX® assay/Luminex fluorescence platform (LMX) and three kits from Meso Scale Discovery (MSD) in planar electrochemiluminescence format. The LMX kit evaluated 21 cytokines and the MSD kits evaluated 10 cytokines each, with 16 overlapping cytokines between platforms. Both assays provided good reproducibility in standard curves for all analytes. Interassay CVs of shared analytes showed average kit quality control CVs ranging 1.9-18.2% for LMX and 2.4-13.9% for MSD. The MSD platform had lower LLoQs than LMX for 14/16 shared cytokines. For IL-17, the LLoQ was lower with LMX than MSD, and the LLoQs for IL-6 were similar. Although MSD calibration curves indicated lower LLoQs for most of those analytes, many more cytokines in human plasma samples were not detected by MSD than by LMX. The ULoQs were higher in LMX versus MSD assays for 13/16 shared analytes, lower than MSD for IL-17, and equivalent between assays for IL-6 and MIP-1α. Bland-Altman plots indicated that MSD classified 13/16 shared analytes as concentrations lower than by LMX. Time and motion analysis indicated that total mean assay times were 20 h 28 m and 21 h 33 m for LMX and MSD, respectively, including an overnight (17 h) incubation. The MSD assays employed a manufacturer-approved overnight incubation instead of the standard 2-h incubation, which kit instructions suggest might increase detection sensitivity. Hands-on labor time averaged 1 h 37 m for LMX and 2 h 33 m for MSD. In summary, assay selection factors should include selection of specific markers of interest, time and cost considerations, and anticipated cytokine concentrations in prospective samples.

Keywords: Luminex; Meso Scale Discovery; Millipore; chemokine; cytokine; dynamic range; lower limit of quantification; multiplex immunoassay.


Figures

FIGURE 1
FIGURE 1
Dynamic ranges of the Luminex bead-based fluorescence (LMX) and Meso Scale Discovery electrochemiluminescence (MSD) multiplex cytokine immunoassay kits. With some exceptions (e.g., IL-6 and IL-17), the low-end of a shared analytes dynamic range was lower with the MSD compared to the LMX assay. Conversely, and with some exceptions (e.g., IL-6, IL-17, and MIP-1α), the high-end of the dynamic range was greater with the LMX assay versus the MSD assay. In two instances (IL-4 and IL-10), the differences in upper and lower quantification levels differed by at least an order of magnitude between the two assays.
FIGURE 2
FIGURE 2
Proportion of donor plasma samples outside the assay quantification range for the Luminex (LMX) and Meso Scale Discovery (MSD) multiplex cytokine immunoassay kits. Although the MSD assay had a LLoQ below that of the LMX assay for 14/16 common analytes in earlier standard curve performance evaluations, this did not directly translate to evaluation of cytokines in experimental human plasma samples, whereby several analytes were missed at a greater frequency with the MSD platform (e.g., IL-10, IL-12, IL-1β, IL-2, IL-4, IL-6, and GM-CSF) and others were missed at a greater frequency with the LMX platform but detected with the MSD assay (e.g., IFN-γ, IL-5, IL-7, IL-17, MIP-1α, and MIP-1β).
FIGURE 3
FIGURE 3
Density plots for 16 cytokines measured in human plasma samples by both methods that were within each assay’s dynamic range. Density plots show the distribution of the measured sample concentrations using a kernel density estimation. Luminex (LMX) is shown in blue and Meso Scale Discovery (MSD) in orange. Concentrations (x-axis) are on log scale. Density (y-axis) is scaled so that the total area under the two curves is the same. These plots give an overview of how sample measurement compares between the two methods.
FIGURE 4
FIGURE 4
Agreement analysis of concentrations of the 16 cytokines measured in human plasma samples by the Luminex (LMX) and Meso Scale Discovery (MSD) multiplex assays, to assess agreement between the two platforms. Log2 values of the MSD/LMX concentration ratios are shown on the y-axis, and provide a visual assessment of estimates of systematic differences in measurement between methods when the mean value deviates from 0. In this presentation, a negative shift in the mean indicates that the MSD assay classifies the analyte as concentrations lower than LMX, and vice versa. Mean analyte concentrations (in pg/mL) are shown on the logarithmic x-axis, and precise values appear above the dotted horizontal “mean” lines in each graph. The ±1.96 SD lines represent the 95% limits of agreement, and when SDs are large or n-values are low, then interpretation can be ambiguous. In general, for most shared analytes, the mean is shifted to a negative value, indicating that MSD quantified an analyte at a lower concentration than LMX did using the same samples. Exceptions appear to be MIP-1α and MIP-1β, where LMX on average characterizes samples at lower concentrations. An example of where LMX and MSD are comparable is IL-17, where the mean ratio is close to 0. Proportional bias is suggested in the case of MIP-1β, wherein the mean concentration ratio approximates 0 at lower measured concentrations, but increases toward +2 at higher analyte concentrations.
FIGURE 5
FIGURE 5
Heatmap depiction of relative analyte concentrations measured by the Luminex (LMX) and Meso Scale Discovery (MSD) multiplex assays. Cytokine measurements were performed in plasma samples from healthy individuals and from people with diabetes or elevated procalcitonin (PCT) levels. Data were centered and scaled per analyte per method. A histogram showing the color key used to designate sample concentrations is provided to the top left of the main image. Each cell represents a single analyte in a single plasma sample. Black cells indicate cytokine levels in that sample that were measured to be the approximate mean of all evaluated samples. Red cells indicate higher (above average) measured cytokine values for that sample/assay combination and green cells indicate lower (below average) analyte concentrations, with color intensity indicating magnitude of difference. Gray cells mean that sample data for that specific analyte were not available. Analyzed samples that provided signals below the lower limit of quantification (LLoQ) for any analyte had those values artificially entered as their specific LLoQ value before calculation and mapping.

Similar articles

Cited by

References

    1. Kany S, Vollrath JT, Relja B. Cytokines in inflammatory disease. Int J Mol Sci. (2019) 20:6008. 10.3390/ijms20236008 - DOI - PMC - PubMed
    1. Hughes CE, Nibbs RJB. A guide to chemokines and their receptors. FEBS J. (2018) 285:2944–71. 10.1111/febs.14466 - DOI - PMC - PubMed
    1. McKay HS, Margolick JB, Martínez-Maza O, Lopez J, Phair J, Rappocciolo G, et al. Multiplex assay reliability and long-term intra-individual variation of serologic inflammatory biomarkers. Cytokine. (2017) 90:185–92. 10.1016/j.cyto.2016.09.018 - DOI - PMC - PubMed
    1. Tighe PJ, Ryder RR, Todd I, Fairclough LC. ELISA in the multiplex era: potentials and pitfalls. Proteomics Clin Appl. (2015) 9:406–22. 10.1002/prca.201400130 - DOI - PMC - PubMed
    1. Lippitz BE. Cytokine patterns in patients with cancer: a systematic review. Lancet Oncol. (2013) 14:e218–228. 10.1016/S1470-2045(12)70582-X - DOI - PubMed

Publication types