. 2020 Sep 4:11:563798.
doi: 10.3389/fgene.2020.563798. eCollection 2020.

Integrated Analyses of Mouse Stem Cell Transcriptomes Provide Clues for Stem Cell Maintenance and Transdifferentiation

Affiliations

Integrated Analyses of Mouse Stem Cell Transcriptomes Provide Clues for Stem Cell Maintenance and Transdifferentiation

Li-Juan Wang et al. Front Genet. .

Abstract

In vivo cell fate reprogramming has emerged as a new method for understanding cell plasticity and as potential treatment for tissue regeneration. Highly efficient and precise reprogramming requires fully understanding of the transcriptomes which function within different cell types. Here, we adopt weighted gene co-expression network analysis (WGCNA) to explore the molecular mechanisms of self-renewal in several well-known stem cell types, including embryonic stem cells (ESC), primordial germ cells (PGC), spermatogonia stem cells (SSC), neural stem cells (NSC), mesenchymal stem cells (MSC), and hematopoietic stem cells (HSC). We identified 37 core genes that were up-regulated in all of the stem cell types examined, as well as stem cell correlated gene co-expression networks. The validation of the co-expression genes revealed a continued protein-protein interaction network that included 823 nodes and 3113 edges. Based on the topology, we identified six densely connected regions within the continued protein-protein interaction network. The SSC specific genes Itgam, Cxcr6, and Agtr2 bridged four densely connected regions that consisted primarily of HSC-, NSC-, and MSC-correlated genes. The expression levels of identified stem cell related transcription factors were confirmed consistent with bioinformatics prediction in ESCs and NSCs by qPCR. Exploring the mechanisms underlying adult stem cell self-renewal will aid in the understanding of stem cell pool maintenance and will promote more accurate and efficient strategies for tissue regeneration and repair.

Keywords: co-expression; network; stem cell; transcriptomes; transdifferentiation.


Figures

FIGURE 1
FIGURE 1
Transcription profiles for ESCs, PGCs, SSCs, NSCs, MSCs, and HSCs. (A) The intersection of highly expressed genes from the six types of stem cells. Dots represents the intersections of the six types of stem cells in the Venn analysis. The bar represents the size of the individual intersections. Dots with lines show highly expressed genes shared by the lined stem cells types. Different intersections of those six types of stem cells are highlighted with different colors. The 37 commonly highly expressed genes among the six types of stem cells are highlighted with red bar. (B) PCA revealed differences among the six types of stem cells. (C) GO analysis of the biological function of the core 37 core commonly highly expressed genes. The benjamini-adjusted p value of <0.05 was selected as threshold for enrichment of GO_BP_FAT terms.
FIGURE 2
FIGURE 2
WGCNA identified stem cell type-specific highly expressed genes. (A) Selection of soft thresholding powers for WGCNA. The red line corresponds to 0.9. As the lowest power that satisfies the approximate scale-free topology criterion, the number 20 was interpreted as a soft-threshold of the correlation matrix. (B) Heat map of the gene dendrogram that was assigned to the six different subtypes of stem cells. The colored row indicates the expression values of genes in the dendrogram. (C) The identified module eigengenes were classified into three groups by hierarchical clustering. (D) Heat map of the six different subtypes of stem cell-specific modules. Modules with a correlation of >0.80 (p < 0.01) were designated as stem cell-specific modules. Each row and column corresponded to the identified module and stem cell type. The correlations and p-values of the corresponding modules were labeled.
FIGURE 3
FIGURE 3
Functional annotation of the six stem cell types correlated modules. GO analysis of genes in six stem cell types correlated modules were annotated by DAVID 7.8. ESC enriched GO terms included multicellular organism development, endoderm development, and the establishment of various organs and cells (A). GO analysis of PGCs correlated modules genes were involved in multicellular organism development and embryonic limb morphogenesis (B). SSC correlated module genes were involved in cell differentiation, spermatogenesis-related processes, and multicellular organism development (C). NSC correlated module genes were involved in neural system development (D). MSC correlated module genes were involved in T cell development, T cell mediated immunity, immune responses, and bone mineralization (E). HSC correlated module genes were involved in the immune response (F).
FIGURE 4
FIGURE 4
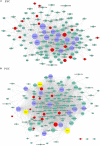
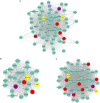
The related co-expression networks of ESC and PGC. The co-expression networks of the ESC-correlated purple module (A), PGC-correlated brown module (B). The hub nodes are highlighted in blue within the co-expression networks. Transcription factors within the respective network are highlighted in red. Transcription factors that were included in the top 10% of nodes are highlighted in yellow within the respective networks. The size of the nodes corresponds to their degrees.
FIGURE 5
FIGURE 5
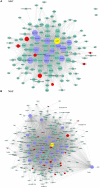
The related co-expression networks of SSC and NSC. SSC-correlated yellow module (A), NSC-correlated turquoise module (B). The hub nodes are highlighted in blue within the co-expression networks. Transcription factors within the respective network are highlighted in red. Transcription factors that were included in the top 10% of nodes are highlighted in yellow within the respective networks. The size of the nodes corresponds to their degrees.
FIGURE 6
FIGURE 6
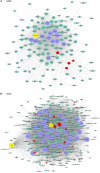
The related co-expression networks of SSC and NSC. MSC-correlated pink module (A) and HSC-correlated blue module (B). The hub nodes are highlighted in blue within the co-expression networks. Transcription factors within the respective network are highlighted in red. Transcription factors that were included in the top 10% of nodes are highlighted in yellow within the respective networks. The size of the nodes corresponds to their degrees.
FIGURE 7
FIGURE 7
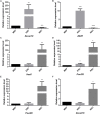
The quantitative analysis of identified stem cell related genes based on qPCR (A–F). The expression levels of identified stem cell related genes were detected in ESC and NSC. All data were normalized to the β-actin and are displayed as fold changes compared to MEF. Error bars are the standard deviation (SD) of at least three repeats. The significance of differences in multiple comparisons were determined by student’s t-test. “*” means p < 0.05, “**” means p < 0.01, “***” means p < 0.001, and “****” means p < 0.0001.
FIGURE 8
FIGURE 8
The predicted co-expressed network of Yamanaka factors. The co-expression networks of Yamanaka factors Sox2 (A), Nanog (B), and Pou5f1 (C). Yamanaka factors Sox2, Nanog and Pou5f1 are labeled in purple. Several well-known stemness transcription factors are marked in yellow and non-transcription factors were labeled as blue. The predicted transcription factors within the respective network of respective Yamanaka factors are highlighted in red. For clarity, the top 20% of the nodes of Nanog and Pou5f1 co-expressed genes were displayed according to node degree.
FIGURE 9
FIGURE 9
Identification of six densely connected regions within the constructed stem cell correlated protein-protein interaction network based on the STRING database. Six densely connected regions were identified within the continued protein-protein interaction network by topology analysis (A–F). The nodes are marked with the colors purple (ESC), brown (PGC), yellow (SSC), turquoise (NSC), pink (MSC), and blue (HSC) corresponding to the respective stem cell correlated modules.
FIGURE 10
FIGURE 10
CTCF binding sites in respective stem cell hub genes. The occupancy rates of the CTCF binding motif among the 20 hub genes within the respective stem cell specific modules. Dark gray shading indicates the percentages of CTCF binding motif among the 20 hub genes in the six stem cell types. Light gray corresponded to non- CTCF binding motifs.

Similar articles

Cited by

References

    1. Adams G. B., Scadden D. T. (2006). The hematopoietic stem cell in its place. Nat. Immunol. 7 333–337. 10.1038/ni1331 - DOI - PubMed
    1. Azim K., Hurtado-Chong A., Fischer B., Kumar N., Zweifel S., Taylor V., et al. (2015). Transcriptional hallmarks of heterogeneous neural stem cell niches of the subventricular zone. Stem Cells 33 2232–2242. 10.1002/stem.2017 - DOI - PubMed
    1. Bader G. D., Hogue C. W. V. (2003). An automated method for finding molecular complexes in large protein interaction networks. BMC Bioinform. 4:2. 10.1186/1471-2105-4-2 - DOI - PMC - PubMed
    1. Barcia Duran J. G., Lis R., Lu T. M., Rafii S. (2018). In vitro conversion of adult murine endothelial cells to hematopoietic stem cells. Nat. Protoc. 13 2758–2780. 10.1038/s41596-018-0060-3 - DOI - PMC - PubMed
    1. Bhatnagar S., Gazin C., Chamberlain L., Ou J., Zhu X., Tushir J. S., et al. (2014). TRIM37 is a new histone H2A ubiquitin ligase and breast cancer oncoprotein. Nature 516 116–120. 10.1038/nature13955 - DOI - PMC - PubMed