. 2020 Sep 25:11:567812.
doi: 10.3389/fgene.2020.567812. eCollection 2020.

Integrated Transcriptome and Histone Modification Analysis Reveals NDV Infection Under Heat Stress Affects Bursa Development and Proliferation in Susceptible Chicken Line

Affiliations

Integrated Transcriptome and Histone Modification Analysis Reveals NDV Infection Under Heat Stress Affects Bursa Development and Proliferation in Susceptible Chicken Line

Ganrea Chanthavixay et al. Front Genet. .

Abstract

Two environmental factors, Newcastle disease and heat stress, are concurrently negatively impacting poultry worldwide and warrant greater attention into developing genetic resistance within chickens. Using two genetically distinct and highly inbred layer lines, Fayoumi and Leghorn, we explored how different genetic backgrounds affect the bursal response to a treatment of simultaneous Newcastle disease virus (NDV) infection at 6 days postinfection (dpi) while under chronic heat stress. The bursa is a primary lymphoid organ within birds and is crucial for the development of B cells. We performed RNA-seq and ChIP-seq targeting histone modifications on bursa tissue. Differential gene expression revealed that Leghorn, compared to Fayoumi, had significant down-regulation in genes involved in cell proliferation, cell cycle, and cell division. Interestingly, we also found greater differences in histone modification levels in response to treatment in Leghorns than Fayoumis, and biological processes enriched in associated target genes of H3K27ac and H3K4me1 were similarly associated with cell cycle and receptor signaling of lymphocytes. Lastly, we found candidate variants between the two genetic lines within exons of differentially expressed genes and regulatory elements with differential histone modification enrichment between the lines, which provides a strong foundation for understanding the effects of genetic variation on NDV resistance under heat stress. This study provides further understanding of the cellular mechanisms affected by NDV infection under heat stress in chicken bursa and identified potential genes and regulatory regions that may be targets for developing genetic resistance within chickens.

Keywords: ChIP-seq; Newcastle disease virus; RNA-seq; bursa; heat stress.


Figures

FIGURE 1
FIGURE 1
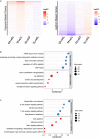
Functional analysis of DEGs for within-line comparisons. (A) Top 5 GO terms for biological processes. (B) Top 5 KEGG pathways on the right were found for Leghorn only and heat map of the log2 fold changes of the DEGs within the top 3 KEGG pathways related to cell proliferation on the left. The number of genes denotes the number of DEGs associated with the term or pathway. Significant GO terms and KEGG pathway were identified by p < 0.05 with more than two gene counts. CF, control Fayoumi; TF, treated Fayoumi; CL, control Leghorn; TL, treated.
FIGURE 2
FIGURE 2
Functional analysis of DEGs specific for treated-line comparison. (A) Log2FC for Fayoumi-biased and Leghorn-biased DEGs specifically within treated-line comparison compared to control-line comparison. (B) The top 5 GO terms for Fayoumi-biased and Leghorn-biased DEGs specific to the treated-line comparison. (C) The top 5 KEGG pathways for Fayoumi-biased and Leghorn-biased DEGs specific to treated-line comparison.
FIGURE 3
FIGURE 3
Differentially expressed genes (DEGs) with inherent line biases that increase during treatment show Fayoumi’s ability to retain cell-identity development versus Leghorn. The z scores were calculated for DEGs that were specific to the treated-line comparison and used in k-means clustering. Five clusters were chosen for the k-means clustering, but two clusters with similar gene regulation patterns were combined into cluster 1, resulting in four clusters shown in the heat map above. The chart summarizes the gene pattern regulation of each cluster that describes whether the DEGs had up-regulation or down-regulation between non-treated and treated birds within each line and whether they were Fayoumi-biased or Leghorn-biased for each between-line comparison. The top 2 GO terms and KEGG pathways are shown for each cluster with the number of DEGs enriched in each pathway and –log10 p-value. Significant GO terms and KEGG pathway were identified by p < 0.05 with more than two gene counts.
FIGURE 4
FIGURE 4
The promoter states of differentially expressed genes generally are not different between groups, suggesting enhancers may play a role in modulating expression for these DEGs. (A) Annotation of chromatin states are based on promoter enrichment, gene expression correlation, and known associations of histone modifications to regulatory elements and their activity. States are grouped into three main activity groups: active (red), poised (yellow), and repressed (blue). (B) Promoter transition tables are shown for the DEGs in each comparison. (C) Table summarizing the states that remain the same between two groups or are different between groups is shown in (A) and includes the total number of promoters that were the same and were different between two groups. *Numbers shown for TF versus TL comparison refer to DEGs specific to that gene set in comparison to the CF vs. CL gene set. CF, control Fayoumi; TF, treated Fayoumi; CL, control Leghorn; TL, treated Leghorn.
FIGURE 5
FIGURE 5
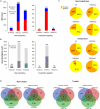
Summary of DER analysis for within-line comparisons. (A) Stacked bar plots showing the number of DERs with increased or decreased enrichment identified for each within-line comparison across all histone modifications. (B) Stacked bar plots showing the number of unique target genes associated with DERs and the number of associated genes that are in common with DEGs of the corresponding differential gene analysis (i.e., within-line Leghorn or Fayoumi). (C) Pie charts showing the percentage of promoters or enhancers within the DERs of each histone modification. (D) Venn diagrams showing overlap of DERs across histone modifications. No overlap of H3K4me3 DERs was found for either comparison.
FIGURE 6
FIGURE 6
Summary of DER analysis for between-line comparisons. (A) Stacked bar plots showing the number of DERs with increased or decreased enrichment identified for each between-line comparison across all histone modifications. (B) Stacked bar plots showing the number of unique target genes associated with DERs and the number of associated genes that are in common with DEGs of the corresponding differential gene analysis (i.e., between non-treated lines or treated lines). (C) Pie charts showing the percentage of promoters or enhancers within the DERs of each histone modification. (D) Venn diagrams showing the overlapped DERs with similar line biases across histone modifications within each between-line comparison. DER, differentially enriched region; DEG, differentially expressed gene.
FIGURE 7
FIGURE 7
Genome browser track of the promoter of DPYSL3 with H3K27ac read pile-up and RNA-seq read pile-up of two biological replicates from control Fayoumi and control Leghorn. Red tick marks on top of the browser represent variants between the genetic lines.

References

    1. Albiston H. E., Gorrie C. J. (1942). Newcastle disease in Victoria. Aust. Vet. J. 18 75–79. 10.1111/j.1751-0813.1942.tb01466.x - DOI
    1. Alexander D. J. (2000). Newcastle disease and other avian paramyoviruses. Rev. Sci. Tech. 19 443–462. - PubMed
    1. Anders S., Pyl P. T., Huber W. (2014). HTSeq—a python framework to work with high-throughput sequencing data. Bioinformatics 31 166–169. 10.1093/bioinformatics/btu638 - DOI - PMC - PubMed
    1. Andersson L., Archibald A. L., Bottema C. D., Brauning R., Burgess S. C., Burt D. W., et al. (2015). Coordinated international action to accelerate genome-to-phenome with FAANG, the functional annotation of animal genomes project. Genome Biol. 16:57. - PMC - PubMed
    1. Barrett N. W., Rowland K., Schmidt C. J., Lamont S. J., Rothschild M. F., Ashwell C. M., et al. (2019). Effects of acute and chronic heat stress on the performance, egg quality, body temperature, and blood gas parameters of laying hens. Poult. Sci. 98 6684–6692. 10.3382/ps/pez541 - DOI - PMC - PubMed