

Phenomenological Modelling of COVID-19 Epidemics in Sri Lanka, Italy, the United States, and Hebei Province of China
- PMID: 33101454
- PMCID: PMC7573661
- DOI: 10.1155/2020/6397063
Phenomenological Modelling of COVID-19 Epidemics in Sri Lanka, Italy, the United States, and Hebei Province of China
Abstract
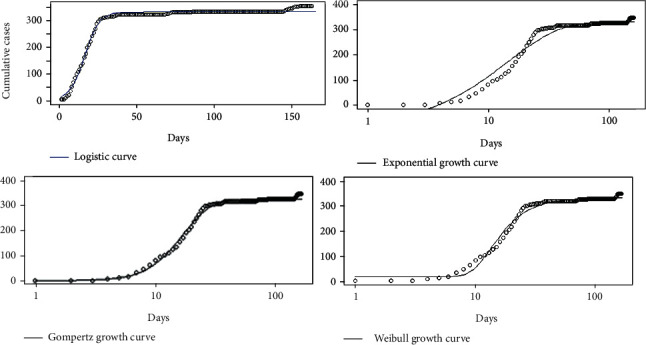
The COVID-19 pandemic has resulted in increasing number of infections and deaths every day. Lack of specialized treatments for the disease demands preventive measures based on statistical/mathematical models. The analysis of epidemiological curve fitting, on number of daily infections across affected countries, provides useful insights on the characteristics of the epidemic. A variety of phenomenological models are available to capture the dynamics of disease spread and growth. The number of daily new infections and cumulative number of infections in COVID-19 over four selected countries, namely, Sri Lanka, Italy, the United States, and Hebei province of China, from the first day of appearance of cases to 2nd July 2020 were used in the study. Gompertz, logistic, Weibull, and exponential growth curves were fitted on the cumulative number of infections across countries. AIC, BIC, RMSE, and R 2 were used to determine the best fitting curve for each country. Results revealed that the most appropriate growth curves for Sri Lanka, Italy, the United States, and China (Hebei) are the logistic, Gompertz, Weibull, and Gompertz curves, respectively. Country-wise, overall growth rate, final epidemic size, and short-term forecasts were evaluated using the selected model. Daily log incidences in each country were regressed before and after the identified peak time of the respective outbreak of epidemic. Hence, doubling time/halving time together with daily growth rates and predictions was estimated. Findings and relevant interpretations demonstrate that the outbreak seems to be extinct in Hebei, China, whereas further transmissions are possible in the United States. In Italy and Sri Lanka, current outbreaks transmit in a decreasing rate.
Copyright © 2020 A. M. C. H. Attanayake et al.
Conflict of interest statement
The authors declare that they have no conflicts of interest.
Figures


References
-
- World Health Organization novel coronavirus (2019-nCoV) situation reports, 2020 Situation report 164. https://www.who.int/emergencies/diseases/novel-coronavirus-2019/situatio....
-
- Kaplan S., Gürcan E. K. Comparison of growth curves using non-linear regression function in Japanese quail. Journal of Applied Animal Research. 2018;46(1):112–117. doi: 10.1080/09712119.2016.1268965. - DOI
MeSH terms
LinkOut - more resources
Full Text Sources
