. 2020 Dec;20(6):331.
doi: 10.3892/ol.2020.12191. Epub 2020 Oct 6.

Potent antitumor activity of cepharanthine against triple-negative breast cancer spheroids compared with tetrandrine

Affiliations

Potent antitumor activity of cepharanthine against triple-negative breast cancer spheroids compared with tetrandrine

Anna Kiyomi et al. Oncol Lett. 2020 Dec.

Abstract

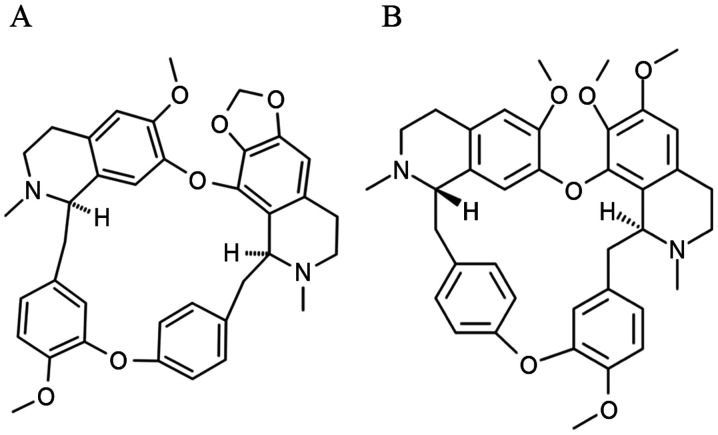
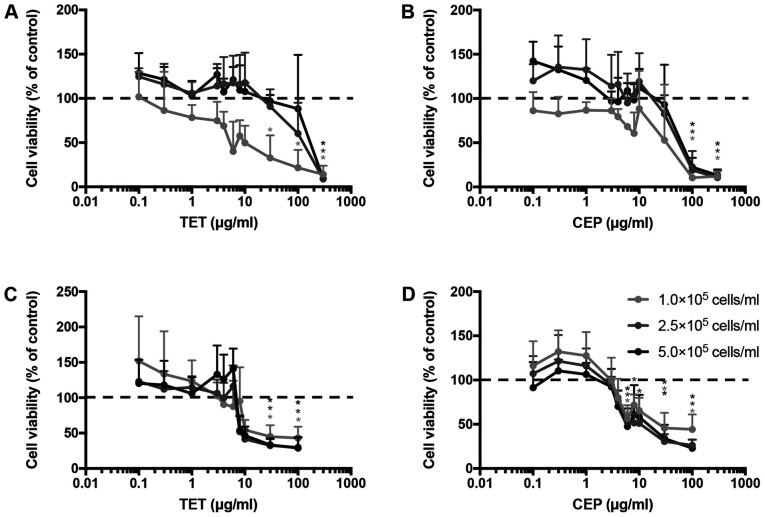
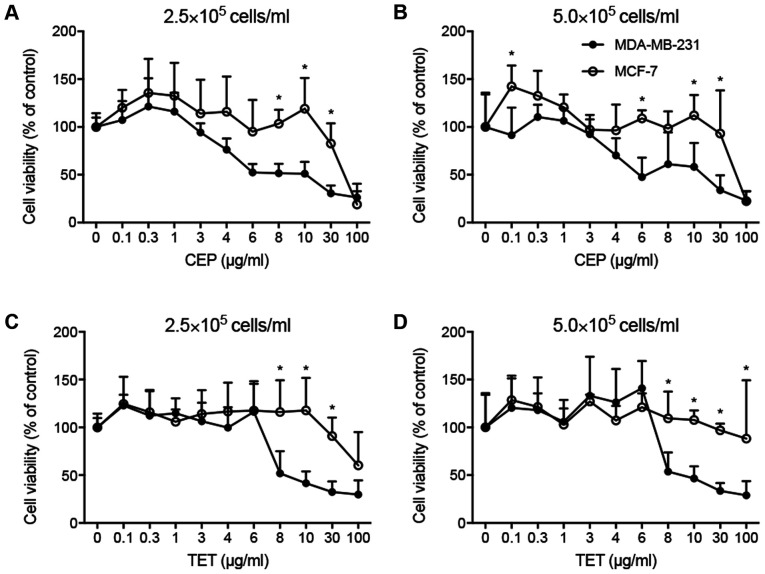
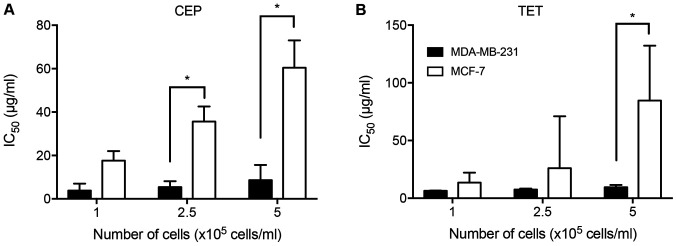
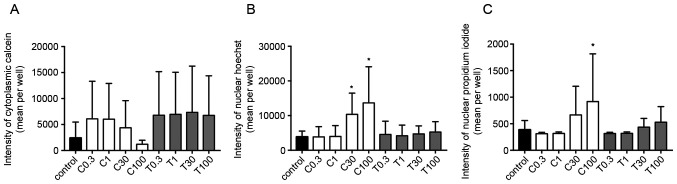
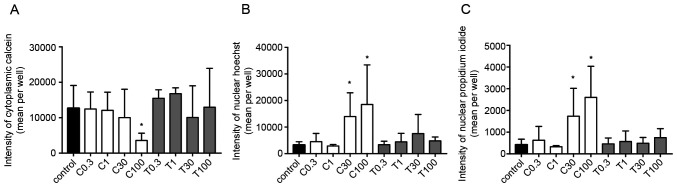
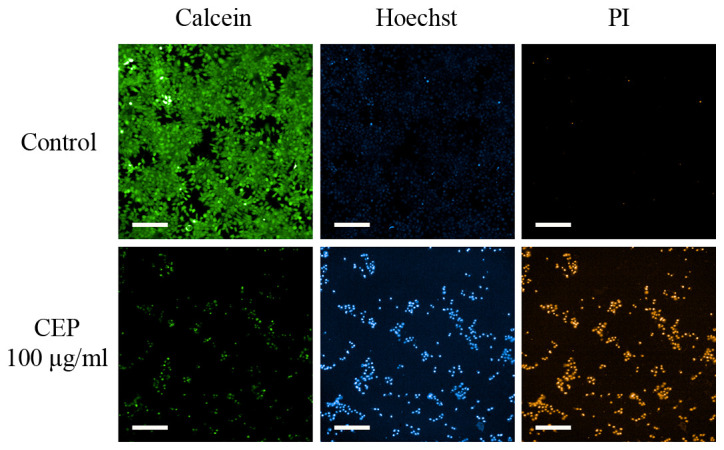
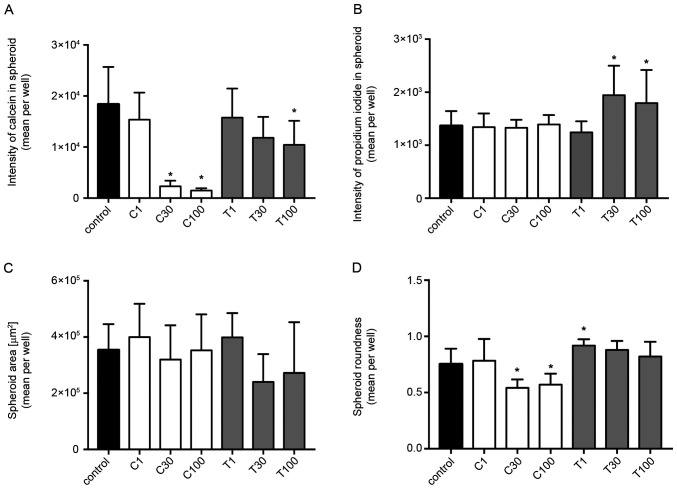
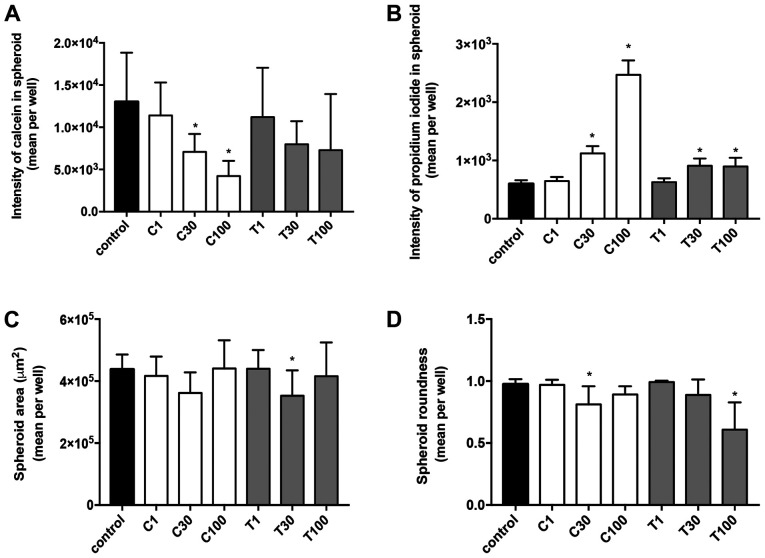
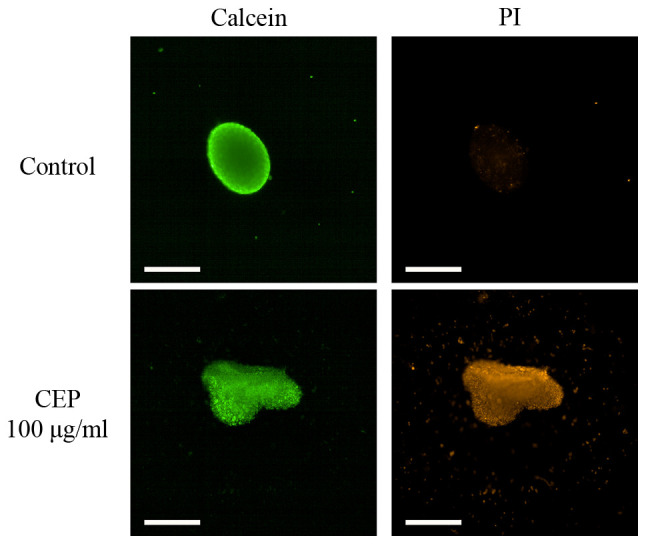
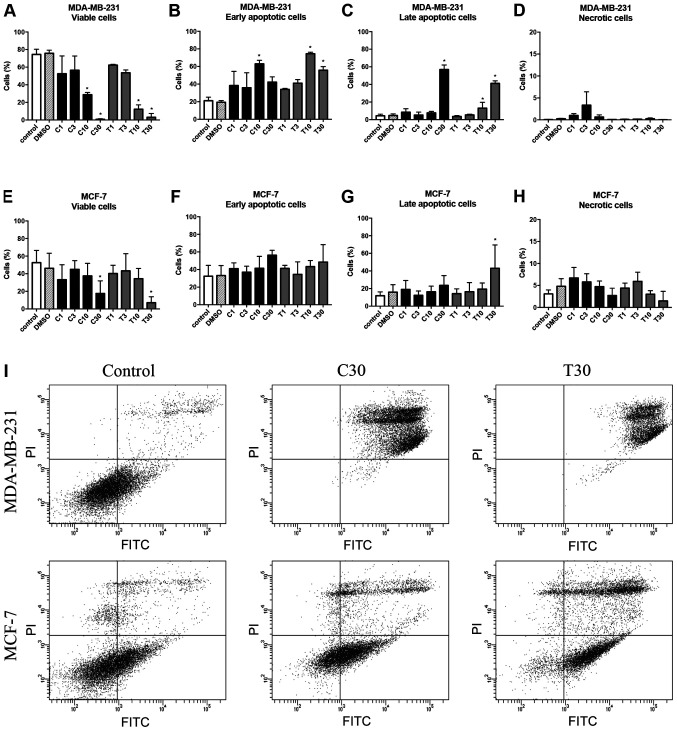
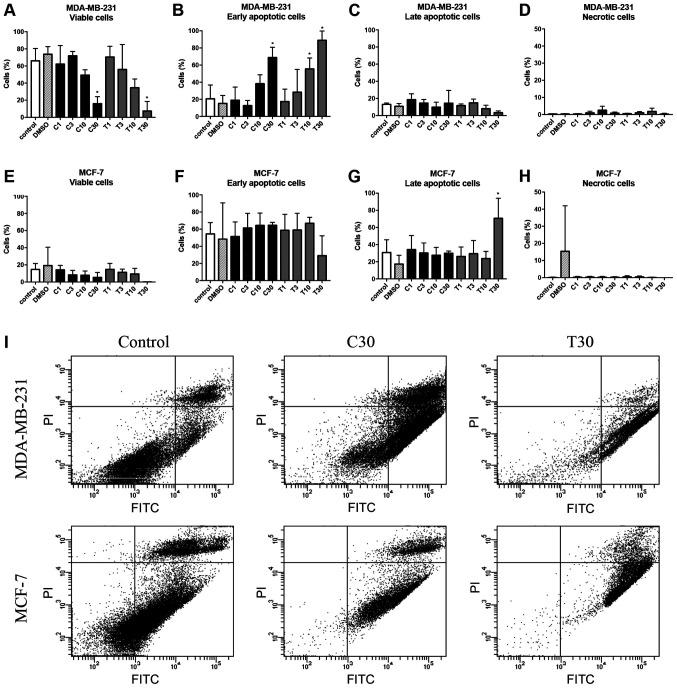
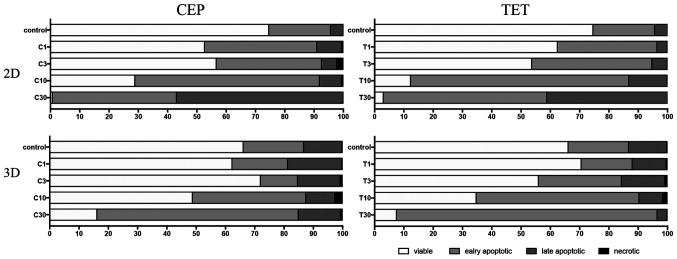
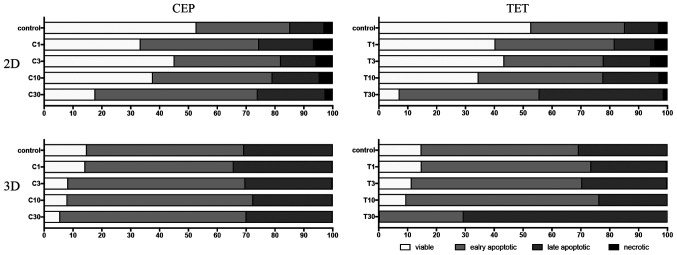
Cepharanthine (CEP) is a bis-bynzelisoquinoline alkaloid from the same class as the anticancer agent tetrandrine (TET). However, the effects of CEP against breast cancer have not been extensively studied, despite its long therapeutic history with low toxicity against other types of cancer. 3D culture systems more accurately mimic the human body and address the limitations of determining drug effectiveness compared with 2D culture systems. In the present study, the antitumor activities of TET and CEP were compared in 3D culture systems in triple-negative breast cancer (TNBC) MDA-MB-231 and estrogen receptor-positive breast cancer MCF-7 cell lines. Cell viability, apoptosis and cytotoxicity assays were performed to determine the total number of live or dead cells, the IC50 values, the number of apoptotic cells and spheroid roundness. Viability suppression of MDA-MB-231 cells was significantly greater with both TET and CEP compared with that of MCF-7 cells, and the roundness of MDA-MB-231 spheroids treated with CEP was decreased significantly compared with that of spheroid treated with TET. Cytoplasmic shrinkage in each cell line significantly increased with the treatment of TET compared with the control; however, this effect was stronger with CEP. The ratio of dead/live cells in each cell line treated with TET and CEP increased in a dose-dependent manner. Overall, the present study demonstrated that CEP had greater cell toxicity in 3D spheroids of breast cancer cells compared with TET, suggesting that CEP may have a stronger antitumor activity on TNBC spheroids compared with TET.

Keywords: 3D culture; CEP; TET; antitumor; breast cancer; spheroid.


Figures

Figure 1.
Figure 1.
Chemical structures of (A) cepharanthine and (B) tetrandrine.
Figure 2.
Figure 2.
Cell viability of 2D MDA-MB-231 or MCF-7 monolayer cells treated with TET or CEP cultured at different cell numbers. Cytotoxic effects of (A) TET and (B) CEP on 2D monolayer breast cancer MCF-7 cells cultured at different cell numbers. Cytotoxic effects of (C) TET and (D) CEP on 2D monolayer breast cancer MDA-MB-231 cells at different cell numbers. Cell viability was determined using the Cell Counting Kit-8 assay after treatment with various concentrations (0–100 µg/ml) of TET and CEP. Relative cell viability was calculated as the ratio of the absorbance at 450 nm of each treatment group against those of the corresponding untreated control group. Data are shown as the mean ± SD of >3 independent experiments and were analyzed via one-way ANOVA followed by Tukey's multiple comparisons test. *P<0.05 vs. control (untreated) group, represented as 100% of the y-axis (dotted line). CEP, cepharanthine; TET, tetrandrine.
Figure 3.
Figure 3.
Comparison of the cell viability between 2D-cultured MDA-MB-231 and MCF-7 cells treated with TET and CEP. Cell viability in 2D monolayer MDA-MB-231 and MCF-7 cells treated with CEP at (A) 2.5×10⁵ cells/ml and (B) 5.0×10⁵ cells/ml, or TET at (C) 2.5×10⁵ cells/ml and (D) 5.0×10⁵ cells/ml detected via Cell Counting Kit-8 assay. Data are shown as the mean ± SD of >3 independent experiments and were analyzed using the Mann-Whitney U test. *P<0.05 vs. MDA-MB-231 cells. CEP, cepharanthine; TET, tetrandrine.
Figure 4.
Figure 4.
Comparison of IC50 values of CEP or TET between 2D monolayer MDA-MB-231 and MCF-7 cells cultured at different cell numbers. Cells were cultured at cell numbers of 1.0, 2.5 or 5.0×10⁵ cells/ml in the presence of (A) CEP or (B) TET, and the IC50 values were evaluated. The IC50 values of CEP and TET on MDA-MB-231 cells were lower than those of MCF-7 cells. Data are shown as the mean ± SD of >3 independent experiments. *P<0.05 analyzed via one-way ANOVA followed by Sidak's multiple comparisons test. CEP, cepharanthine; TET, tetrandrine.
Figure 5.
Figure 5.
Fluorescence intensities of calcein, Hoechst and propidium iodide in 2D MDA-MB-231 monolayer cell cultures treated with different concentrations of CEP or TET. Fluorescence intensities of (A) calcein (cytoplasm), (B) Hoechst (chromatin) and (C) propidium iodide (dead cells) were detected after 15 min of incubation using an Operetta CLS (PerkinElmer, Inc.). Data are shown as the mean ± SD of 4 independent experiments. *P<0.05 vs. control analyzed via one-way ANOVA and Dunnett's multiple comparisons test. C/CEP, cepharanthine; T/TET, tetrandrine.
Figure 6.
Figure 6.
Fluorescence intensities of calcein, Hoechst and propidium iodide in 2D MCF-7 monolayer cells treated with different concentrations of CEP or TET. Fluorescence intensities of (A) calcein (cytoplasm), (B) Hoechst (chromatin) and (C) propidium iodide (dead cells) were detected after 15 min of incubation using an Operetta CLS (PerkinElmer, Inc.). Data are shown as the mean ± SD of 4 independent experiments. *P<0.05 vs. control analyzed via one-way ANOVA and Dunnett's multiple comparisons test. C/CEP, cepharanthine; T/TET, tetrandrine.
Figure 7.
Figure 7.
Photomicrographs of CEP-treated 2D MCF-7 monolayer cells stained with calcein, Hoechst or PI. MCF-7 cells were treated with 100 µg/ml CEP and stained with calcein green, Hoechst blue or PI red, which represent the cytoplasm, chromatin (nuclei) or dead cells, respectively. CEP induced chromatin aggregation and cell death. Scale bar, 200 µm. CEP, cepharanthine; PI, propidium iodide.
Figure 8.
Figure 8.
Fluorescence intensities and morphological examinations of spheroids of 3D MDA-MB-231 cells treated with different concentrations of CEP or TET. Fluorescence intensity of (A) calcein and (B) propidium iodide in spheroids. (C) Spheroid area and (D) spheroid roundness of 3D MDA-MB-231 cells treated with CEP or TET. The intensity of calcein (cytoplasm) and propidium iodide (dead cells) fluorescence were detected after 15 min of incubation using an Operetta CLS (PerkinElmer, Inc.). The spheroid area and the roundness were calculated using the same instrument. The data are shown as the mean + SD of 4 independent experiments. A roundness value of 1 corresponds to complete roundness, and lower values indicate the deformation of the spheroid. *P<0.05 vs. control analyzed via one-way ANOVA and Dunnett's multiple comparisons test. C/CEP, cepharanthine; T/TET, tetrandrine.
Figure 9.
Figure 9.
Fluorescence intensities and morphological examinations of spheroids of 3D MCF-7 cells treated with different concentrations of CEP or TET. Fluorescence intensity of (A) calcein and (B) propidium iodide in the spheroids. (C) Spheroid area and (D) spheroid roundness of 3D MCF-7 cells treated with CEP or TET. The intensity of calcein (cytoplasm) and propidium iodide (dead cells) fluorescence were detected after 15 min of incubation using an Operetta CLS (PerkinElmer, Inc.). The spheroid area and roundness were calculated using the same instrument. The data are shown as the mean + SD of 4 independent experiments. A roundness value of 1 corresponds to complete roundness, and lower values indicate the deformation of the spheroid. *P<0.05 vs. control analyzed via one-way ANOVA and Dunnett's multiple comparisons test. C/CEP, cepharanthine; T/TET, tetrandrine.
Figure 10.
Figure 10.
Photomicrographs of CEP-treated 3D MCF-7 spheroids stained with calcein or PI. MCF-7 spheroids were treated with 100 µg/ml CEP and stained with calcein green or PI red, representing the cytoplasm or dead cells, respectively. Scale bar, 500 µm. CEP, cepharanthine; PI, propidium iodide.
Figure 11.
Figure 11.
Effects of CEP and TET on percentages of viable, early apoptotic, late apoptotic and necrotic cells of MDA-MB-231 and MCF-7 monolayer cells. After treatment with different concentrations of CEP or TET, 2D monolayer MDA-MB-231 were stained with Annexin V-FITC and PI to identify (A) viable, (B) early apoptotic, (C) late apoptotic and (D) necrotic cells. Similarly, MCF-7 cells were stained with Annexin V-FITC and PI to identify (E) viable, (F) early apoptotic, (G) late apoptotic and (H) necrotic cells. Data are shown as the mean + SD of 4 independent experiments. (I) Cells treated with 30 µg/ml CEP or TET were classified into four groups based on different quadrants: Viable cells (bottom left), early apoptotic cells (bottom right), late apoptotic cells (upper right) and necrotic cells (upper left) using flow cytometry. *P<0.05 vs. control analyzed via one-way ANOVA and Dunnett's multiple comparisons test. C/CEP, cepharanthine; T/TET, tetrandrine; PI, propidium iodide.
Figure 12.
Figure 12.
Effects of CEP and TET on percentages of viable, early apoptotic, late apoptotic and necrotic cells of MDA-MB-231 and MCF-7 spheroids. After the treatment with different concentrations of CEP or TET, 3D MDA-MB-231 spheroids were stained with Annexin V-FITC and PI to identify (A) viable, (B) early apoptotic, (C) late apoptotic and (D) necrotic cells. Similarly, MCF-7 spheroids were stained with Annexin V-FITC and PI to identify (E) viable, (F) early apoptotic, (G) late apoptotic and (H) necrotic cells. The data are shown as the mean + SD of 4 independent experiments. (I) Cells treated with 30 µg/ml CEP or TET were classified into four groups based on different quadrants: Viable cells (bottom left), early apoptotic cells (bottom right), late apoptotic cells (upper right) and necrotic cells (upper left) using flow cytometry. *P<0.05 vs. control analyzed via one-way ANOVA and Dunnett's multiple comparisons test. C/CEP, cepharanthine; T/TET, tetrandrine; PI, propidium iodide.
Figure 13.
Figure 13.
Comparison of the percentages of viable, early apoptotic, late apoptotic and necrotic cells in 2D monolayer or 3D spheroids MDA-MB-231 cells treated with different concentrations of CEP or TET. 2D- or 3D-cultured MDA-MB-231 cells treated with CEP or TET were categorized into viable (white), early apoptotic (light grey), late apoptotic (dark grey) and necrotic (black) cells after staining with Annexin V and PI analyzed via flow cytometry. C/CEP, cepharanthine; T/TET, tetrandrine.
Figure 14.
Figure 14.
Comparison of the percentages of viable, early apoptotic, late apoptotic and necrotic cells in 2D monolayer or 3D spheroids MCF-7 cells treated with different concentrations of CEP or TET. 2D- or 3D-cultured MCF-7 cells treated with CEP or TET were categorized into viable (white), early apoptotic (light grey), late apoptotic (dark grey) and necrotic (black) cells after staining with Annexin V and PI analyzed via flow cytometry. C/CEP, cepharanthine; T/TET, tetrandrine.

Similar articles

Cited by

References

    1. Tao Z, Shi A, Lu C, Song T, Zhang Z, Zhao J. Breast cancer: Epidemiology and etiology. Cell Biochem Biophys. 2015;72:333–338. doi: 10.1007/s12013-014-0459-6. - DOI - PubMed
    1. Coughlin S. Epidemiology of breast cancer in women. Adv Exp Med Biol. 2019;1152:9–29. doi: 10.1007/978-3-030-20301-6_2. - DOI - PubMed
    1. Winters S, Martin C, Murphy D, Shokar N. Breast cancer epidemiology, prevention, and screening. Prog Mol Biol Transl Sci. 2017;151:1–32. doi: 10.1016/bs.pmbts.2017.07.002. - DOI - PubMed
    1. Harbeck N, Gnant M. Breast cancer. Lancet. 2017;389:1134–1150. doi: 10.1016/S0140-6736(16)31891-8. - DOI - PubMed
    1. Carey L, Winer E, Viale G, Cameron D, Gianni L. Triple-negative breast cancer: Disease entity or title of convenience? Nat Rev Clin Oncol. 2010;7:683–692. doi: 10.1038/nrclinonc.2010.154. - DOI - PubMed

LinkOut - more resources