

Experimental and computational analysis of biased agonism on full-length and a C-terminally truncated adenosine A2A receptor
- PMID: 33101610
- PMCID: PMC7550916
- DOI: 10.1016/j.csbj.2020.09.028
Experimental and computational analysis of biased agonism on full-length and a C-terminally truncated adenosine A2A receptor
Abstract
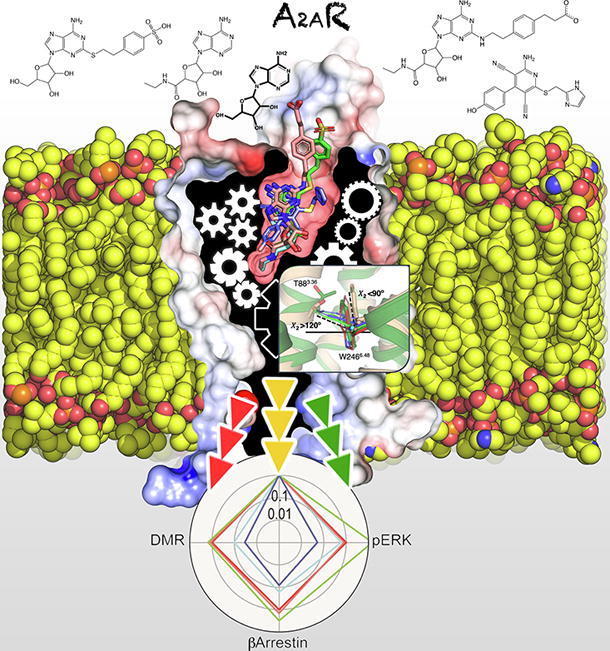
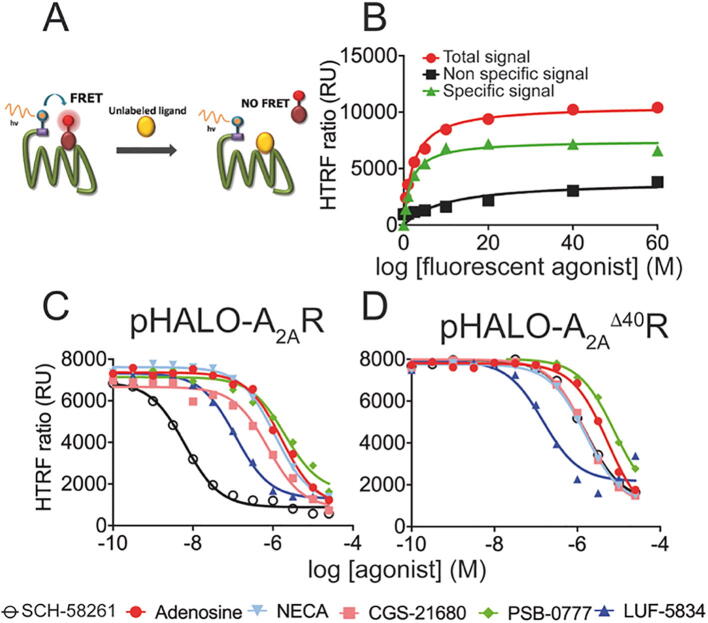
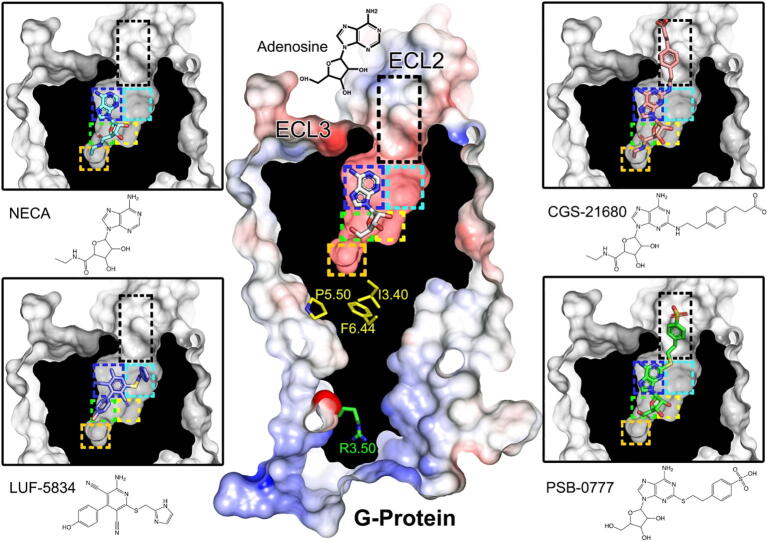
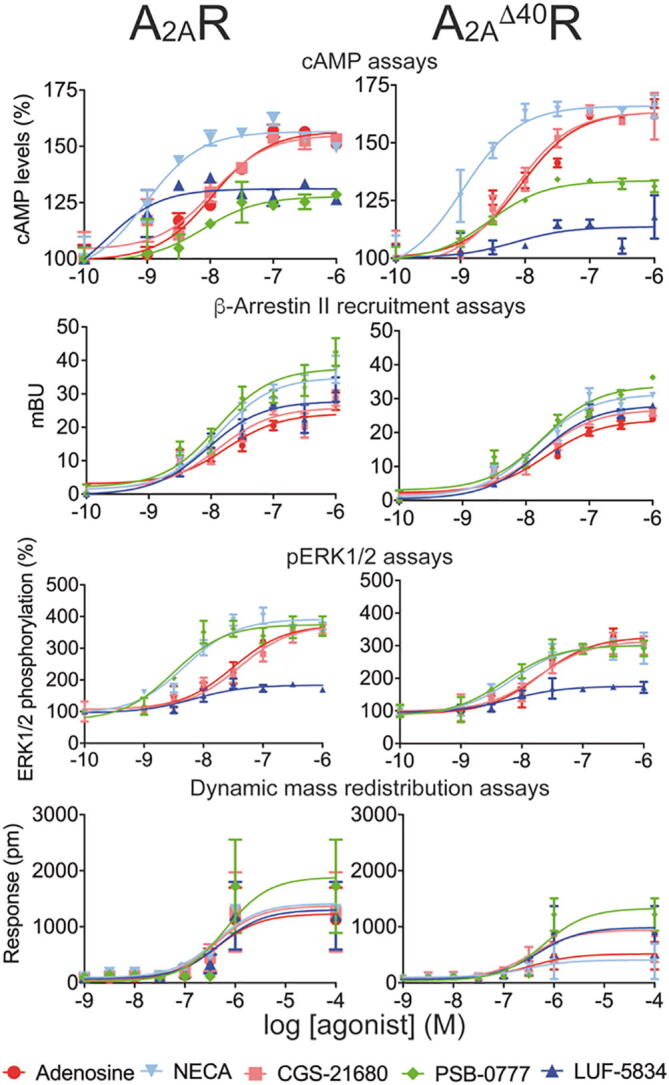
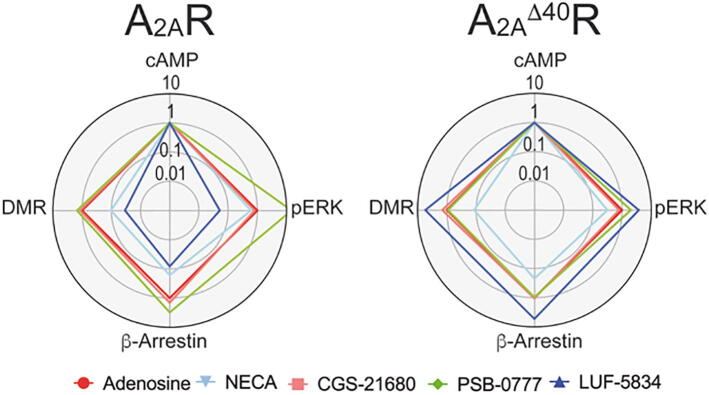
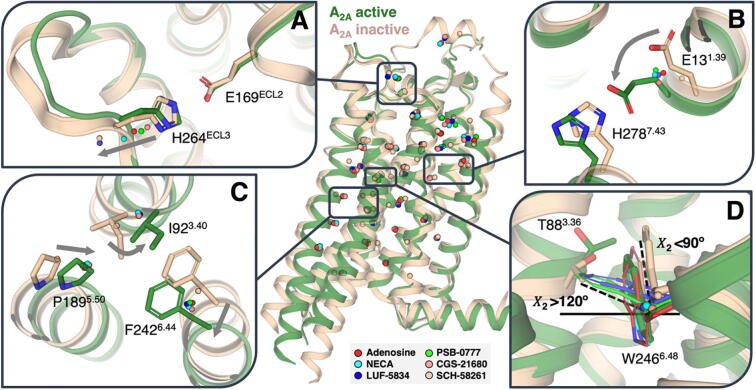
Biased agonism, the ability of agonists to differentially activate downstream signaling pathways by stabilizing specific receptor conformations, is a key issue for G protein-coupled receptor (GPCR) signaling. The C-terminal domain might influence this functional selectivity of GPCRs as it engages G proteins, GPCR kinases, β-arrestins, and several other proteins. Thus, the aim of this paper is to compare the agonist-dependent selectivity for intracellular pathways in a heterologous system expressing the full-length (A2AR) and a C-tail truncated (A2A Δ40R lacking the last 40 amino acids) adenosine A2A receptor, a GPCR that is already targeted in Parkinson's disease using a first-in-class drug. Experimental data such as ligand binding, cAMP production, β-arrestin recruitment, ERK1/2 phosphorylation and dynamic mass redistribution assays, which correspond to different aspects of signal transduction, were measured upon the action of structurally diverse compounds (the agonists adenosine, NECA, CGS-21680, PSB-0777 and LUF-5834 and the SCH-58261 antagonist) in cells expressing A2AR and A2A Δ40R. The results show that taking cAMP levels and the endogenous adenosine agonist as references, the main difference in bias was obtained with PSB-0777 and LUF-5834. The C-terminus is dispensable for both G-protein and β-arrestin recruitment and also for MAPK activation. Unrestrained molecular dynamics simulations, at the μs timescale, were used to understand the structural arrangements of the binding cavity, triggered by these chemically different agonists, facilitating G protein binding with different efficacy.
Keywords: Adenosine A2A receptor; Functional selectivity; G protein binding; G protein coupled receptors; Molecular dynamic simulations; β-Arrestin recruitment.
© 2020 The Authors.
Figures
Similar articles
-
Antipsychotic-Like Efficacy of Dopamine D2 Receptor-Biased Ligands is Dependent on Adenosine A2A Receptor Expression.Mol Neurobiol. 2018 Jun;55(6):4952-4958. doi: 10.1007/s12035-017-0696-y. Epub 2017 Aug 5. Mol Neurobiol. 2018. PMID: 28779351
-
G protein-coupled receptor kinases (GRKs) orchestrate biased agonism at the β2-adrenergic receptor.Sci Signal. 2018 Aug 21;11(544):eaar7084. doi: 10.1126/scisignal.aar7084. Sci Signal. 2018. PMID: 30131371
-
Allosterism in the adenosine A2A and cannabinoid CB2 heteromer.Br J Pharmacol. 2025 Jul;182(14):3371-3384. doi: 10.1111/bph.16502. Epub 2024 Jul 23. Br J Pharmacol. 2025. PMID: 39044481
-
Elucidating structural and molecular mechanisms of β-arrestin-biased agonism at GPCRs via MS-based proteomics.Cell Signal. 2018 Jan;41:56-64. doi: 10.1016/j.cellsig.2017.09.013. Epub 2017 Sep 20. Cell Signal. 2018. PMID: 28939107 Review.
-
Structural mechanism of GPCR-arrestin interaction: recent breakthroughs.Arch Pharm Res. 2016 Mar;39(3):293-301. doi: 10.1007/s12272-016-0712-1. Epub 2016 Jan 29. Arch Pharm Res. 2016. PMID: 26825061 Review.
Cited by
-
Minute-timescale free-energy calculations reveal a pseudo-active state in the adenosine A2A receptor activation mechanism.Chem. 2024 Dec 12;10(12):3678-3698. doi: 10.1016/j.chempr.2024.08.004. Chem. 2024. PMID: 40191447 Free PMC article.
-
Mechanistic Insights into the Mechanism of Inhibitor Selectivity toward the Dark Kinase STK17B against Its High Homology STK17A.Molecules. 2022 Jul 21;27(14):4655. doi: 10.3390/molecules27144655. Molecules. 2022. PMID: 35889528 Free PMC article.
-
International Union of Basic and Clinical Pharmacology. CXII: Adenosine Receptors: A Further Update.Pharmacol Rev. 2022 Apr;74(2):340-372. doi: 10.1124/pharmrev.121.000445. Pharmacol Rev. 2022. PMID: 35302044 Free PMC article. Review.
-
Unique effect of clozapine on adenosine A2A-dopamine D2 receptor heteromerization.Biomed Pharmacother. 2023 Apr;160:114327. doi: 10.1016/j.biopha.2023.114327. Epub 2023 Feb 1. Biomed Pharmacother. 2023. PMID: 36736280 Free PMC article.
-
The Old and New Visions of Biased Agonism Through the Prism of Adenosine Receptor Signaling and Receptor/Receptor and Receptor/Protein Interactions.Front Pharmacol. 2021 Jan 29;11:628601. doi: 10.3389/fphar.2020.628601. eCollection 2020. Front Pharmacol. 2021. PMID: 33584311 Free PMC article.
References
-
- Mickael M.E., Rajput A., Steyn J., Wiemerslage L., Burglin T. An optimised phylogenetic method sheds more light on the main branching events of rhodopsin-like superfamily. Comp Biochem Physiol Part D Genomics Proteomics. 2016;20:85–94. - PubMed
-
- Fredriksson R., Lagerstrom M.C., Lundin L.G., Schioth H.B. The g-protein-coupled receptors in the human genome form five main families. Phylogenetic analysis, paralogon groups, and fingerprints. Mol Pharmacol. 2003;63:1256–1272. - PubMed
LinkOut - more resources
Full Text Sources
Miscellaneous