. 2020 Oct 21:8:23.
doi: 10.1186/s40170-020-00229-2. eCollection 2020.

Metabolic plasticity of IDH1 -mutant glioma cell lines is responsible for low sensitivity to glutaminase inhibition

Affiliations

Metabolic plasticity of IDH1 -mutant glioma cell lines is responsible for low sensitivity to glutaminase inhibition

Victor Ruiz-Rodado et al. Cancer Metab. .

Abstract

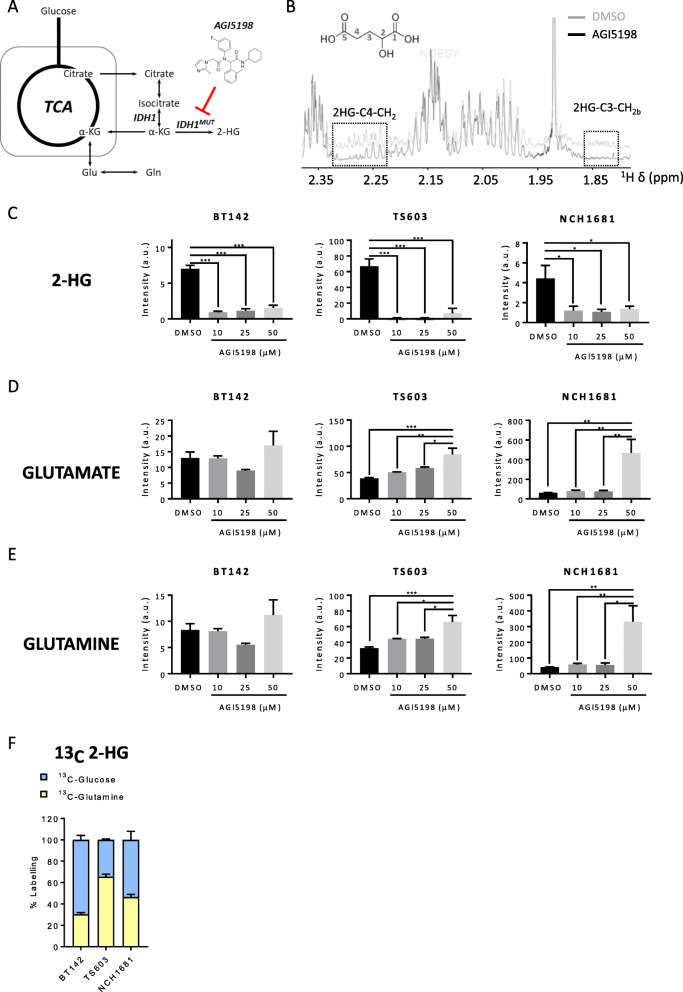
Background: Targeting glutamine metabolism in cancer has become an increasingly vibrant area of research. Mutant IDH1 (IDH1 mut ) gliomas are considered good candidates for targeting this pathway because of the contribution of glutamine to their newly acquired function: synthesis of 2-hydroxyglutarate (2HG).

Methods: We have employed a combination of 13C tracers including glutamine and glucose for investigating the metabolism of patient-derived IDH1 mut glioma cell lines through NMR and LC/MS. Additionally, genetic loss-of-function (in vitro and in vivo) approaches were performed to unravel the adaptability of these cell lines to the inhibition of glutaminase activity.

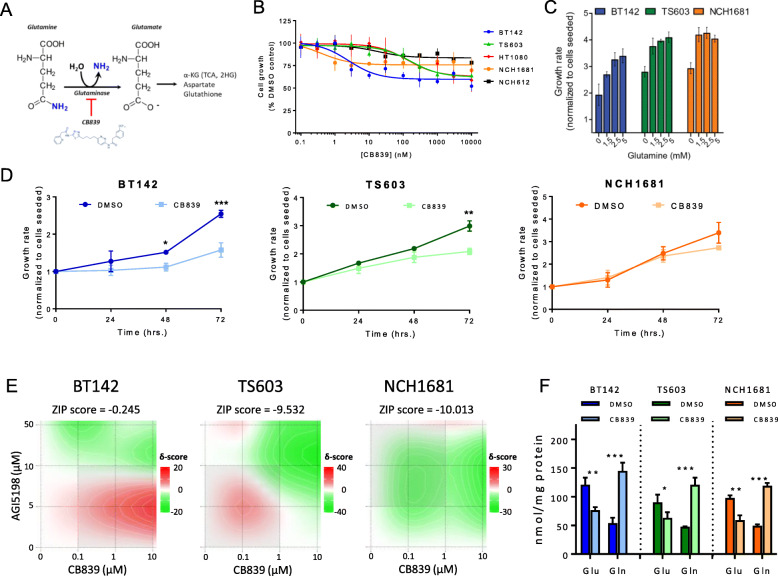
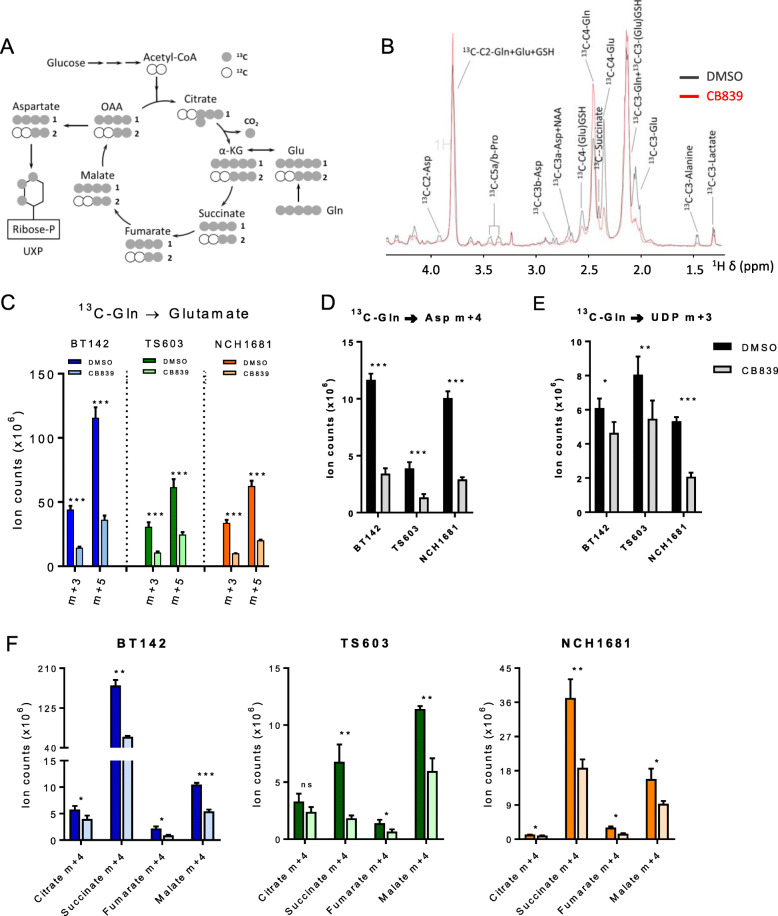
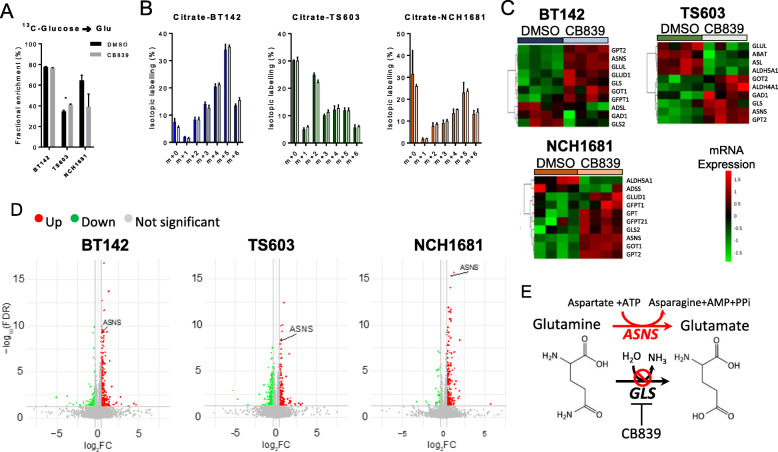
Results: We report the adaptability of IDH1 mut cells' metabolism to the inhibition of glutamine/glutamate pathway. The glutaminase inhibitor CB839 generated a decrease in the production of the downstream metabolites of glutamate, including those involved in the TCA cycle and 2HG. However, this effect on metabolism was not extended to viability; rather, our patient-derived IDH1 mut cell lines display a metabolic plasticity that allows them to overcome glutaminase inhibition.

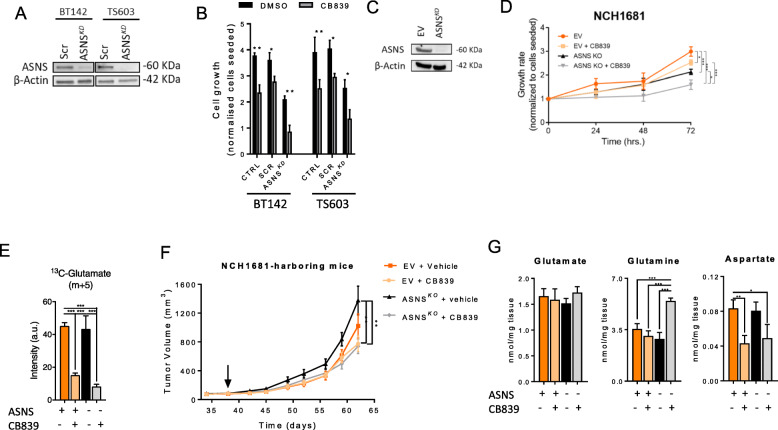
Conclusions: Major metabolic adaptations involved pathways that can generate glutamate by using alternative substrates from glutamine, such as alanine or aspartate. Indeed, asparagine synthetase was upregulated both in vivo and in vitro revealing a new potential therapeutic target for a combinatory approach with CB839 against IDH1 mut gliomas.

Keywords: 13C tracing; AGI5198; CB839; Gliomas; Glutaminase; IDH1-mutant.


Conflict of interest statement

Competing interestsThe authors declare no competing interests.

Figures

Fig. 1
Fig. 1
a Simplified representation of the TCA cycle and its link with IDH1 enzyme and glutamine. b 1H NMR representative spectrum of an IDH1mut glioma cell line after 10 μM AGI5198 treatment for 72 h (black) or DMSO (gray). The 2HG chemical structure is displayed (upper left insert) with carbon atom numbering included. Boxed areas denote regions for the two protons linked to C4 and one to the C3 (Hb) group, since the remaining one (Ha) is overlaid by the larger proline resonance centered at 1.98 ppm. c 2HG, d glutamine, and e glutamate intensities normalized to protein content from polar extracts of IDH1mut cell lines after 10, 25, and 50 μM AGI5198 treatment for 72 h or DMSO obtained by LCMS analysis. Bar plots depicting the normalized intensities from n = 3 samples per experiment. *p < 0.05; **p < 0.005; ***p < 0.001 from a one-way ANOVA followed by Tukey’s HSD test for multiple comparisons. f Contribution of glucose and glutamine to 2HG formation obtained by LCMS analysis from 2 independent experiments involving the aforementioned 13C probes. Bar plots displaying mean ± SD from adjusted percentages (n = 3)
Fig. 2
Fig. 2
a Reaction involving GLS and the inhibition via CB839. b Dose response curve of IDH1mut glioma cell lines and IDH1mut fibrosarcoma (HT1080) against increasing concentrations of CB839. c Growth rate of patient-derived IDH1mut glioma cell lines at different concentrations of Gln in cell culture media. d Growth rate of patient-derived IDH1mut glioma cell lines over time upon addition of 1 μM CB839 (data displayed as mean ± SD, n = 3 for each time point). e Synergy analysis for the 3 patient-derived IDH1mut glioma cell lines under 16 different combinations of CB839 and AGI5198 for 72 h based on growth inhibition (n = 3 for each combination). Data displayed as a heat map for the visualization of delta scores for the dose regions. ZIP synergy scores included at the top of each heat map for each cell line. f Quantification of Glu and Gln via 1H NMR under CB839 treatment vs DMSO controls. (n = 3 for each concentration, drug or time point tested, data displayed as mean ± SD; *p < 0.05; **p < 0.005; ***p < 0.001 from a t test unless otherwise indicated)
Fig. 3
Fig. 3
a 13C tracing map from U-13C-Gln into the TCA cycle and derived metabolites (gray circles = 13C, white circle = 12C). b 1D HSQC representative spectrum of an IDH1mut glioma cell line under DMSO (black) or CB839 (red) treatment displaying those resonances arising from 13C labeling from 72 h incubation in cell media containing 13C-U-Glutamine. c Intensities from isotopologues m+3 and m+5 of Glu under CB839 treatment (72 h) arising from 13C-Gln incorporation. ***p < 0.001. d 13C-Gln contribution to Asp (m+4), UDP (m+3) (e) and representative TCA cycle intermediates (m+4 isotopologues) (f). (n = 3, data displayed as mean ± SD; *p < 0.05; **p < 0.005; ***p < 0.001 from a t test). m+0, unlabeled; m+1, m+2, m+3, m+4, m+5, and m+6 represent the degree of m/z increase due to 13C labeling
Fig. 4
Fig. 4
a 13C incorporation into Glu from 13C-U-glucose (n = 3, data displayed as mean ± SD; *p < 0.05 from a t test). b Distribution of isotopologues of citrate when cells were grown in media containing 13C-U-glucose (m+0, unlabeled; m+1, m+2, m+3, m+4, m+5, and m+6 represent the degree of m/z increase due to 13C labeling). c Heatmaps displaying the top 10 differentially expressed mRNAs included in the glutamate pathway. d Volcano plots depicting the -Log(FDR p value) vs log2 fold-change (FC) for the mRNA transcripts analyzed. Gray dots refer to those mRNA which have not reached statistical significance (FDR p value < 0.05) nor delivered a Log2FC> 1 or <− 1. Those colored in green are downregulated after treatment, and the red ones are upregulated. e Diagram displaying the correlation between ASNS activity and CB839 metabolic effect
Fig. 5
Fig. 5
a Western blot of ASNS after knocking down the gene. b Growth of BT142 and TS603 for parental cells (CTRL), SCR (siRNA control), and ASNSKD under CB839 or DMSO treatment for 72 h. c Western blot of ASNS in NCH1681-ASNSKO cells. d Growth of NCH1681 and the derived ASNSKO upon CB839 treatment throughout 3 days (for purposes of clarity, only the proliferation differences at 72 h were statistically assessed, n = 3 samples per experiment and time point. *p < 0.05; **p < 0.005; ***p < 0.001 from a one-way ANOVA followed by Tukey’s HSD test for multiple comparisons). e 13C tracing of NCH1681-ASNSKO or empty vector cells upon CB839 treatment incubated in media containing 13C-U-glutamine for 72 h (n = 3, data displayed as mean ± SD; *p < 0.05; **p < 0.005; ***p < 0.001 from a one-way ANOVA followed by Tukey’s HSD test for multiple comparisons). f Tumor volume of the mouse models generated after injection in the flank of the cell lines displayed in c. The arrow points at the starting treatment time. (n = 8–12, for each time point and class), data displayed as mean ± SEM (*p < 0.05; **p < 0.005 from a two-way ANOVA by Tukey’s HSD test for multiple comparisons). g Glutamate, glutamine, and aspartate levels for the tumor tissue collected from the mouse models after 27 days of CB839-treatment or vehicle (n = 3, data displayed as mean ± SD; *p < 0.05; **p < 0.005; ***p < 0.001 from a one-way ANOVA followed by Tukey’s HSD test for multiple comparisons)

References

    1. Yan H, Parsons DW, Jin G, McLendon R, Rasheed BA, Yuan W, et al. IDH1 and IDH2 mutations in gliomas. N Engl J Med. 2009;360(8):765–773. doi: 10.1056/NEJMoa0808710. - DOI - PMC - PubMed
    1. Balss J, Meyer J, Mueller W, Korshunov A, Hartmann C, von Deimling A. Analysis of the IDH1 codon 132 mutation in brain tumors. Acta Neuropathol. 2008;116(6):597–602. doi: 10.1007/s00401-008-0455-2. - DOI - PubMed
    1. Mardis ER, Ding L, Dooling DJ, Larson DE, McLellan MD, Chen K, et al. Recurring mutations found by sequencing an acute myeloid leukemia genome. N Engl J Med. 2009;361(11):1058–1066. doi: 10.1056/NEJMoa0903840. - DOI - PMC - PubMed
    1. Jiao Y, Pawlik TM, Anders RA, Selaru FM, Streppel MM, Lucas DJ, et al. Exome sequencing identifies frequent inactivating mutations in BAP1, ARID1A and PBRM1 in intrahepatic cholangiocarcinomas. Nat Genet. 2013;45(12):1470–1473. doi: 10.1038/ng.2813. - DOI - PMC - PubMed
    1. Krauthammer M, Kong Y, Ha BH, Evans P, Bacchiocchi A, McCusker JP, et al. Exome sequencing identifies recurrent somatic RAC1 mutations in melanoma. Nat Genet. 2012;44:1006. doi: 10.1038/ng.2359. - DOI - PMC - PubMed