. 2020 Oct 20:6:73.
doi: 10.1038/s41421-020-00225-2. eCollection 2020.

The differential immune responses to COVID-19 in peripheral and lung revealed by single-cell RNA sequencing

Affiliations

The differential immune responses to COVID-19 in peripheral and lung revealed by single-cell RNA sequencing

Gang Xu et al. Cell Discov. .

Abstract

Understanding the mechanism that leads to immune dysfunction in severe coronavirus disease 2019 (COVID-19) is crucial for the development of effective treatment. Here, using single-cell RNA sequencing, we characterized the peripheral blood mononuclear cells (PBMCs) from uninfected controls and COVID-19 patients and cells in paired broncho-alveolar lavage fluid (BALF). We found a close association of decreased dendritic cells (DCs) and increased monocytes resembling myeloid-derived suppressor cells (MDSCs), which correlated with lymphopenia and inflammation in the blood of severe COVID-19 patients. Those MDSC-like monocytes were immune-paralyzed. In contrast, monocyte-macrophages in BALFs of COVID-19 patients produced massive amounts of cytokines and chemokines, but secreted little interferons. The frequencies of peripheral T cells and NK cells were significantly decreased in severe COVID-19 patients, especially for innate-like T and various CD8+ T cell subsets, compared to healthy controls. In contrast, the proportions of various activated CD4+ T cell subsets among the T cell compartment, including Th1, Th2, and Th17-like cells were increased and more clonally expanded in severe COVID-19 patients. Patients' peripheral T cells showed no sign of exhaustion or augmented cell death, whereas T cells in BALFs produced higher levels of IFNG, TNF, CCL4, CCL5, etc. Paired TCR tracking indicated abundant recruitment of peripheral T cells to the severe patients' lung. Together, this study comprehensively depicts how the immune cell landscape is perturbed in severe COVID-19.

Keywords: Bioinformatics; Immunology.


Conflict of interest statement

Conflict of interestThe authors declare that they have no conflict of interest.

Figures

Fig. 1
Fig. 1. Single-cell analysis of PBMCs from patients with COVID-19.
a The cartoon outlines the study design. PBMC and BALF cells from COVID-19 patients and healthy controls were collected for scRNA-seq characterization using the 10× Genomics platform. The number of samples, analyzed cells, and samples with PBMC and BALF cells simultaneously collected from the same patient are indicated. HC, healthy controls; Mild, mild patients; Severe, severe patients. b The UMAP projection of the combined PBMC scRNA-seq dataset identifies nine major cell types. PC, plasma cells. c The specific markers for identifying each immune cell types in b are indicated. (Pct.Exp. indicates percentage of cells expressed). d Density plots show the UMAP projection of PBMCs from COVID-19 patients and controls. e The bar plot shows the proportions of each cell types in PBMCs from individual subjects. The cell numbers and ratios of monocyte/T cells are listed to the right side. f Comparisons of percentages of each cell types in PBMCs (cycling cells were re-clustered into T and PC subsets) between the two COVID-19 groups and controls (two-sided Student’s t-test, *P < 0.05, **P < 0.01, ***P < 0.001. H, healthy controls; M, mild patients; S, severe patients.
Fig. 2
Fig. 2. Single-cell analysis of peripheral myeloid cell compartments in patients with COVID-19.
a UMAP plot of the five types of myeloid cells in PBMCs. b Density plots show the UMAP projection of peripheral myeloid cells from COVID-19 patients and controls. c Comparisons of percentages of each peripheral myeloid cell types between the two COVID-19 groups and controls (two-sided Student’s t-test, *P < 0.05, **P < 0.01). d Enrichment of GO biological process (BP) terms for upregulated genes (left) and downregulated genes (right) in blood CD14+ monocyte comparisons between mild and HC (M vs H), severe and HC (S vs H), and severe and mild groups (S vs M) (representative terms are shown, adjusted P < 0.01 as indicated by the colored bar). e The heatmaps show the selected differentially expressed genes and their associated GO terms as indicated in d (logFC > 0.41 or < –0.41, adjusted P < 0.01). Mean.Exp, average expression. f Density plots show the composite MHC II signature scores and calprotectin signature scores of peripheral CD14+ monocytes in 2D maps. The horizontal and vertical lines separating the four quadrants represent the median scores of all CD14+ monocytes. The percentages of cells in each quadrant are indicated. g Left panel shows the representative flow cytometric data of HLA-DR expression on CD14+ and CD14 PBMCs. Right plot shows the summarized data from more subjects (two-sided Student’s t-test). h The Pearson correlation of “MDSC-like signature score” and plasma CRP, IL-6 levels, blood neutrophil, CD3+, CD4+, and CD8+ T cell counts.
Fig. 3
Fig. 3. Abnormally activated lung monocyte-macrophages in severe COVID-19.
a The myeloid cell data from two mild and five severe COVID-19 patients who had paired PBMC and BALF samples were integrated and presented on the UMAP. b The expression of monocyte-macrophage markers FCN1, SPP1, and FABP4 were projected to UMAP from a. PM, peripheral cells of mild cases; PS, peripheral cells of severe cases; BM, BALF of mild cases; BS, BALF of severe cases. c Differentiation trajectory of the blood monocytes and BALF monocyte-macrophages from two representative COVID-19 patients, analyzed independently. d Venn diagram shows the number of upregulated and downregulated DEGs in monocyte-macrophage comparisons as indicated. logFC > 0.41 or < –0.41, adjusted P < 0.01. e Enrichment of GO biological process (BP) terms for upregulated genes (left) and downregulated genes (right) in monocyte-macrophage comparisons as indicated. Selected terms are shown, adjusted P value is indicated by the colored bar. f Heatmaps show the expression of selected interferon, cytokine, and chemokine genes in paired blood and BALF monocyte-macrophages derived from the same patient. Stars indicate that the genes are differentially expressed in BALF monocyte-macrophages between mild and severe COVID-19. Purple and green stars show that the gene expression are significantly upregulated in severe COVID-19 and mild COVID-19 groups, respectively (MAST; P < 0.01). B, BALF samples; P, PBMC samples. g The levels of selected cytokines and chemokines in paired BALF and plasma samples were measured by CBA (two-sided Wilcoxon test between BALF and PBMC of severe patients).
Fig. 4
Fig. 4. Single-cell analysis of peripheral NK and T cell compartments in patients with COVID-19.
a UMAP plot of the 18 subsets of NK and T cells in PBMCs. b Pseudo-time differentiation trajectory of the peripheral CD4+ and CD8+ T cell subsets performed by slingshot. The bar plots in the corner shows the percentages of clonally expanded cells in each T cell subsets. c Density plots show the UMAP projection of peripheral NK and T cells from COVID-19 patients and controls. d Comparisons of percentages of each peripheral NK and T cell types between the two COVID-19 groups and controls (two-sided Student’s t-test, *P < 0.05, **P < 0.01, ***P < 0.001). e Clonally expanded T cells from COVID-19 patients and controls are projected into UMAP from a. f Clonal expansion indexes of T cell subsets from COVID-19 patients and controls are separately displayed. g T cell state transition status among any two clusters is inferred by their shared TCR clonotypes. Each T cell cluster is represented by a unique color. The numbers above the bar indicate the percentages of cells sharing TCRs in those two clusters.
Fig. 5
Fig. 5. Tracking T cells across peripheral blood and BALFs in patients with COVID-19.
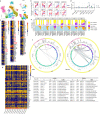
a The T cell data from two mild and five severe COVID-19 patients who had paired PBMC and BALF samples were integrated and presented on the UMAP. b The percentages of each T cell subset in paired BALF (B) and PBMC (P) of the same patient are compared. c Heatmaps display the selected DEGs in NK, CD4-Tm, and CD8-Tm cells in BALF (B) or PBMC (P) from the mild (M) or severe (S) COVID-19 patients. Cytokine-related genes are red marked (logFC > 0.41, adjusted P < 0.01). d The migration index in each T cell subset across paired PBMC and BALF from seven patients are shown (STARTRAC-migr indices). e TCR clonotypes were classified into five different types as indicated by different color bars (singleton indicates non-expanded TCR clonotype, multiplet indicates expanded TCR clonotype, dual-clone indicates those clonotype shared in paired PBMC and BALF samples). The bar plots show the percentages of different types of TCR clonotypes in different T cell subsets from paired PBMC and BALF samples. f The circus plot shows the degree of TCR clonotype sharing across different T cell subsets in PBMC and BALF from the mild and severe COVID-19 groups. g Heatmap shows the selected DEGs in each T cell clones derived from the top 13 TCR clonotypes shared across PBMC vs BALF compartments (logFC > 0.41, adjusted P < 0.01). h The V, J genes of the TCR α and β chains of the top 13 dual clonotypes are listed, and the amino acid sequences of their CDR3 are shown.

Similar articles

Cited by

References

    1. Guan WJ, et al. Clinical characteristics of coronavirus disease 2019 in China. N. Engl. J. Med. 2020;382:1708–1720. doi: 10.1056/NEJMoa2002032. - DOI - PMC - PubMed
    1. Zhou F, et al. Clinical course and risk factors for mortality of adult inpatients with COVID-19 in Wuhan, China: a retrospective cohort study. Lancet. 2020;395:1054–1062. doi: 10.1016/S0140-6736(20)30566-3. - DOI - PMC - PubMed
    1. Chen, R. et al. Longitudinal hematologic and immunologic variations associated with the progression of COVID-19 patients in China. J. Allergy Clin. Immunol. 146, 89–100 (2020). - PMC - PubMed
    1. Xu X, et al. Effective treatment of severe COVID-19 patients with tocilizumab. Proc. Natl. Acad. Sci. USA. 2020;117:10970–10975. doi: 10.1073/pnas.2005615117. - DOI - PMC - PubMed
    1. Tay MZ, Poh CM, Renia L, MacAry PA, Ng LFP. The trinity of COVID-19: immunity, inflammation and intervention. Nat. Rev. Immunol. 2020;20:363–374. doi: 10.1038/s41577-020-0311-8. - DOI - PMC - PubMed