. 2020 Sep 3;7(20):2000157.
doi: 10.1002/advs.202000157. eCollection 2020 Oct.

ATM-Dependent Recruitment of BRD7 is required for Transcriptional Repression and DNA Repair at DNA Breaks Flanking Transcriptional Active Regions

Affiliations

ATM-Dependent Recruitment of BRD7 is required for Transcriptional Repression and DNA Repair at DNA Breaks Flanking Transcriptional Active Regions

Kaishun Hu et al. Adv Sci (Weinh). .

Abstract

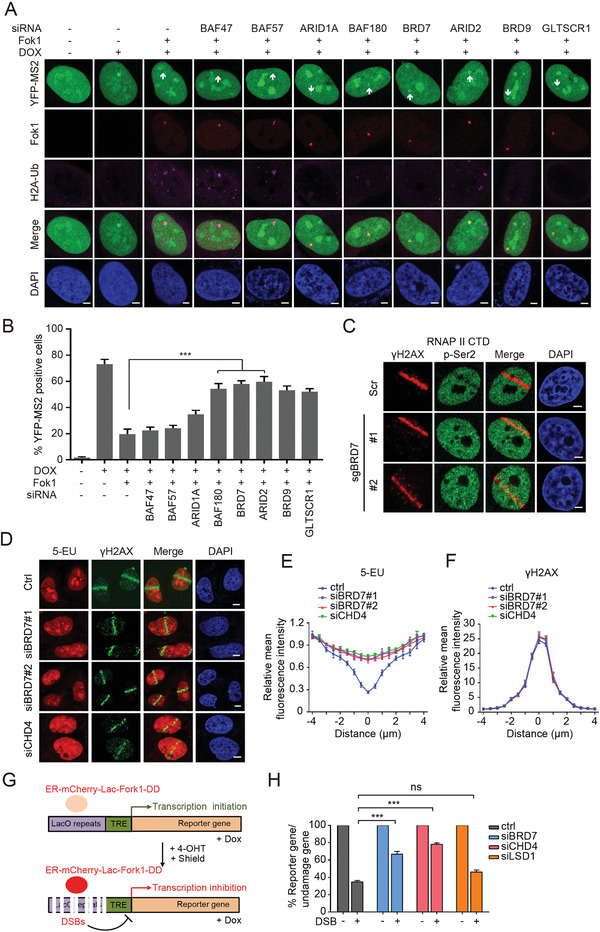
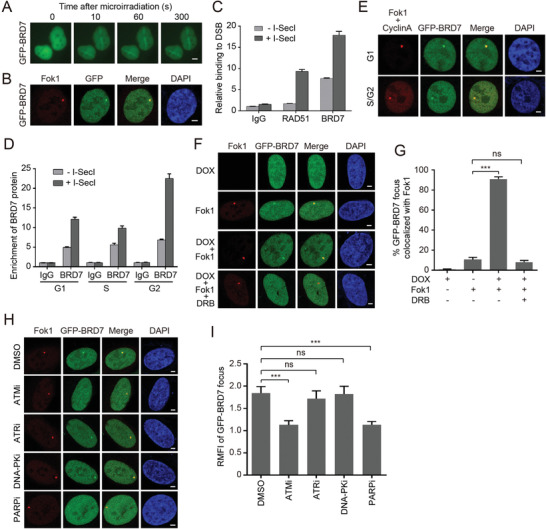
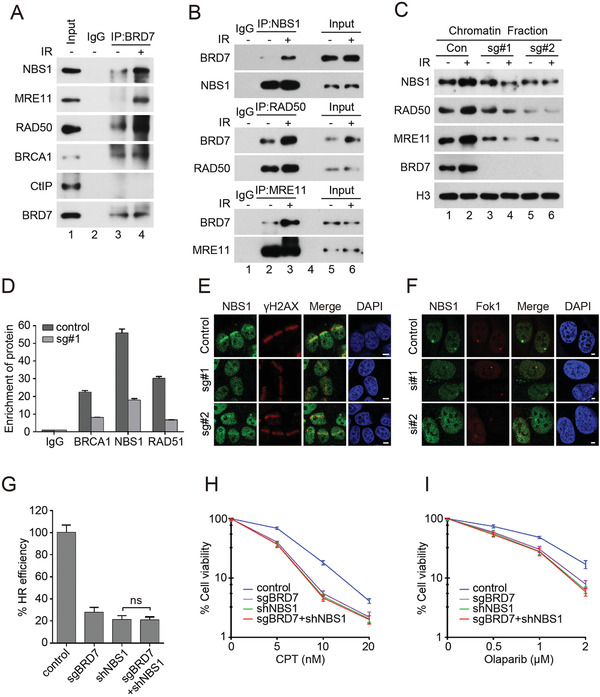
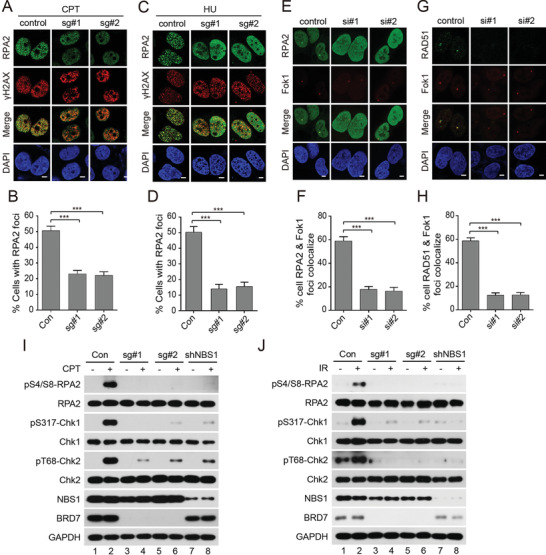
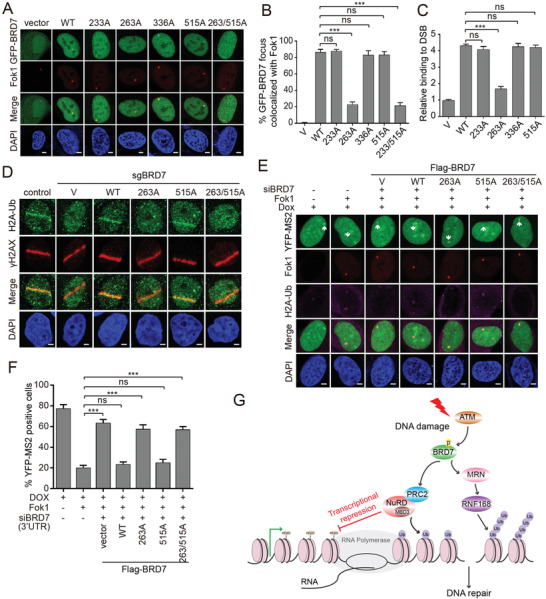
Repair of DNA double-strand breaks (DSBs) is essential for genome integrity, and is accompanied by transcriptional repression at the DSB regions. However, the mechanisms how DNA repair induces transcriptional inhibition remain elusive. Here, it is identified that BRD7 participates in DNA damage response (DDR) and is recruited to the damaged chromatin via ATM signaling. Mechanistically, BRD7 joins the polycomb repressive complex 2 (PRC2), the nucleosome remodeling and histone deacetylation (NuRD) complex at the damaged DNA and recruits E3 ubiquitin ligase RNF168 to the DSBs. Furthermore, ATM-mediated BRD7 phosphorylation is required for recruitment of the PRC2 complex, NuRD complex, DSB sensor complex MRE11-RAD50-NBS1 (MRN), and RNF168 to the active transcription sites at DSBs, resulting in transcriptional repression and DNA repair. Moreover, BRD7 deficiency sensitizes cancer cells to PARP inhibition. Collectively, BRD7 is crucial for DNA repair and DDR-mediated transcription repression, which may serve as a therapeutic target. The findings identify the missing link between DNA repair and transcription regulation that maintains genome integrity.

Keywords: ATM; BRD7; NuRD; PRC2; transcriptional repression.


Conflict of interest statement

The authors declare no conflict of interest.

Figures

Figure 1
Figure 1
PBAF and ncBAF complex is required for transcriptional silencing induced by DNA DSBs. A) Transcriptional activity was measured in U2OS‐263 reporter cells transfected with small interfering RNA (siRNA) targeting either BAF47, BAF57, ARID1A, BAF180, BRD7, ARID2, BRD9, or GLTSCR1 upon induction of DSBs. Scale bars, 2 µm. B) Quantification of ongoing transcription in U2OS‐263 reporter cells treated with indicated siRNAs from experiments in panel (A). >100 cells were analyzed in each group. Data are presented as the mean ± SEM. C) DSBs‐induced exclusion of RNAP II Ser 2 from sites of laser damage was restored in BRD7‐depleted cells. Representative immunofluorescence images of U2OS cells treated with BRD7 sgRNA following by UV laser are shown. Scale bars, 2 µm. D) Depletion of BRD7 restored local inhibition of RNA synthesis visualized by 5‐EU incorporation. Cells treated with control or BRD7 siRNAs were subjected to 5‐EU label assay following laser damage and analyzed by immunofluorescence. E,F) Quantification of 5‐EU and γH2AX fluorescence intensity from panel (D) using Image J software (NIH). Values were normalized to undamaged regions. Error bars indicate SEM; n > 10. G) Schematic of U2OS‐265 DSB reporter cells. Doxycycline induces transcription of the reporter gene, allowing be measured by quantitative PCR (qPCR) with indicated primers. Fok1‐mediated DSBs can be introduced by stabilizing ER‐mCherry‐Lac1‐Fok1‐DD with addition of Shield 1 and 4‐OHT. H) BRD7 and CHD4, but not LSD1, promote transcriptional repression at DSBs. The U2OS‐265 cells transfected with indicated siRNAs following by DSBs induction were subjected to qPCR analysis with indicated primers. Error bars indicate SEM. A pool of siCHD4#1 and siCHD4#2 was used for CHD4 knockdown treatments. n.s., not significant; **P < 0.01, ***P < 0.001, Student's t‐test.
Figure 2
Figure 2
ATM‐dependent recruitment of BRD7 to DSBs nearby transcriptionally active regions. A) Recruitment of GFP‐BRD7 in laser damage. Representative images after UV laser damage are shown. B) BRD7 recruitment to Fok1‐induced DSBs. GFP‐BRD7 was transfected into U2OS‐265 DSB reporter cells, and cells were damaged by inducing site‐specific DSBs after 24 h transfection. Representative images after DNA damage are shown. C) BRD7 recruitment to I‐SecI‐induced DSBs analyzed by chromatin immunoprecipitation (ChIP) assay. Eight hours after I‐SecI transfection, ChIP assay was performed to detect the enrichment of BRD7 relative to the IgG control. D) The recruitment of BRD7 to DSBs increased throughout the cell cycle. HeLa DR‐GFP cells were treated with double‐thymidine to achieve cells at G1‐S boundary and then left unreleased (G1 phase) or released into the thymidine‐free medium for 3 h (S phase) or 7 h (G2 phase). The cells harvested at indicated phases were subjected to ChIP assay according to the Experimental Procedures. E) The recruitment of BRD7 to DNA damage was not restricted to S/G2 cells. Cyclin A is a S/G2 marker. GFP‐BRD7 was transfected into U2OS‐265 DSB reporter cells, and cells were introduced site‐specific DSBs. Representative images after DNA damage are shown. F) GFP‐BRD7 is preferentially recruited to DSBs induced upstream of active gene. U2OS‐265 DSB reporter cells were first treated with 1 µg mL−1 doxycycline for 2 h to induce nascent transcription of the reporter gene, and then cells were induced site‐specific DSBs after 24 h transfection of GFP‐BRD7. Representative images after DNA damage are shown. G) Quantification of GFP‐BRD7 focus colocalized with Fok1 of panel (F). Data are represented as mean ± SEM. H) ATM and PARP1, but neither ATR nor DNA‐PK is required for the recruitment of BRD7 to DSBs. U2OS‐265 DSB reporter cells were transfected with GFP‐BRD7 for 24 h, then ATM inhibitor (Ku55933, 10 × 10−6 m), ATR inhibitor (VE‐821, 10 × 10−6 m), DNA‐PK inhibitor (NU7441, 5 × 10⁻⁶ m), PARP inhibitor (Olaparib, 10 × 10−6 m) were added for additional 4 h, followed by introduced site‐specific DSBs. Representative images after DNA damage are shown in (H). All the scale bars are 2 µm. I) Quantification of GFP‐BRD7 relative mean fluorescence intensity (RMFI) from H) calculated from 50 cells using Image J software (NIH) and three independent experiments. Error bars indicate SEM. n.s., not significant; **P < 0.01, ***P < 0.001, Student's t‐test.
Figure 3
Figure 3
BRD7 associates with PRC2, NuRD complexes and recruits these factors to damaged chromatin. A–C) BRD7 interacts with PRC2 and NuRD complexes, but not with PRC1 complex. HeLa cells were treated with IR (5 Gy), followed by IP using either anti‐IgG, anti‐BRD7, anti‐EZH2 or anti‐SUZ12 antibodies, and analyzed by Western blot. D,F) Recruitment of EZH2 and H2A‐Ub to laser damage requires BRD7. Control and BRD7‐depleted cells were subjected to UV laser, and endogenous EZH2 and H2A‐Ub accumulation was analyzed by immunofluorescence. E,G) ChIP‐PCR was performed in U2OS‐265 reporter cells with and without Fok1‐induced DSBs using either anti‐IgG or H3K27me3 or H2AK119Ub antibodies. Error bars indicate SEM from three independent experiments. H) BRD7 recruits CHD4 to the DSB site. Control and BRD7‐depleted cells were subjected to UV laser, and endogenous CHD4 accumulation was analyzed by immunofluorescence. All the scale bars are 2 µm. I,J) Transcriptional activity was measured in U2OS‐263 reporter cells transfected with small interfering RNA (siRNA) targeting either MBD2 or MBD3 upon induction of DSBs. Scale bars, 2 µm. J) Quantification of ongoing transcription in U2OS‐263 reporter cells treated with indicated siRNAs from experiments in panel (I). >50 cells were analyzed in each group. Data are presented as the mean ± SEM. n.s., not significant; **P < 0.01, ***P < 0.001, Student's t‐test.
Figure 4
Figure 4
BRD7 recruits RNF168 to the DSB site. A,B) BRD7 interacts with RNF168 but not with RNF8. HeLa cells transfected with Flag‐RNF8 or Flag‐RNF168 were treated with IR (5 Gy), followed by IP using anti‐Flag, anti‐IgG or RNF168 antibodies, and Western blot was performed with indicated antibodies. C) U2OS‐265 cells were infected with RNF168 specific shRNAs and cultured in DMEM medium containing blasticidin for 72 h. Cells were lysed with RIPA buffer, and analyzed using Western blot. D) RNF168 depletion did not affect the accumulation of GFP‐BRD7 to Fok1‐induced DSBs. The U2OS‐265 cells depleted RNF168 were transfected with GFP‐BRD7 for 24 h and cells were subjected to introduce site‐specific DSBs. Representative images after DNA damage are shown. E) Recruitment of RNF168 to laser damage requires BRD7. Control and BRD7‐depleted cells were subjected to UV laser, and endogenous RNF168 accumulation was analyzed by immunofluorescence. F) Quantification of RNF168 relative mean fluorescence intensity (RMFI) from E) calculated from 50 cells using Image J software (NIH) and three independent experiments. Error bars indicate SEM. G,H) U2OS‐265 cells were transfected with either scrambled or BRD7 siRNAs for 48 h, and cells were induced site‐specific DSBs, followed by analysis of immunofluorescence. Representive images after DNA damage are shown. Scale bars, 2 µm. H) Quantification of % BRCA1 colocalized with Fok1 in panel (G). Error bars indicate SEM; n = 3. I) BRD7 recruits BRCA1 to the DSB site. Control and BRD7‐depleted cells were subjected to UV laser, and endogenous BRCA1 was analyzed by immunofluorescence. All the scale bars are 2 µm. J,K) BRD7 depletion reduces 53BP1 foci formation. BRD7‐depleted HeLa cells were treated with IR (5 Gy) and allowed to recover for 30 min before fixing and processed for 53BP1 and γH2AX immunofluorescence. Quantification results are the average of three independent experiments and are presented as mean ± SEM. More than 100 cells were counted in each experiment. n.s., not significant; **P < 0.01, ***P < 0.001, Student's t‐test.
Figure 5
Figure 5
BRD7 binds and recruits MRN complex to DSBs sites. A,B) BRD7 interacts with MRN complex and BRCA1. HeLa cells were treated first with 5 Gy of IR and lysed with RIPA buffer after 1 h, and lysates were subjected to immunoprecipitation, and analyzed by Western blot. C) BRD7 depletion suppressed the recruitment of MRN complex to damaged chromatin. HeLa cells depleted of BRD7 were treated with IR (5 Gy) and allowed to release for 1 h. Chromatin binding proteins were isolated according to the Supplemental Experimental Procedures followed by Western blot analysis. D) BRD7 depletion reduces recruitment of BRCA1 and NBS1 to I‐SecI‐induced DSBs. Eight hours after I‐SecI transfection, ChIP assay was performed to detect the enrichment of BRCA1, NBS1, RAD51 relative to the IgG control. Quantification results are the average of three independent experiments and are shown as mean ± SEM. E) BRD7 depletion impairs recruitment of NBS1 to laser damage. Control and BRD7‐depleted cells were subjected to UV laser, and endogenous NBS1 accumulation was analyzed by immunofluorescence. Scale bars, 5 µm. F) BRD7 knockdown suppresses Fok1‐induced NBS1 foci formation. Control and BRD7 knockdown U2OS‐265 cells were induced site‐specific DSBs and processed for NBS1 immunofluorescence. Representative NBS1 foci are shown. Scale bars, 2 µm. G) Control and BRD7 knockout HeLa DR‐GFP cells stably expressing NBS1 shRNA were electroporated with I‐SceI plasmid. 48 h after transfection, cells were harvested and performed for GFP expression by flow cytometry analysis (FACS). Quantification results are the average of three independent experiments and are shown as mean ± SEM. H,I) The sensitivity of control cells and BRD7 knockout HeLa cells with stably expressing NBS1 shRNA to CPT or Olaparib were assessed using colony formation assay. The cell lines were treated with indicated doses of CPT or Olaparib, and cell survival were measured. Results shown are averages of three independent experiments.
Figure 6
Figure 6
BRD7 depletion inhibits DNA‐end resection. A,B) BRD7 depletion impairs CPT‐induced RPA2 foci formation. Control and BRD7‐depleted HeLa cells were treated with CPT (1 × 10⁻⁶ m) for 1 h before fixing and subjected to immune staining analysis with indicated antibodies. Representative RPA2 foci are shown in (A). Quantification results are the average of three independent experiments and are showed as mean ± SEM in panel B. More than 100 cells are counted in each assay. C,D) BRD7 depletion inhibits HU‐induced RPA2 foci formation. Control and BRD7‐depleted HeLa cells were treated with HU (10 × 10−3 m) for 1 h before fixing and subjected to immune staining analysis with indicated antibodies. Representative RPA2 foci are shown in (C). Quantification results are the average of three independent experiments and are showed as mean ± SEM in panel (D). More than 100 cells are counted in each assay. E–H) BRD7 depletion impairs Fok1‐induced RPA2 and RAD51 foci formation. Control and BRD7‐depleted U2OS‐265 cells were induced site‐specific DSBs and processed for RPA2 and RAD51 immunofluorescence. Representative RPA2 and RAD51 foci are shown in (E,G). Quantification results are the average of three independent experiments and are showed as mean ± SEM in panel (F,H). More than 100 cells are counted in each assay. I,J) BRD7 depletion impairs RPA2, CHK1, and CHK2 phosphorylation following CPT or IR treatment. Control and BRD7 or NBS1‐depleted HeLa cells were harvested at 1 h after cells exposure to 1 × 10⁻⁶ m CPT or 5 Gy IR and cell lysates subjected to western blot analysis with indicated antibodies. Scale bars, 5 µm. n.s., not significant; **P < 0.01, ***P < 0.001, Student's t‐test.
Figure 7
Figure 7
ATM and ATR directly phosphorylate BRD7 at Ser 263 and Thr 515 sites respectively. A,B) HeLa cells were treated with CPT (1 × 10⁻⁶ m) for different time intervals followed by lysing with RIPA buffer, and lysates were subjected to immunoprecipitation using either anti‐(pS/pT)Q or anti‐BRD7 antibodies and immunoblotted with the indicated antibodies. C) HeLa cells treated with CPT (1 × 10⁻⁶ m, 1 h) were lysed with RIPA buffer, and lysates were subjected to immunoprecipitation using either anti‐IgG, or ATM or ATR antibodies, and analyzed by Western blot. D) HeLa cells were treated first with DMSO, KU55933 (ATM inhibitor, 10 × 10−6 m), VE‐821 (ATR inhibitor, 10 × 10−6 m) or NU7441 (DNA‐PK inhibitor, 1 × 10⁻⁶ m) for 2 h followed by treatment with CPT for another 1 h, and the cells were lysed with RIPA buffer, and subjected to immunoprecipitation using either anti‐IgG, or BRD7 antibodies, and analyzed by Western blot with the indicated antibodies. E) HeLa cells were transfected with indicated siRNAs for 48 h followed by treatment with CPT for another 1 h, and then were lysed with RIPA buffer, and were subjected to immunoprecipitation using indicated antibodies. F) HeLa cells were transfected with BRD7 wild‐type and various BRD7‐mutant plasmids for 24 h followed by treatment with CPT for another 1 h, lysed with RIPA buffer, followed by immunoprecipitation and Western blot with indicated antibodies. G) HeLa cells were transfected with BRD7 wild‐type and BRD7 double mutant plasmids for 24 h followed by CPT treatment for another 1 h, and analyzed by Western blot. H) ATM directly phosphorylates BRD7 at Ser 263. An in vitro ATM assay was performed as described in Experimental Section. I) ATR directly phosphorylates BRD7 at Thr 515. An in vitro ATR assay was performed as described in Supplementary Material and Methods. J) HeLa cells were transfected with either BRD7 wild‐type, BRD7‐S263A or BRD7‐T515A for 24 h, followed by incubation with 10 µg mL−1 cycloheximide (CHX) for the indicated periods of time. Lysates were harvested and analyzed by Western blot. K) Quantification of BRD7 protein levels from panel (J), n = 3. Error bars indicate SEM. Relative amounts normalized to the BRD7 protein level at 0 h.
Figure 8
Figure 8
ATM‐mediated phosphorylation BRD7 at Ser 263 is required for HR repair and transcriptional repression. A) Recruitment of BRD7‐S263A to Fok1‐induced DSBs was remarkedly reduced. GFP‐BRD7 and indicated mutant constructs were transfected into U2OS‐265 DSB reporter cells for 24 h, and cells were induced site‐specific DSBs. Representative images after DNA damage are shown. B) Quantification of GFP‐BRD7 wild‐type and mutants focus colocalized with Fok1 of panel (A). Data are represented as mean ± SEM. Error bars indicate SEM. C) Flag‐BRD7 and mutants BRD7 recruitment to I‐SecI‐induced DSBs analyzed by ChIP assay. HeLa DR‐GFP reporter cells stably expressing indicated constructs were electroporated with I‐SecI plasmid. Eight hours after I‐SecI transfection, ChIP assay was performed to detect the enrichment of Flag‐BRD7 and mutants BRD7 relative to the vector control. D) Recruitment of H2A‐Ub to laser damage was reduced in BRD7‐S263A. Wild‐type and indicated mutant BRD7 were transfected into HeLa cells depleted of endogenous BRD7 and subjected to UV laser, and endogenous H2A‐Ub accumulation was analyzed by immunofluorescence. Representative images after DNA damage are shown. E) Transcription activity was measured in U2OS‐263 DSB reporter cells transfected with indicated BRD7 constructs after depletion of endogenous BRD7, followed by inducing site‐specific DSBs. Ongoing transcription of the reporter gene can be detected by the presence of a YFP‐MS2 foci. Representative images after DSBs induction are shown. F) Quantification of YFP‐MS2 positive cells from experiments as in panel (E). Quantification results are the average of three independent experiments and are shown as mean ± SEM. G) Model of the role of the PBAF subunit BRD7 in coordinating DSB‐induced transcriptional repression and HR repair. Scale bars, 2 µm. n.s., not significant; **P < 0.01, ***P < 0.001, Student's t‐test.

References

    1. Meisenberg C., Pinder S. I., Hopkins S. R., Wooller S. K., Benstead‐Hume G., Pearl F. M. G., Jeggo P. A., Downs J. A., Mol. Cell 2019, 73, 212e7. - PMC - PubMed
    1. San Filippo J., Sung P., Klein H., Annu. Rev. Biochem. 2008, 77, 229. - PubMed
    1. Adam S., Polo S. E., Exp. Cell Res. 2014, 329, 148. - PMC - PubMed
    1. Shanbhag N. M., Rafalska‐Metcalf I. U., Balane‐Bolivar C., Janicki S. M., Greenberg R. A., Cell 2010, 141, 970. - PMC - PubMed
    1. Uckelmann M., Sixma T. K., DNA Repair 2017, 56, 92. - PubMed