. 2020 Sep 2;7(20):2001936.
doi: 10.1002/advs.202001936. eCollection 2020 Oct.

Alterations of the Human Gut Microbiome in Chronic Kidney Disease

Affiliations

Alterations of the Human Gut Microbiome in Chronic Kidney Disease

Zhigang Ren et al. Adv Sci (Weinh). .

Abstract

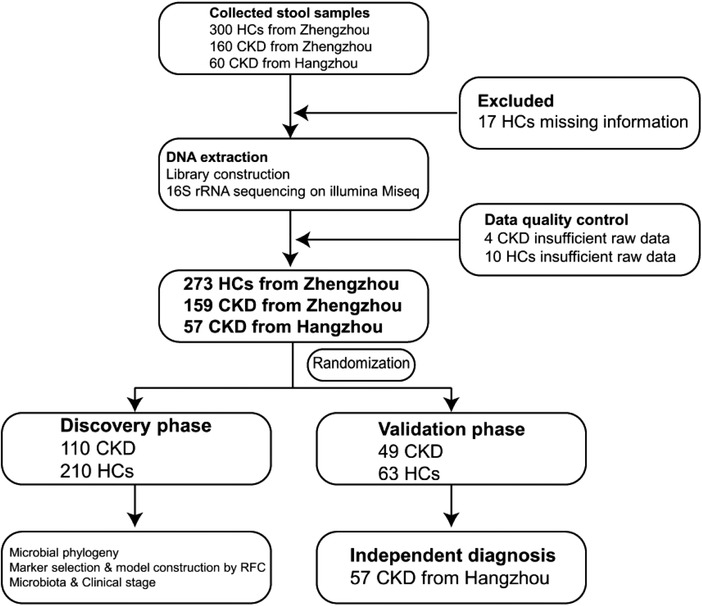
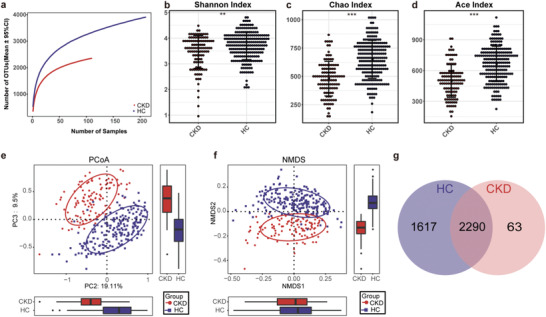
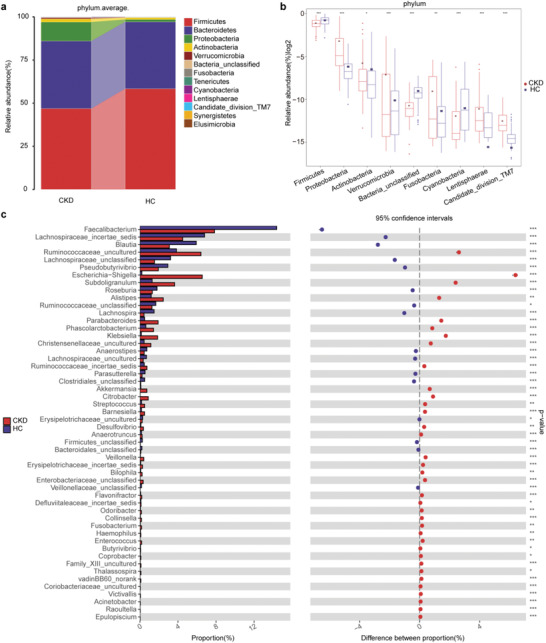
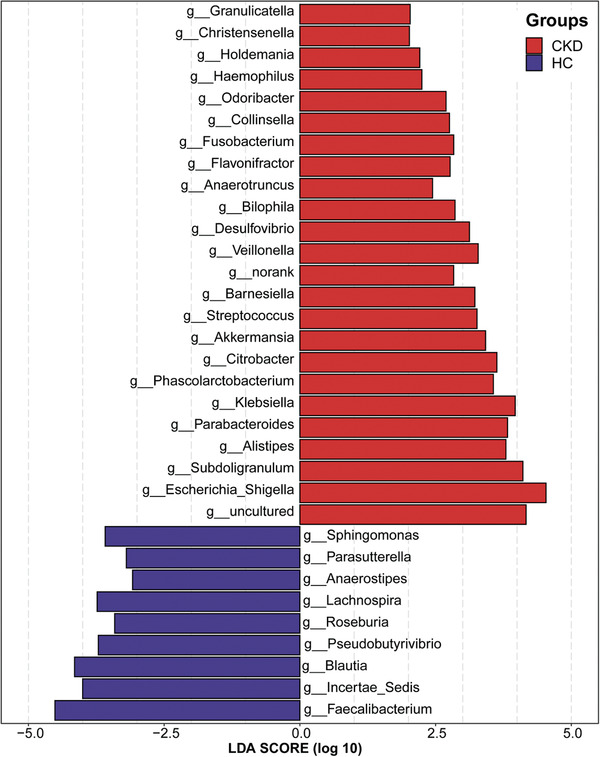
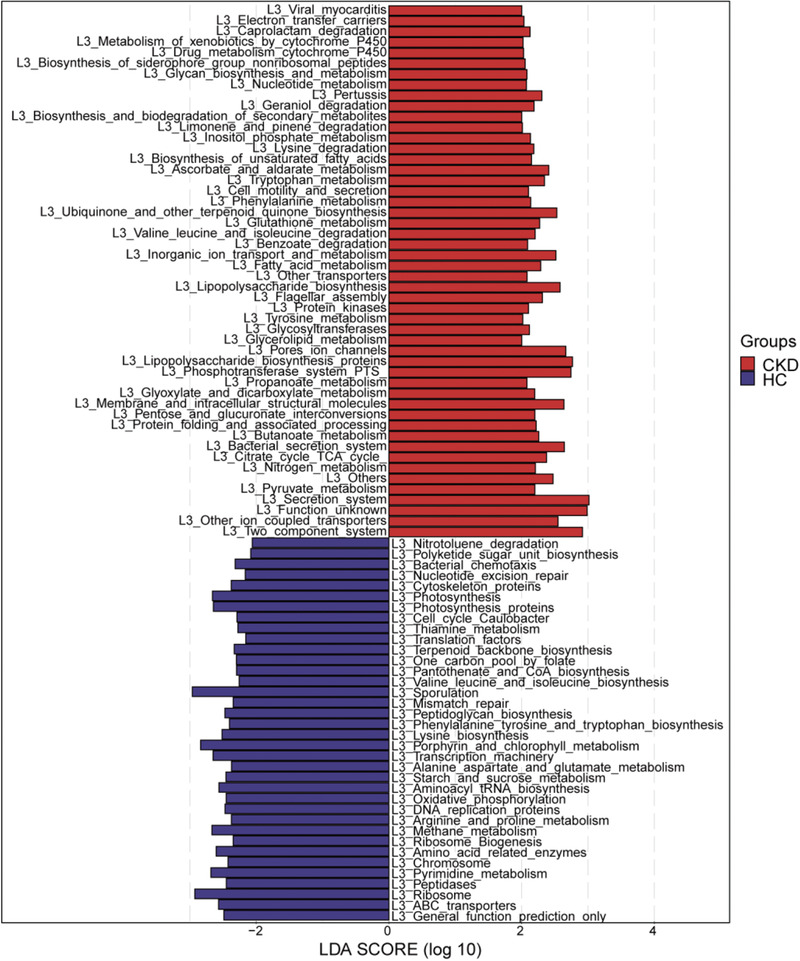
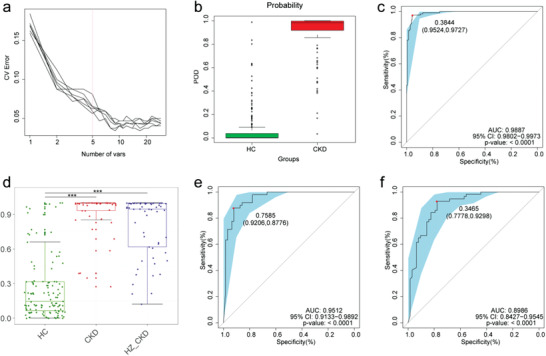
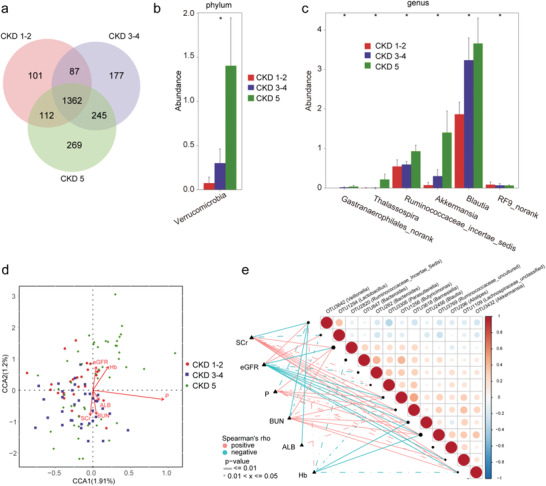
Gut microbiota make up the largest microecosystem in the human body and are closely related to chronic metabolic diseases. Herein, 520 fecal samples are collected from different regions of China, the gut microbiome in chronic kidney disease (CKD) is characterized, and CKD classifiers based on microbial markers are constructed. Compared with healthy controls (HC, n = 210), gut microbial diversity is significantly decreased in CKD (n = 110), and the microbial community is remarkably distinguished from HC. Genera Klebsiella and Enterobacteriaceae are enriched, while Blautia and Roseburia are reduced in CKD. Fifty predicted microbial functions including tryptophan and phenylalanine metabolisms increase, while 36 functions including arginine and proline metabolisms decrease in CKD. Notably, five optimal microbial markers are identified using the random forest model. The area under the curve (AUC) reaches 0.9887 in the discovery cohort and 0.9512 in the validation cohort (49 CKD vs 63 HC). Importantly, the AUC reaches 0.8986 in the extra diagnosis cohort from Hangzhou. Moreover, Thalassospira and Akkermansia are increased with CKD progression. Thirteen operational taxonomy units are correlated with six clinical indicators of CKD. In conclusion, this study comprehensively characterizes gut microbiome in non-dialysis CKD and demonstrates the potential of microbial markers as non-invasive diagnostic tools for CKD in different regions of China.

Keywords: chronic kidney disease; gut microbiome; microbial markers; non‐invasive diagnostic tools.


Conflict of interest statement

The authors declare no conflict of interest.

Figures

Figure 1
Figure 1
Study design and flow diagram. A total of 520 fecal samples from different parts of China were collected prospectively. After a rigorous diagnosis and exclusion procedures, 159 CKD and 273 HC samples from Zhengzhou, China, and 57 CKD samples from Hangzhou, China, were included. All samples from Zhengzhou were randomly divided into the discovery cohort and the validation cohort. In the discovery cohort, we characterized gut microbiome between 110 CKD and 210 HC and identified the microbial markers and constructed a CKD classifier by a random forest classifier model between CKD and HC. In the validation cohort, we validated the diagnosis efficacy of CKD classifier in 49 CKD and 63 HC. Finally, 57 CKD from Hangzhou served as an independent diagnostic cohort to verify the diagnostic efficacy of CKD classifier. CKD, chronic kidney disease; HC, healthy controls; RFC, random forest classifier model.
Figure 2
Figure 2
Gut microbial diversity of patients with non‐dialysis CKD was decreased. a) The rarefaction analysis between the number of samples and the number of OTUs. As the number of samples increased, the number of OTUs approached saturation in CKD (n = 110) and HC (n = 210). Compared with the HC, the number of OTUs in CKD was decreased significantly. As estimated by b) the Shannon index, c) the Chao index, and d) the Ace index, gut microbial diversity was significantly decreased in CKD (n = 110) compared with that in the HC (n = 210) (p < 0.01, p < 0.001, and p < 0.001, respectively). e) The PCoA and f) the NMDS based on OTUs distribution showed that the gut taxonomic composition was significantly different between CKD (n = 110) and HC (n = 210). g) A Venn diagram displaying the overlaps between groups showed that 2290 of the total number of 3970 OTUs were shared in both groups, while 63 were unique for CKD (n = 110). *, p <0.05; **, p<0.01; *** p<0.001. CKD, chronic kidney disease; HC, healthy controls; OTUs, operational taxonomic units; PCoA, principal coordinate analysis; NMDS, non‐metric multidimensional scaling.
Figure 3
Figure 3
Phylogenetic profiles of the gut microbiome between CKD (n = 110) and HC (n = 210). a) Average compositions and relative abundance of the bacterial community in both groups at the phylum level. b) Compared with HC (n = 210), five phyla were significantly enriched, whereas four phyla were significantly reduced in CKD (n = 110) (all p < 0.05). c) Thirty‐six genera were significantly enriched, while 16 genera were significantly reduced in CKD (n = 110) versus HC (n = 210) (all p < 0.05). *, p < 0.05, **, p < 0.01, ***, p < 0.001. CKD, chronic kidney disease; HC, healthy controls.
Figure 4
Figure 4
Crucial bacteria of gut microbiome related to CKD. Based on the LDA selection, 24 genera were significantly enriched, while 9 genera were significantly reduced in CKD (n = 110) compared with HC (n = 210) (all p < 0.01). CKD, chronic kidney disease; HC, healthy controls; LDA, linear discriminant analysis.
Figure 5
Figure 5
Crucial microbial predicted functions related to CKD. Based on the LDA selection, 50 predicted microbial functions were remarkably increased, while 36 functions were remarkably decreased in CKD (n = 110) compared with HC (n = 210) (all p < 0.05). CKD, chronic kidney disease; HC, healthy controls; LDA, linear discriminant analysis.
Figure 6
Figure 6
Diagnostic potential of gut microbial markers in CKD patients. a) Five microbial markers were selected as the optimal markers set by the random forest model. b) The POD value was significantly increased in CKD (n = 110) versus HC (n = 210) in the discovery cohort. c) The POD index achieved an AUC value of 0.9887 with 95% CI of 0.9802 to 0.9973 between CKD (n = 110) versus HC (n = 210) in the discovery cohort (p < 0.0001). d) The POD values were remarkably increased in CKD (n = 49) and HZ_CKD (n = 57) compared with HC (all p < 0.001). e) The POD index achieved an AUC value of 0.9512 with 95% CI of 0.9133 to 0.9892 between CKD (n = 49) versus HC (n = 63) in the validation cohort (p < 0.0001). f) The POD index achieved an AUC value of 0.8986 with 95% CI of 0.8427 to 0.9545 between HZ_CKD (n = 57) versus HC (n = 63) in the independent diagnostic cohort (p < 0.0001). *, p < 0.05, **, p < 0.01, ***, p < 0.001. CV Error, the cross‐validation error; CKD, chronic kidney disease; HZ_CKD, the patients of CKD come from Hangzhou; HC, healthy controls; POD, probability of disease; CI, confidence interval; AUC, area under the curve.
Figure 7
Figure 7
Alterations of the gut microbiome along with the CKD progression. a) A Venn diagram displaying the overlaps among groups showed that the total number of OTUs was 2353, and 1362 OUTs were shared in all groups. Noteworthy, 101 OTUs, 177 OTUs, and 269 OTUs were unique for CKD stages 1–2 (n = 26), CKD stages 3–4 (n = 36), and CKD stage 5 (n = 48), respectively. b) With the progress of CKD, the increased microbial community at the phylum level (p < 0.05). c) With the progression of CKD, the increased and decreased microbial community at the genus level (all p < 0.05). d) The CCA analysis of the associations between the gut microbiome and clinical indicators for CKD from CCA1 and CCA2 (1.91% and 1.2%). e) Heatmap showing the partial Spearman's correlation coefficients among 13 OTUs and 6 clinical indicators of CKD (n = 110). Distance correlation plots of relative abundances of 13 OTUs and the clinical indices SCr, eGFR, P, BUN, ALB, and Hb. CKD, chronic kidney disease; CCA, canonical correspondence analysis; OTUs, operational taxonomy units; Hb, hemoglobin; ALB, albumin; BUN, blood urea nitrogen; SCr, serum creatinine; eGFR, estimated glomerular filtration rate; P, phosphate.

Similar articles

Cited by

References

    1. Levey A. S., Coresh J., Lancet 2012, 379, 165. - PubMed
    1. a) Kolhe N. V., Eldehni M. T., Selby N. M., McIntyre C. W., Nephron Clin. Pract. 2014, 126, 51; - PubMed
    2. b) Lewington A. J., Cerdá J., Mehta R. L., Kidney Int. 2013, 84, 457; - PMC - PubMed
    3. c) Horne K. L., Selby N. M., Curr. Opin. Crit. Care 2015, 21, 479. - PubMed
    1. Hill N. R., Fatoba S. T., Oke J. L., Hirst J. A., O'Callaghan C. A., Lasserson D. S., Hobbs F. D., PLoS One 2016, 11, e0158765. - PMC - PubMed
    1. Smith D. H., Gullion C. M., Nichols G., Keith D. S., Brown J. B., J. Am. Soc. Nephrol. 2004, 15, 1300. - PubMed
    1. a) Nenci A., Becker C., Wullaert A., Gareus R., van Loo G., Danese S., Huth M., Nikolaev A., Neufert C., Madison B., Gumucio D., Neurath M. F., Pasparakis M., Nature 2007, 446, 557; - PubMed
    2. b) Ley R. E., Peterson D. A., Gordon J. I., Cell 2006, 124, 837. - PubMed

LinkOut - more resources