

Case Reports
doi: 10.1016/j.hrcr.2020.06.023.
eCollection 2020 Oct.
High-density substrate and activation mapping of epicardial ventricular tachycardia during left ventricular assist device implant
Affiliations
- PMID: 33101933
- PMCID: PMC7573345
- DOI: 10.1016/j.hrcr.2020.06.023
Item in Clipboard
Case Reports
High-density substrate and activation mapping of epicardial ventricular tachycardia during left ventricular assist device implant
HeartRhythm Case Rep.
.
No abstract available
Keywords: Electroanatomic mapping; Epicardial VT ablation; LVAD; Substrate-based VT ablation; Ventricular tachycardia.
Figures

Ventricular tachycardia (VT) electrocardiograms (ECG). Top: Twelve-lead ECG of clinical VT. Axis and morphology consistent with epicardial, basal, anterolateral focus. Bottom: Twelve-lead ECG of VT post–left ventricular assist device (LVAD) implant. Inferior apical septum exit site is consistent with an LVAD cannula origin.
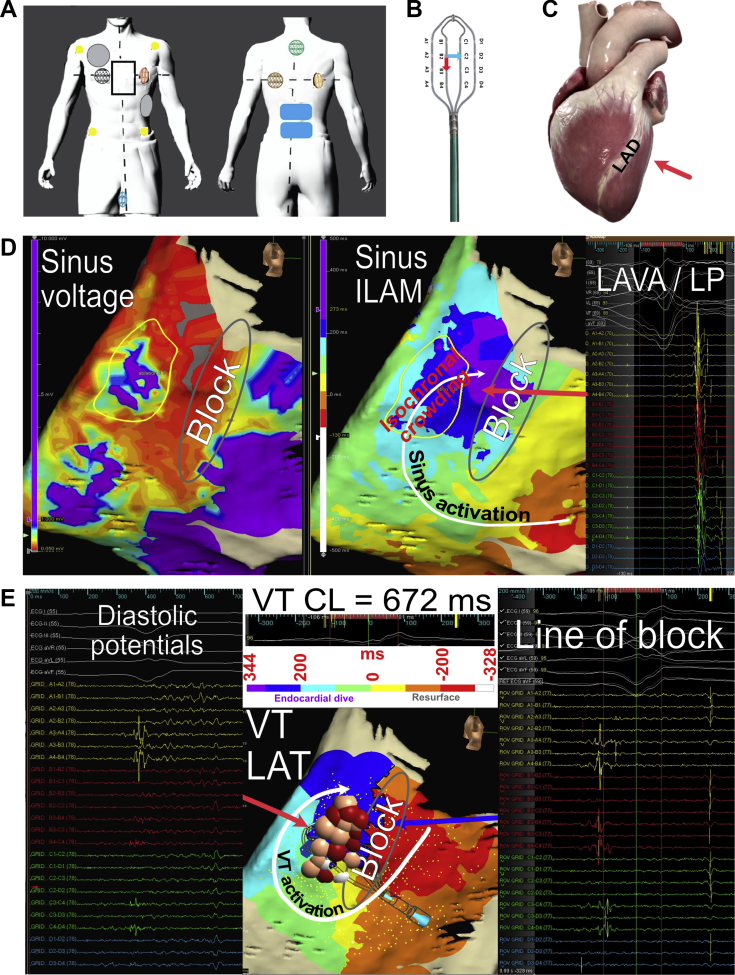
Electroanatomic (EA) mapping. A: Placement of pads. Yellow circles: electrocardiogram limb electrodes; gray circles: defibrillation pads; black rectangle: sternotomy; colored circles: impedance mapping pads; blue rectangles: grounding pads. B: HD-Grid catheter (Abbott, Minneapolis, MN) depicting electrode and bipole orientation. Reprinted with permission from Abbott. C: Schematic of heart with red arrow identifying region that was mapped and ablated. Printed and modified with permission from Complete Heart Version 1.2, 3D4D medical. D: Sinus EA map. Left panel: Color scheme represents voltages from 0.05 to 1 mV. Region with scar (yellow circle) and region of conduction block (gray oval) are highlighted. Middle panel: Sinus isochronal late activation map (ILAM) depicting zones with conduction block (gray oval) and isochronal crowding (slow activation). Right panel: Example of electrical signals from each bipole on the HD-Grid demonstrating local abnormal ventricular activations (LAVA) and late potentials (LP) in the area with isochronal crowding. E: Ventricular tachycardia (VT) EA map. Left panel: HD-Grid positioned across the slow activation zone revealing fractionated, low-voltage, diastolic potentials, consistent with VT isthmus. Middle panel: Isochronal local activation time map (LAT) with arrow depicting a macroreentrant circuit ending with an endocardial dive. Gray oval corresponds to region of block observed during sinus activation mapping. Red and pink dots correspond to ablation lesions color coded by impedance drop (0–5, 5–10, >10 ohms). Right panel: HD-Grid positioned across the superior portion of the VT circuit revealing widely spaced doubles, consistent with conduction block. CL = cycle length.
References
-
- Moss J.D., Oesterle A., Raiman M. Feasibility and utility of intraoperative epicardial scar characterization during left ventricular assist device implantation. J Cardiovasc Electrophysiol. 2019;30:183–192. - PubMed
-
- Shirai Y., Liang J.J., Santangeli P. Comparison of the ventricular tachycardia circuit between patients with ischemic and nonischemic cardiomyopathies. Circ Arrhythm Electrophysiol. 2019;12 - PubMed
-
- Gokoglan Y., Mohanty S., Gianni C. Scar homogenization versus limited-substrate ablation in patients with nonischemic cardiomyopathy and ventricular tachycardia. J Am Coll Cardiol. 2016;68:1990–1998. - PubMed
-
- Kumar S., Baldinger S.H., Romero J. Substrate-based ablation versus ablation guided by activation and entrainment mapping for ventricular tachycardia: A systematic review and meta-analysis. J Cardiovasc Electrophysiol. 2016;27:1437–1447. - PubMed
-
- Josephson M.E., Callans D.J. Using the twelve-lead electrocardiogram to localize the site of origin of ventricular tachycardia. Heart Rhythm. 2005;2:443–446. - PubMed
Publication types
LinkOut - more resources
Full Text Sources
