. 2020 Sep 25:8:575195.
doi: 10.3389/fchem.2020.575195. eCollection 2020.

Energy Landscape for the Membrane Fusion Pathway in Influenza A Hemagglutinin From Discrete Path Sampling

Affiliations

Energy Landscape for the Membrane Fusion Pathway in Influenza A Hemagglutinin From Discrete Path Sampling

David F Burke et al. Front Chem. .

Abstract

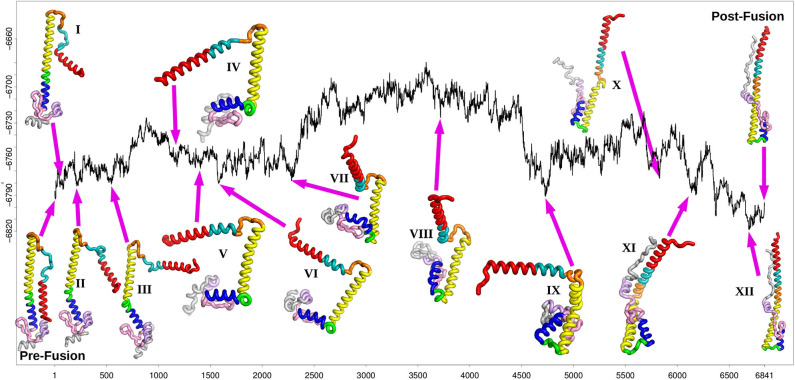
The conformational change associated with membrane fusion for Influenza A Hemagglutinin is investigated with a model based upon pre- and post-fusion structures of the HA2 component. We employ computational methods based on the potential energy landscape framework to obtain an initial path connecting these two end points, which provides the starting point for refinement of a kinetic transition network. Here we employ discrete path sampling, which provides access to the experimental time and length scales via geometry optimization techniques to identify local minima and the transition states that connect them. We then analyse the distinct phases of the predicted pathway in terms of structure and energetics, and compare with available experimental data and previous simulations. Our results provide the foundations for future work, which will address the effect of mutations, changes in pH, and incorporation of additional components, especially the HA1 chain and the fusion peptide.

Keywords: discrete path sampling; energy landscape; influenza; membrane fusion; rare event algorithms.


Figures

Figure 1
Figure 1
The pre-fusion and post-fusion structures selected as the end points for the pathway search in the present work. The labels A to G refer to the regions identified from the crystal structure (Ni et al., 2014). Here, we distinguish between the N-terminal section of the B-loop, which readily forms an alpha helical conformation (positions 56-66), from the C-termimal section, which converts later in the pathway (positions 67-75). The coloring scheme reflects sections of the protein that can be identified with rearrangements in specific parts of the pathway, as follows: red, helix A (positions 38-55); cyan, helix B (positions 56-66); orange, B-loop (positions 67-75); yellow, helix C (positions 76-105); green, loop D (positions 106-111); blue, helix E (positions 112-125); pink, beta-hairpin F (residues 126-144); mauve, helix G (residues 145-154); gray, C-terminal fragment (residues 155-181); all structures were visualized using VMD (Humphrey et al., 1996). The numbering scheme starts from HA2 after cleavage.
Figure 2
Figure 2
Comparison of the initial connected path and the fastest path after refinement of the database. The relative energy in kcal/mol is plotted against the number of stationary points, which are organized in a connected sequence minimum-transition state-minimum-transition state-minimum, etc. from pre- to post-fusion structures. The initial path has 4,326 transition states and 8,653 stationary points; the refined path has 3,420 transition states and 6,841 stationary points.
Figure 3
Figure 3
Fastest path after refinement of the database, with selected local minima illustrated for the stationary points at position 81(I), 223(II), 541(III), 1183(IV), 1391(V), 1577(VI), 2283(VII), 3717(VIII), 4737(IX), 5829(X), 6137(XI), and 6693(XII) (the post-fusion end point minimum). The relative energy in kcal/mol is plotted against the number of stationary points, as in Figure 2.
Figure 4
Figure 4
Disconnectivity graph for the HA2 system marking the locations of the same selected minima from the pathway shown in Figure 3.

Similar articles

Cited by

References

    1. Asenjo D., Stevenson J. D., Wales D. J., Frenkel D. (2013). Visualizing basins of attraction for different minimization algorithms. J. Phys. Chem. B 117, 12717–12723. 10.1021/jp312457a - DOI - PubMed
    1. Bauer M. S., Strodel B., Fejer S. N., Koslover E. F., Wales D. J. (2010). Interpolation schemes for peptide rearrangements. J. Chem. Phys. 132:054101. 10.1063/1.3273617 - DOI - PubMed
    1. Becker O. M., Karplus M. (1997). The topology of multidimensional potential energy surfaces: theory and application to peptide structure and kinetics. J. Chem. Phys. 106:1495 10.1063/1.473299 - DOI
    1. Bolhuis P. G., Chandler D., Dellago C., Geissler P. L. (2002). Transition path sampling: throwing ropes over rough mountain passes, in the dark. Annu. Rev. Phys. Chem. 53, 291–318. 10.1146/annurev.physchem.53.082301.113146 - DOI - PubMed
    1. Broyden C. G. (1970). The convergence of a class of double-rank minimization algorithms 1. general considerations. J. Inst. Math. Appl. 6, 76–90. 10.1093/imamat/6.1.76 - DOI