. 2020 Sep 25:8:573393.
doi: 10.3389/fcell.2020.573393. eCollection 2020.

Equatorial Non-muscle Myosin II and Plastin Cooperate to Align and Compact F-actin Bundles in the Cytokinetic Ring

Affiliations

Equatorial Non-muscle Myosin II and Plastin Cooperate to Align and Compact F-actin Bundles in the Cytokinetic Ring

Joana Leite et al. Front Cell Dev Biol. .

Abstract

Cytokinesis is the last step of cell division that physically partitions the mother cell into two daughter cells. Cytokinesis requires the assembly and constriction of a contractile ring, a circumferential array of filamentous actin (F-actin), non-muscle myosin II motors (myosin), and actin-binding proteins that forms at the cell equator. Cytokinesis is accompanied by long-range cortical flows from regions of relaxation toward regions of compression. In the C. elegans one-cell embryo, it has been suggested that anterior-directed cortical flows are the main driver of contractile ring assembly. Here, we use embryos co-expressing motor-dead and wild-type myosin to show that cortical flows can be severely reduced without major effects on contractile ring assembly and timely completion of cytokinesis. Fluorescence recovery after photobleaching in the ingressing furrow reveals that myosin recruitment kinetics are also unaffected by the absence of cortical flows. We find that myosin cooperates with the F-actin crosslinker plastin to align and compact F-actin bundles at the cell equator, and that this cross-talk is essential for cytokinesis. Our results thus argue against the idea that cortical flows are a major determinant of contractile ring assembly. Instead, we propose that contractile ring assembly requires localized concerted action of motor-competent myosin and plastin at the cell equator.

Keywords: C. elegans; actomyosin contractility; contractile ring; cortical flows; cytokinesis; non-muscle myosin II; plastin/fimbrin.


Figures

FIGURE 1
FIGURE 1
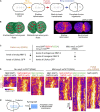
Perturbation of myosin motor activity or reduction of myosin levels lead to significantly reduced cortical F-actin flows. (A) Schematic of cytokinesis. Reference points used for measurements of ring assembly and furrow initiation intervals are indicated. Ring assembly: time interval between anaphase onset and the formation of a shallow equatorial deformation, when contractile ring components are being recruited to the cell equator. Furrow initiation: time interval between shallow deformation and the folding of the plasma membrane into a back-to-back configuration. Ring constriction: time interval between back-to-back membrane configuration and full furrow ingression. (B) Stills of cortical images of an embryo expressing LifeAct::GFP at shallow deformation and furrow initiation with a schematic illustrating the transition from unidirectional cortical flows during ring assembly to bidirectional flows starting at the onset of ring constriction. (C) Perturbations used and their effect on the levels of endogenous and transgenic NMY-2 and LifeAct::GFP relative to controls with no RNAi, as described in Osorio et al. (2019). (D) Kymographs of LifeAct::GFP cortical flows along the longitudinal axis in one-cell embryos for the conditions indicated in (C). Yellow and red bars correspond to ring assembly and furrow initiation time intervals, respectively. Curved arrows indicate posterior-anterior flow direction. (D’) Schematic illustrating the region of the embryo used for the kymographs in (D). Scale bar, 5 μm.
FIGURE 2
FIGURE 2
Contractile rings assemble and cytokinesis completes in a timely manner when long-range cortical actin flows are drastically reduced. (A) Schematic illustrating how cortical LifeAct::GFP flows were analyzed by particle image velocimetry (PIV; see more details in “Materials and Methods” section). (B,C) Longitudinal (X-component) flow velocity (mean ± SEM) over time in the anterior or posterior half of embryos. Curves were aligned to the time of shallow deformation. N is the number of embryos analyzed. Period of consistently strong, posterior-anterior directed flows is indicated in gray. (D,E) Longitudinal (X-component) velocity profiles of Lifeact::GFP cortical flows along anterior-posterior (A-P) axis averaged for a period of 50 seconds starting at shallow deformation. Flow profiles show mean X-component velocity ± SEM. N is the number of embryos analyzed. (F,G) The schematic on the left summarizes overall flow intensity and directionality (X-component). Ring assembly and furrow initiation time intervals (mean ± SD) are indicated. Statistical significance in (D), (E) was determined using two-way ANOVA for repeated measures, and in (F), (G) using one-way ANOVA followed by Bonferroni’s multiple comparison test; *P < 0.05, ****P < 0.0001, ns, not significant.
FIGURE 3
FIGURE 3
Cortical myosin turnover and flow-induced compression rates. (A) Schematic showing the photobleached region at the posterior pole of the embryo at shallow deformation (top left) and selected images from a time-lapse series showing NMY-2::GFP fluorescence over time pre- and post-bleaching. (A’) Quantification of NMY-2::GFP fluorescence recovery after photobleaching at the posterior pole. Data from individual embryos (light green) and the mean ± SD (dark green) are plotted. The black dashed line is the single exponential fitting curve from which the half time of recovery and myosin koff were extrapolated. (B) Average compression rate by flow calculated as the spatial derivative of the longitudinal flow profiles for each position along the anterior-posterior (A-P) axis of the embryo from 25 to 95 seconds after anaphase onset (AO). Compression is uniform in the equatorial region (15–25 μm). Colors represent different time intervals as indicated. (C) Average compression rate by flow over time after anaphase onset for the region of equatorial compression (15–25 μm). Data from individual embryos (gray) and the mean ± SD (black) are plotted. (D) Schematic showing the photobleached region just behind the tip of the ingressing furrow after back-to-back membrane configuration is achieved (top left) and selected images from a time-lapse series showing the NMY-2::GFP fluorescence over time pre- and post-bleaching. (E) Quantification of NMY-2::GFP fluorescence recovery after photobleaching in the ingressing furrow in control and NMY-2 depleted embryos. The mean ± SD is plotted. N is the number of embryos analyzed. Scale bars, 5 μm.
FIGURE 4
FIGURE 4
The F-actin crosslinker plastin cooperates with myosin to align F-actin bundles at the division plane. (A) Images of the cortical plane of embryos expressing LifeAct::GFP showing the evolution of the equatorial F-actin band relative to anaphase onset. Also see Supplementary Movie S1. (B) Deviation from vertical alignment of F-actin bundles at the equatorial cortex relative to anaphase onset (mean ± SEM). (C) Boxplots showing the dispersion of contractile ring assembly times. In each box, the central line is the median, the boundaries of the box are the 25th and 75th percentiles; the whiskers extend to include the maximum and minimum values. (D) Longitudinal (X-component) velocity profiles of Lifeact::GFP cortical flows along anterior-posterior (A-P) axis averaged for a period of 50 seconds starting at shallow deformation. Flow profiles show mean X-component velocity ± SEM. (E) Values on the left indicate percentage of embryos that completed cytokinesis successfully. On the right, a summary of F-actin bundle alignment at the equator and overall flow intensity and directionality (X-component). N is the number of embryos analyzed. Statistical significance of ring assembly times in (C) was determined using one-way ANOVA followed by Bonferroni’s multiple comparison test. ****P < 0.0001. Scale bar, 5 μm.
FIGURE 5
FIGURE 5
Model: the combined synergistic action of plastin and myosin aligns and compacts F-actin at the division plane independently of actomyosin cortical flows. (A) When both plastin and myosin accumulate at the equator, F-actin bundles are properly connected, and myosin is able to efficiently align and compact them into a circumferential array to maximize tension. Early actomyosin flows are unidirectional and long-ranged. (B) In the absence of plastin-mediated bundling, myosin struggles to align and compact F-actin bundles, initially spending energy on filament sorting instead of filament sliding. Cortical flows are reduced and erratic and cytokinesis completes with delays in F-actin alignment and contractile ring formation. (C) In the presence of plastin-mediated F-actin bundling and decreased myosin levels, F-actin bundles are connected to each other but tilt and struggle to orient along the division plane and to compact because of insufficient motor-activity. Cortical flows are severely reduced and erratic and cytokinesis completes with delays in F-actin alignment and contractile ring formation. (D) When both plastin-mediated bundling and myosin levels are decreased, equatorial actin filaments become unstable and start rotating and oscillating, adopting a quasi-horizontal orientation. Cortical flows are reduced and erratic, as in the individual plastin and myosin perturbations. F-actin bundles never align to form the contractile ring and cytokinesis fails.

Similar articles

Cited by

References

    1. Arnold J. M. (1969). Cleavage furrow formation in a telolecithal egg (Loligo Pealii): I. Filaments in early furrow formation. J. Cell Biol. 41 894–904. 10.1083/jcb.41.3.894 - DOI - PMC - PubMed
    1. Arribere J. A., Bell R. T., Fu B. X. H., Artiles K. L., Hartman P. S., Fire A. Z. (2014). Efficient marker-free recovery of custom genetic modifications with CRISPR/Cas9 in Caenorhabditis elegans. Genetics 198 837–846. 10.1534/genetics.114.169730 - DOI - PMC - PubMed
    1. Bement W. M., Benink H. A., Von Dassow G. (2005). A microtubule-dependent zone of active RhoA during cleavage plane specification. J. Cell Biol. 170 91–101. 10.1083/jcb.200501131 - DOI - PMC - PubMed
    1. Bernetti M., Masetti M., Rocchia W., Cavalli A. (2019). Kinetics of Drug Binding and Residence Time. Annu. Rev. Phys. Chem. 70 143–171. 10.1146/annurev-physchem-042018-052340 - DOI - PubMed
    1. Bretscher A. (1981). Fimbrin is a cytoskeletal protein that crosslinks F-actin in vitro. Proc. Natl. Acad. Sci. U.S.A. 78 6849–6853. 10.1073/pnas.78.11.6849 - DOI - PMC - PubMed