

Daily Fermented Whey Consumption Alters the Fecal Short-Chain Fatty Acid Profile in Healthy Adults
- PMID: 33102510
- PMCID: PMC7556162
- DOI: 10.3389/fnut.2020.00165
Daily Fermented Whey Consumption Alters the Fecal Short-Chain Fatty Acid Profile in Healthy Adults
Abstract
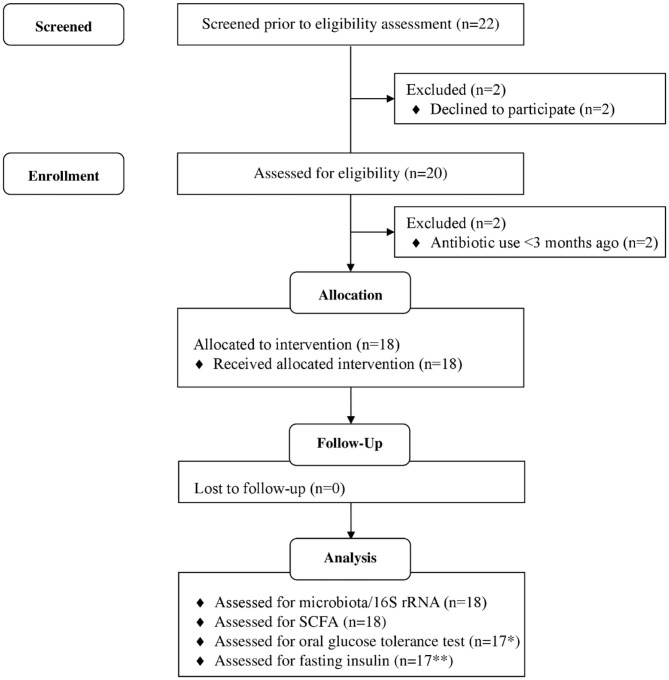
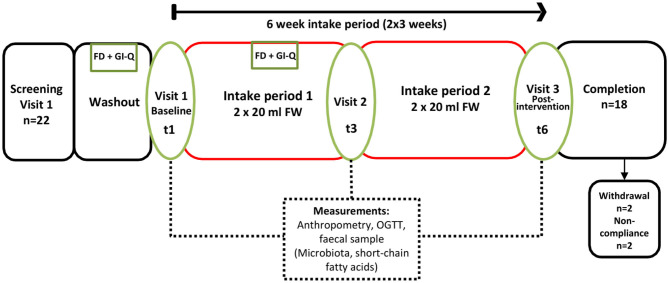
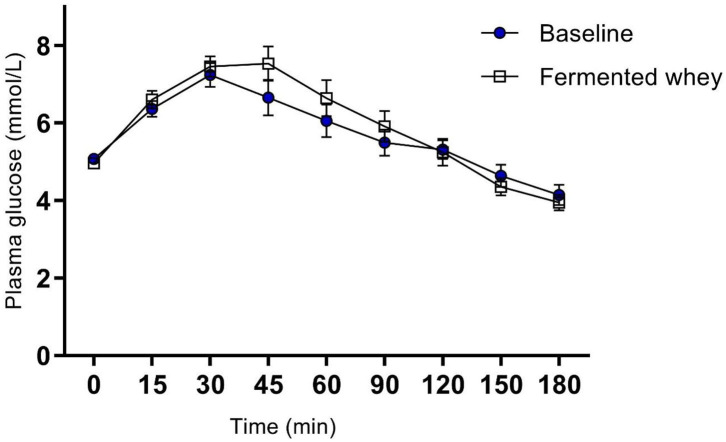
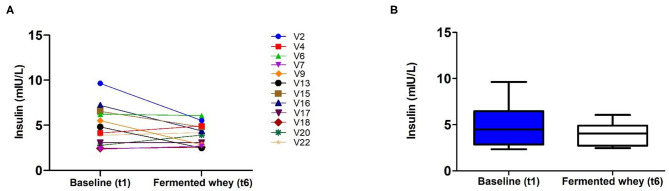
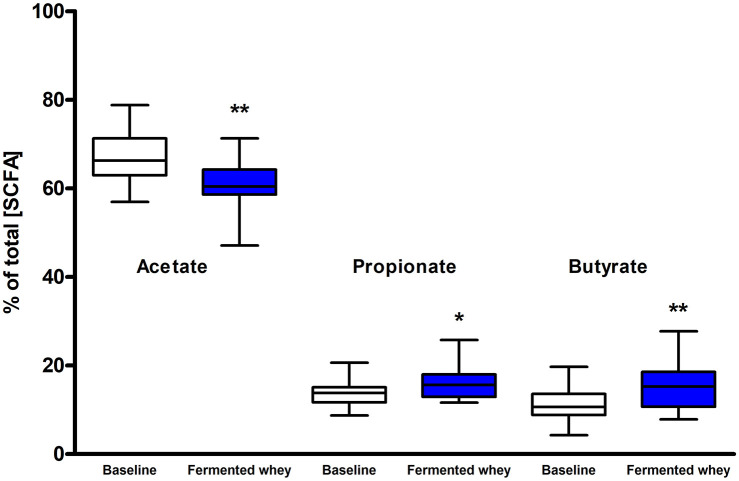
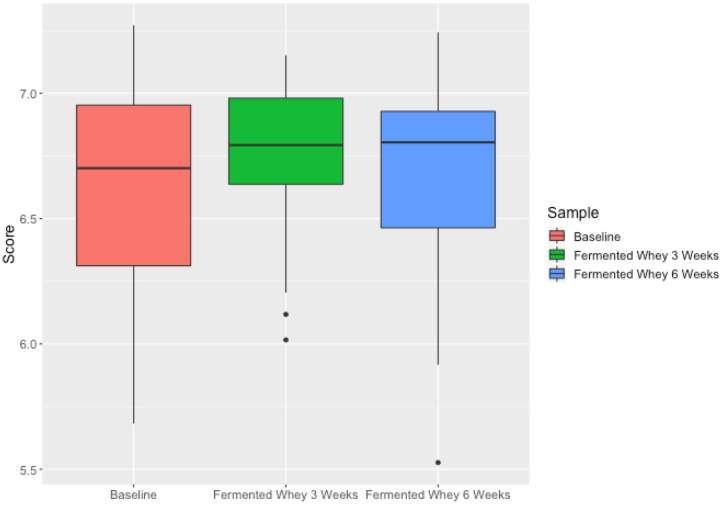
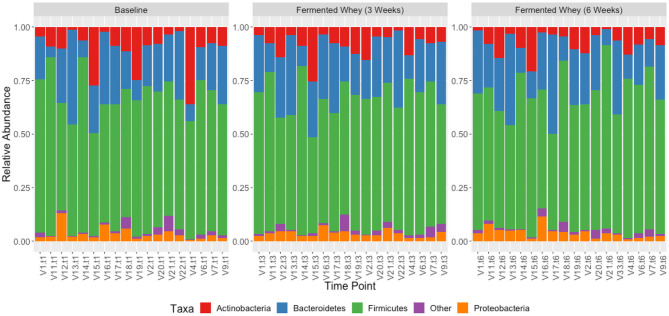
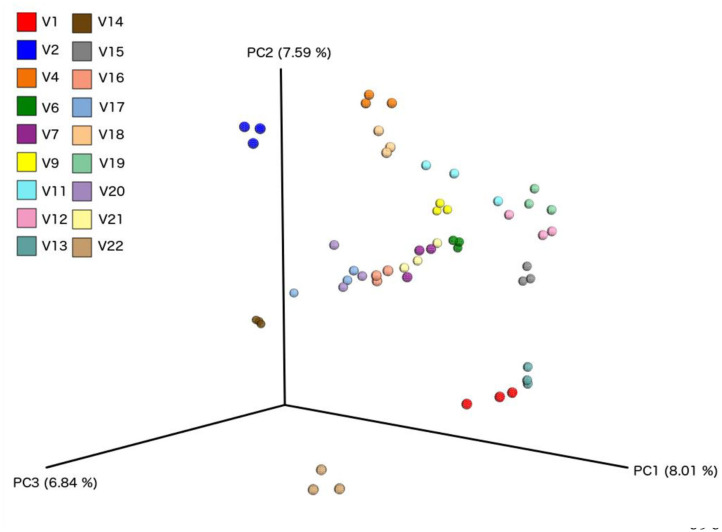
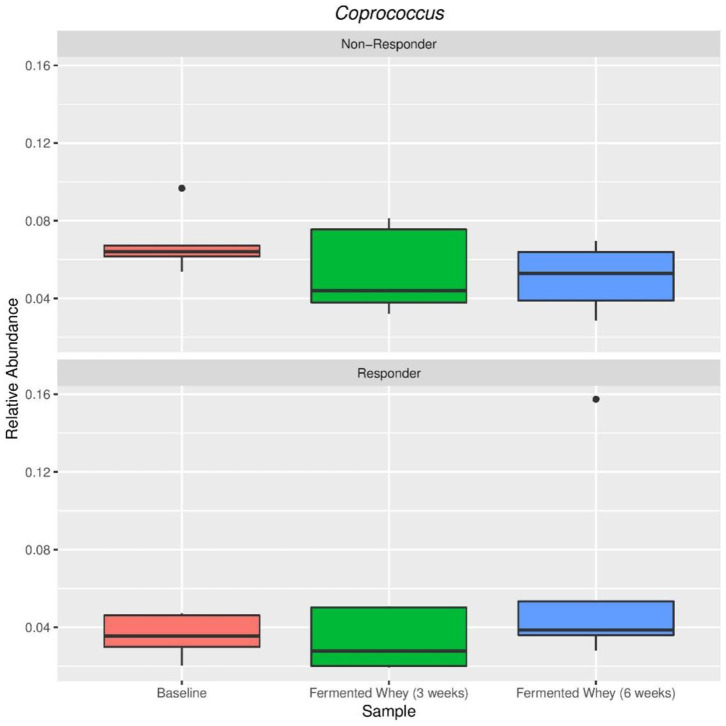
Gut microbiota influences many aspects of host health including immune, metabolic, and gut health. We examined the effect of a fermented whey concentrate (FWC) drink rich in L-(+)-Lactic acid, consumed daily, in 18 healthy men (n = 5) and women (n = 13) in free-living conditions. Objective: The aims of this 6-weeks pilot trial were to (i) identify changes in the gut microbiota composition and fecal short chain fatty acid (SCFA) profile, and (ii) to monitor changes in glucose homeostasis. Results: Total fecal SCFA (mM) concentration remained constant throughout the intervention. Proportionally, there was a significant change in the composition of different SCFAs compared to baseline. Acetate levels were significantly reduced (-6.5%; p < 0.01), coupled to a significant increase in the relative amounts of propionate (+2.2%; p < 0.01) and butyrate (+4.2%; p < 0.01), respectively. No changes in the relative abundance of any specific bacteria were detected. No significant changes were observed in glucose homeostasis in response to an oral glucose tolerance test. Conclusion: Daily consumption of a fermented whey product led to significant changes in fecal SCFA metabolite profile, indicating some potential prebiotic activity. These changes did not result in any detectable differences in microbiota composition. Post-hoc analysis indicated that baseline microbiota composition might be indicative of participants likely to see changes in SCFA levels. However, due to the lack of a control group these findings would need to be verified in a rigorously controlled trial. Future work is also required to identify the biological mechanisms underlying the observed changes in microbiota activity and to explore if these processes can be harnessed to favorably impact host health. Clinical Trial Registration: www.clinicaltrials.gov, identifier NCT03615339; retrospectively registered on 03/08/2018.
Keywords: dietary supplementation; fermented whey concentrate; microbiota; postbiotic; short chain fatty acids.
Copyright © 2020 Smith, Maloney, Shaw, Horgan, Fyfe, Martin, Suter, Scott and Johnstone.
Figures
Similar articles
-
Matrix Effects on the Delivery Efficacy of Bifidobacterium animalis subsp. lactis BB-12 on Fecal Microbiota, Gut Transit Time, and Short-Chain Fatty Acids in Healthy Young Adults.mSphere. 2021 Aug 25;6(4):e0008421. doi: 10.1128/mSphere.00084-21. Epub 2021 Jul 7. mSphere. 2021. PMID: 34232082 Free PMC article. Clinical Trial.
-
Associations of gut microbiota, dietary intake, and serum short-chain fatty acids with fecal short-chain fatty acids.Biosci Microbiota Food Health. 2020;39(1):11-17. doi: 10.12938/bmfh.19-010. Epub 2019 Oct 5. Biosci Microbiota Food Health. 2020. PMID: 32010539 Free PMC article.
-
Short-chain fatty acids: microbial metabolites that alleviate stress-induced brain-gut axis alterations.J Physiol. 2018 Oct;596(20):4923-4944. doi: 10.1113/JP276431. Epub 2018 Aug 28. J Physiol. 2018. PMID: 30066368 Free PMC article.
-
Short-Chain Fatty Acids-A Product of the Microbiome and Its Participation in Two-Way Communication on the Microbiome-Host Mammal Line.Curr Obes Rep. 2023 Jun;12(2):108-126. doi: 10.1007/s13679-023-00503-6. Epub 2023 May 19. Curr Obes Rep. 2023. PMID: 37208544 Free PMC article. Review.
-
Therapeutic Potential of Gut Microbiota and Its Metabolite Short-Chain Fatty Acids in Neonatal Necrotizing Enterocolitis.Life (Basel). 2023 Feb 16;13(2):561. doi: 10.3390/life13020561. Life (Basel). 2023. PMID: 36836917 Free PMC article. Review.
Cited by
-
The functionalities and applications of whey/whey protein in fermented foods: a review.Food Sci Biotechnol. 2023 Nov 25;33(4):769-790. doi: 10.1007/s10068-023-01460-5. eCollection 2024 Mar. Food Sci Biotechnol. 2023. PMID: 38371680 Free PMC article. Review.
-
Explorative Characterization of GI Complaints, General Physical and Mental Wellbeing, and Gut Microbiota in Trained Recreative and Competitive Athletes with or without Self-Reported Gastrointestinal Symptoms.Nutrients. 2024 May 30;16(11):1712. doi: 10.3390/nu16111712. Nutrients. 2024. PMID: 38892645 Free PMC article.
-
Putative Pathobionts in HLA-B27-Associated Spondyloarthropathy.Front Immunol. 2021 Jan 18;11:586494. doi: 10.3389/fimmu.2020.586494. eCollection 2020. Front Immunol. 2021. PMID: 33537028 Free PMC article. Review.
References
Associated data
LinkOut - more resources
Full Text Sources
Medical