

Investigating the Role of the N-Terminal Loop of PD-1 in Binding Process Between PD-1 and Nivolumab via Molecular Dynamics Simulation
- PMID: 33102523
- PMCID: PMC7522605
- DOI: 10.3389/fmolb.2020.574759
Investigating the Role of the N-Terminal Loop of PD-1 in Binding Process Between PD-1 and Nivolumab via Molecular Dynamics Simulation
Abstract
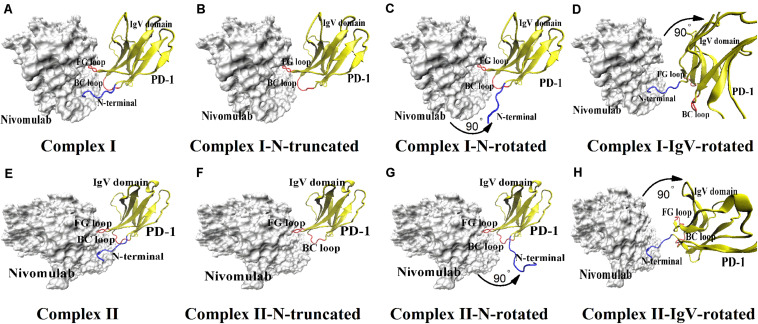
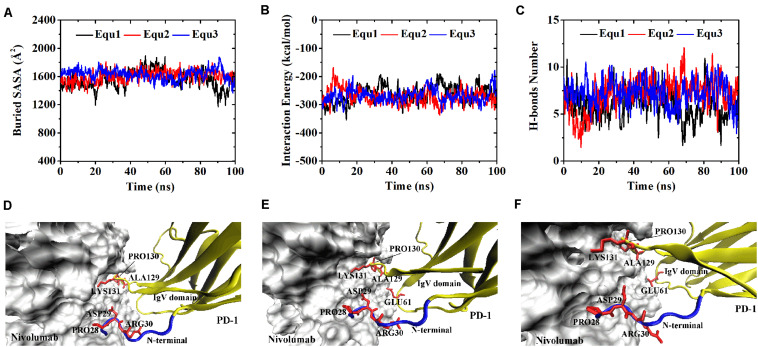
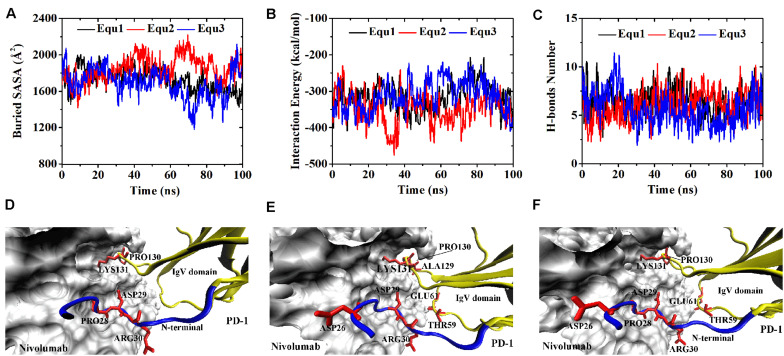
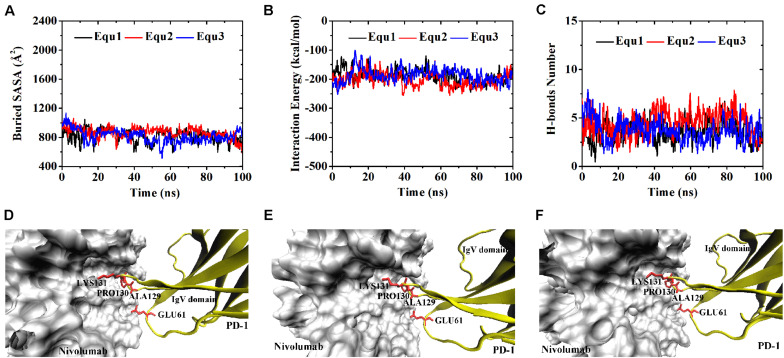
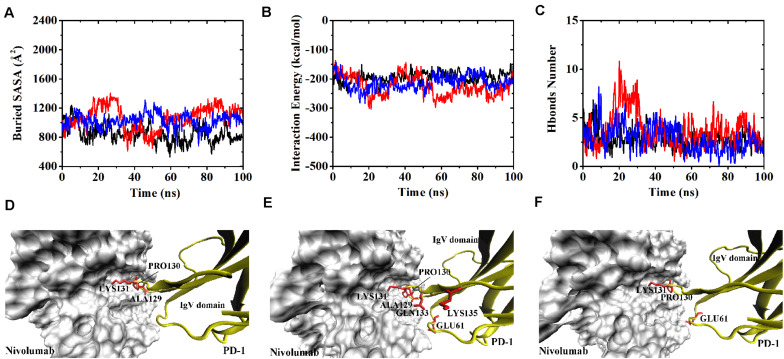
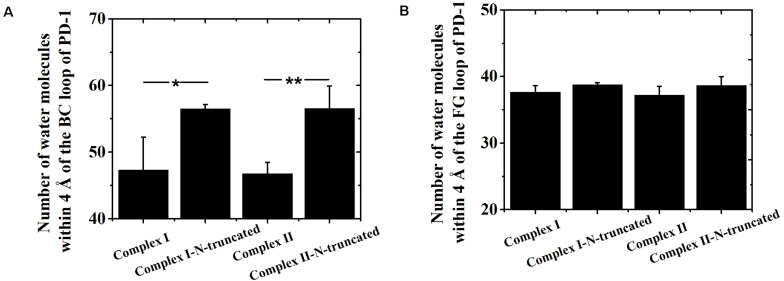
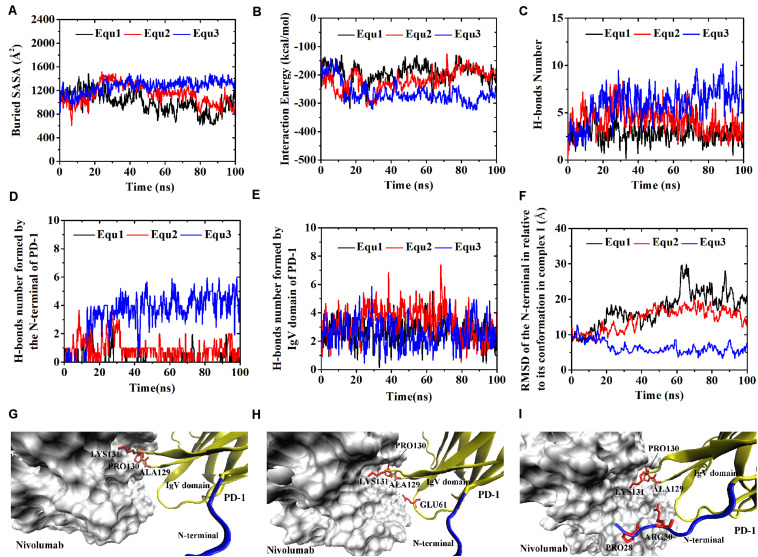
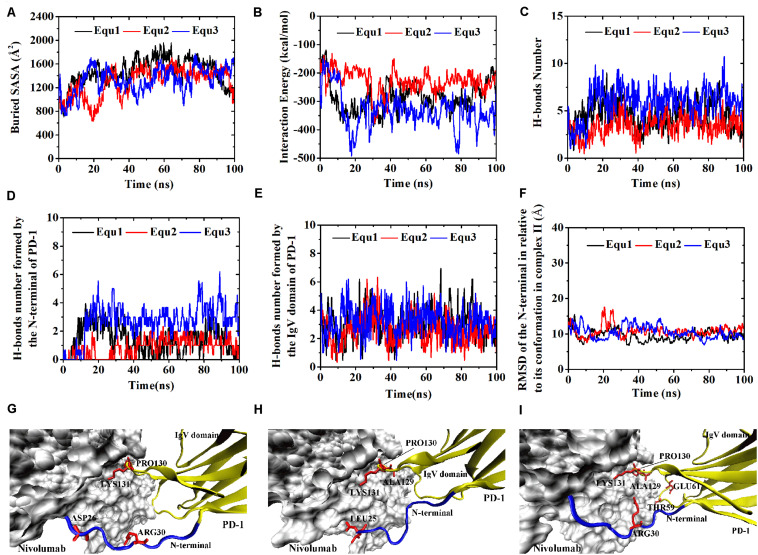
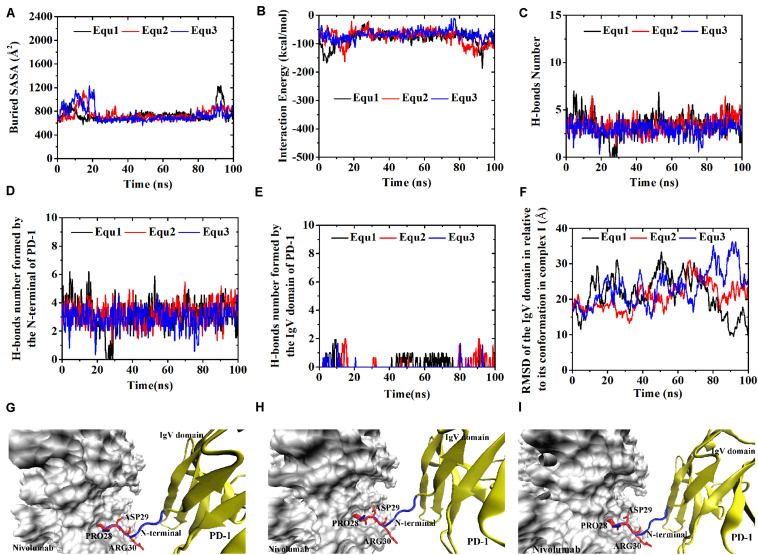
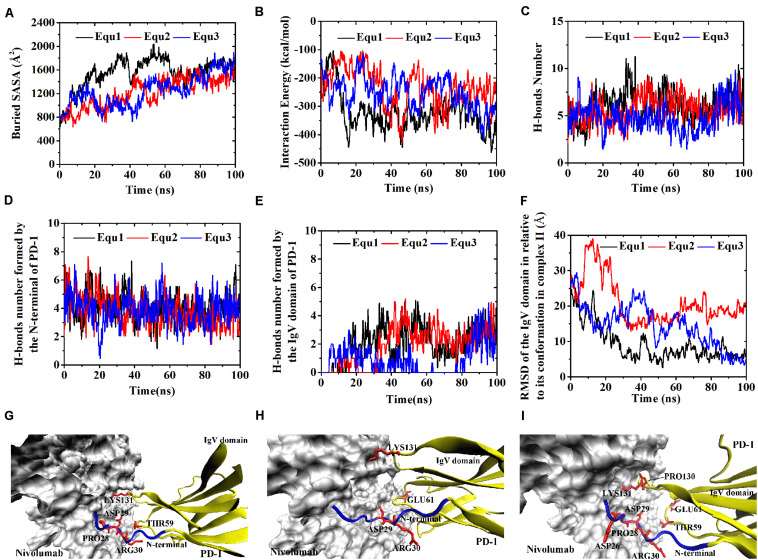
The blockade of immune checkpoints, such as programmed death receptor 1 (PD-1) and programmed death ligand 1 protein (PD-L1), is a promising therapeutic approach in cancer immunotherapy. Nivolumab, a humanized IgG4 antibody targeting PD-1, was approved by the US Food and Drug Administration for several cancers in 2014. Crystal structures of the nivolumab/PD-1 complex show that the epitope of PD-1 locates at the IgV domain (including the FG and BC loops) and the N-terminal loop. Although the N-terminal loop of PD-1 has been shown to play a dominant role in the complex interface of the static structure, its role in the dynamic binding process has not been illustrated clearly. Here, eight molecular systems were established for nivolumab/PD-1 complex, and long-time molecular dynamics simulations were performed for each. Results showed that the N-terminal loop of PD-1 prefers to bind with nivolumab to stabilize the interface between IgV and nivolumab. Furthermore, the binding of the N-terminal loop with nivolumab induces the rebinding between the IgV domain and nivolumab. Thus, we proposed a two-step binding model for the nivolumab/PD-1 binding, where the interface switches to a high-affinity state with the help of the N-terminal loop. This finding suggests that the N-terminal loop of PD-1 might be a potential target for anti-PD-1 antibody design, which could serve as an important gatekeeper for the anti-PD-1 antibody binding.
Keywords: N-terminal loop; PD-1; molecular dynamics simulation; nivolumab; two-step model.
Copyright © 2020 Liu, Jin, Chen, Zhang, Lai and Liu.
Figures

Similar articles
-
Molecular dynamics of the immune checkpoint programmed cell death protein I, PD-1: conformational changes of the BC-loop upon binding of the ligand PD-L1 and the monoclonal antibody nivolumab.BMC Bioinformatics. 2020 Dec 14;21(Suppl 17):557. doi: 10.1186/s12859-020-03904-9. BMC Bioinformatics. 2020. PMID: 33308148 Free PMC article.
-
An unexpected N-terminal loop in PD-1 dominates binding by nivolumab.Nat Commun. 2017 Feb 6;8:14369. doi: 10.1038/ncomms14369. Nat Commun. 2017. PMID: 28165004 Free PMC article.
-
Epitope and Paratope Mapping of PD-1/Nivolumab by Mass Spectrometry-Based Hydrogen-Deuterium Exchange, Cross-linking, and Molecular Docking.Anal Chem. 2020 Jul 7;92(13):9086-9094. doi: 10.1021/acs.analchem.0c01291. Epub 2020 Jun 10. Anal Chem. 2020. PMID: 32441507 Free PMC article.
-
The Next Immune-Checkpoint Inhibitors: PD-1/PD-L1 Blockade in Melanoma.Clin Ther. 2015 Apr 1;37(4):764-82. doi: 10.1016/j.clinthera.2015.02.018. Epub 2015 Mar 29. Clin Ther. 2015. PMID: 25823918 Free PMC article. Review.
-
Targeting the PD-1 pathway: a new hope for gastrointestinal cancers.Curr Med Res Opin. 2017 Apr;33(4):749-759. doi: 10.1080/03007995.2017.1279132. Epub 2017 Jan 31. Curr Med Res Opin. 2017. PMID: 28055269 Review.
Cited by
-
Comprehensive assessment of TECENTRIQ® and OPDIVO®: analyzing immunotherapy indications withdrawn in triple-negative breast cancer and hepatocellular carcinoma.Cancer Metastasis Rev. 2024 Sep;43(3):889-918. doi: 10.1007/s10555-024-10174-x. Epub 2024 Feb 27. Cancer Metastasis Rev. 2024. PMID: 38409546 Review.
-
Phenotypic and targeted drug discovery in immune therapeutics: challenges, opportunities, and future directions.RSC Adv. 2025 Aug 22;15(36):29937-29951. doi: 10.1039/d5ra03914b. eCollection 2025 Aug 18. RSC Adv. 2025. PMID: 40860061 Free PMC article. Review.
-
The miRNA and PD-1/PD-L1 signaling axis: an arsenal of immunotherapeutic targets against lung cancer.Cell Death Discov. 2024 Sep 29;10(1):414. doi: 10.1038/s41420-024-02182-1. Cell Death Discov. 2024. PMID: 39343796 Free PMC article. Review.
-
Risk predictive model based on three immune-related gene pairs to assess prognosis and therapeutic sensitivity for hepatocellular carcinoma.World J Surg Oncol. 2022 Aug 5;20(1):252. doi: 10.1186/s12957-022-02681-4. World J Surg Oncol. 2022. PMID: 35932027 Free PMC article.
-
Mapping the epitope of PD-L1 to the paratope of the antibody durvalumab using molecular dynamics simulation.Am J Transl Res. 2024 Jan 15;16(1):85-97. doi: 10.62347/ISDD4626. eCollection 2024. Am J Transl Res. 2024. PMID: 38322578 Free PMC article.
References
-
- Best R. B., Zhu X., Shim J., Lopes P. E., Mittal J., Feig M., et al. (2012). Optimization of the additive CHARMM all-atom protein force field targeting improved sampling of the backbone phi, psi and side-chain chi(1) and chi(2) dihedral angles. J. Chem. Theory Comput. 8 3257–3273. 10.1021/ct300400x - DOI - PMC - PubMed
LinkOut - more resources
Full Text Sources
Research Materials