

Effects of High-Fat Diet at Two Energetic Levels on Fecal Microbiota, Colonic Barrier, and Metabolic Parameters in Dogs
- PMID: 33102570
- PMCID: PMC7545960
- DOI: 10.3389/fvets.2020.566282
Effects of High-Fat Diet at Two Energetic Levels on Fecal Microbiota, Colonic Barrier, and Metabolic Parameters in Dogs
Abstract
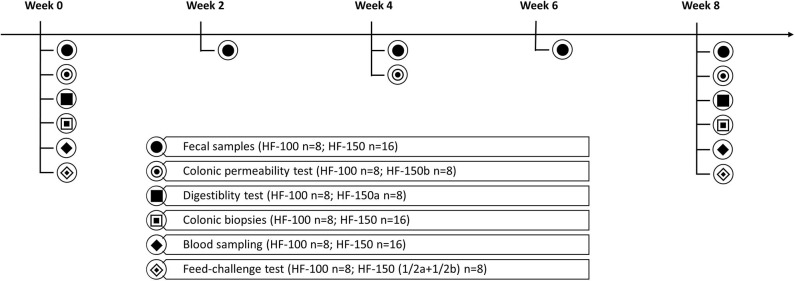
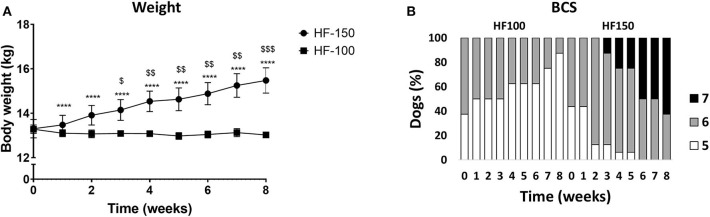
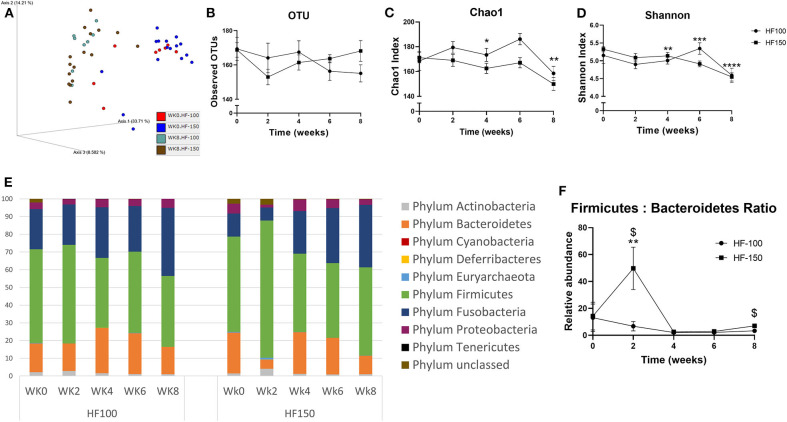
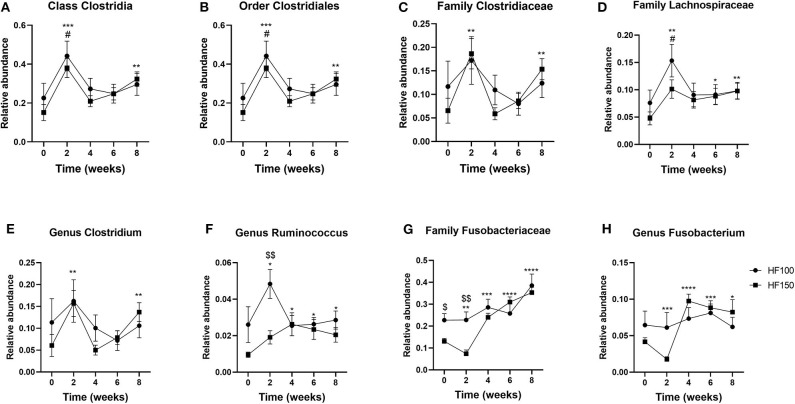
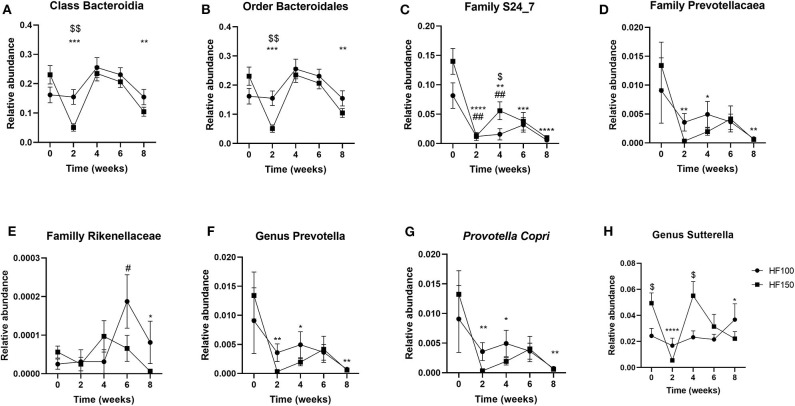
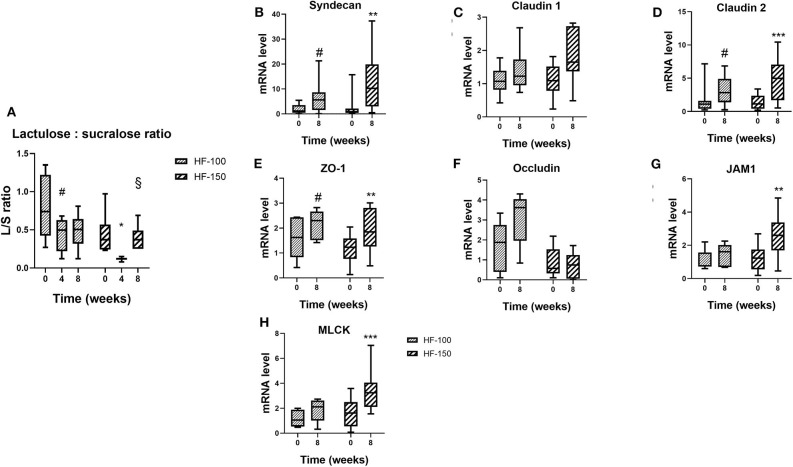
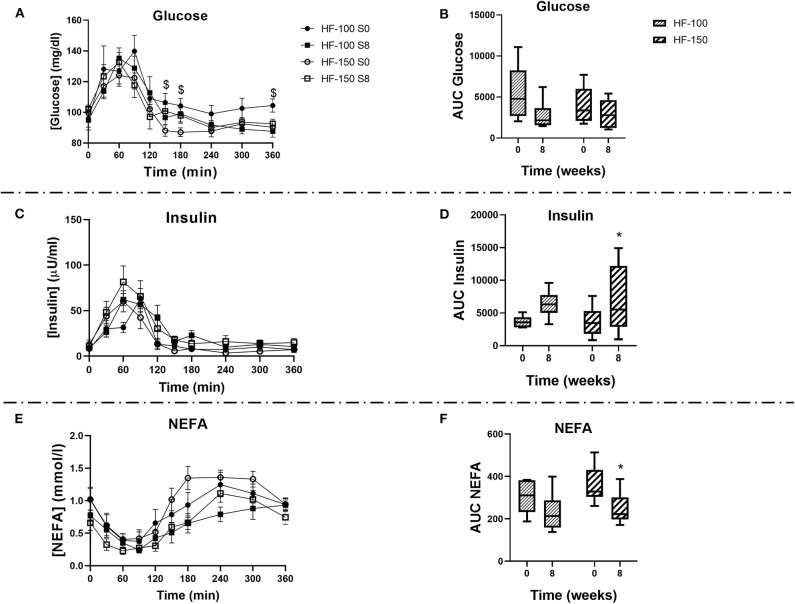
Increased consumption of energy-rich foods is a key factor in overweight, obesity, and associated metabolic disorders. This would be, at least in part, related to microbiota disturbance. In rodent models of obesity, microbiota disruption has been associated with alteration of the intestinal barrier, endotoxemia, inflammation grade, and insulin sensitivity. The aim of the present study was to assess the effects of a high-fat diet (HFD), fed at two energetic levels, on microbiota, intestinal barrier, and inflammatory and metabolic parameters in dogs. A HFD (33% fat as fed, 4,830 kcal/kg) was given to 24 healthy Beagle dogs at 100% (HF-100; n = 8) and at 150% (HF-150; n = 16) of their maintenance energy requirements for 8 weeks. Analysis of similarity revealed a significant difference in gut microbiota β-diversity following the diet compared to week 0 in both groups while α-diversity was lower only in the HF-150 group. Firmicutes/Bacteroidetes ratio was higher in the HF-150 group compared to the HF-100 group at weeks 2 and 8. A reduction in insulin sensitivity was observed over time in the HF150 group. Neither endotoxemia nor inflammation was observed in either group, did not find supporting data for the hypothesis that the microbiota is involved in the decline of insulin sensitivity through metabolic endotoxemia and low-grade inflammation. Colonic permeability was increased at week 4 in both groups and returned to initial levels at week 8, and was associated with modifications to the expression of genes involved in colonic barrier function. The increase in intestinal permeability may have been caused by the altered intestinal microbiota and increased expression of genes encoding tight junction proteins might indicate a compensatory mechanism to restore normal permeability. Although simultaneous changes to the microbiota, barrier permeability, inflammatory, and metabolic status have not been observed, such a causal link cannot be excluded in dogs overfed on a HFD. Further studies are necessary to better understand the link between HFD, intestinal microbiota and the host.
Keywords: colonic barrier; dog; high-fat diet (HFD); insulin sensitivity; microbiota (microorganism).
Copyright © 2020 Moinard, Payen, Ouguerram, André, Hernandez, Drut, Biourge, Suchodolski, Flanagan, Nguyen and Leray.
Figures
Similar articles
-
Apple-Derived Pectin Modulates Gut Microbiota, Improves Gut Barrier Function, and Attenuates Metabolic Endotoxemia in Rats with Diet-Induced Obesity.Nutrients. 2016 Feb 29;8(3):126. doi: 10.3390/nu8030126. Nutrients. 2016. PMID: 26938554 Free PMC article.
-
Antrodia cinnamomea reduces obesity and modulates the gut microbiota in high-fat diet-fed mice.Int J Obes (Lond). 2018 Feb;42(2):231-243. doi: 10.1038/ijo.2017.149. Epub 2017 Jun 20. Int J Obes (Lond). 2018. PMID: 28630461 Free PMC article.
-
High-fat diet intake modulates maternal intestinal adaptations to pregnancy and results in placental hypoxia, as well as altered fetal gut barrier proteins and immune markers.J Physiol. 2019 Jun;597(12):3029-3051. doi: 10.1113/JP277353. Epub 2019 May 13. J Physiol. 2019. PMID: 31081119
-
Potential mechanisms for the emerging link between obesity and increased intestinal permeability.Nutr Res. 2012 Sep;32(9):637-47. doi: 10.1016/j.nutres.2012.07.003. Epub 2012 Sep 7. Nutr Res. 2012. PMID: 23084636 Review.
-
Impact of high-fat diet on the intestinal microbiota and small intestinal physiology before and after the onset of obesity.Biochimie. 2017 Oct;141:97-106. doi: 10.1016/j.biochi.2017.05.019. Epub 2017 May 29. Biochimie. 2017. PMID: 28571979 Review.
Cited by
-
Effects of Stocking Density on Fatty Acid Metabolism by Skeletal Muscle in Mice.Animals (Basel). 2022 Sep 22;12(19):2538. doi: 10.3390/ani12192538. Animals (Basel). 2022. PMID: 36230279 Free PMC article.
-
Microbiome Responses to Oral Fecal Microbiota Transplantation in a Cohort of Domestic Dogs.Vet Sci. 2024 Jan 19;11(1):42. doi: 10.3390/vetsci11010042. Vet Sci. 2024. PMID: 38275924 Free PMC article.
-
High-fat diet enhances cell proliferation and compromises intestinal permeability in a translational canine intestinal organoid model.BMC Mol Cell Biol. 2024 Apr 30;25(1):14. doi: 10.1186/s12860-024-00512-w. BMC Mol Cell Biol. 2024. PMID: 38689222 Free PMC article.
-
Decoding the Gut Microbiome in Companion Animals: Impacts and Innovations.Microorganisms. 2024 Sep 4;12(9):1831. doi: 10.3390/microorganisms12091831. Microorganisms. 2024. PMID: 39338505 Free PMC article. Review.
-
Effects of a Western Diet on Colonic Dysbiosis, Bile Acid Dysmetabolism and Intestinal Inflammation in Clinically Healthy Dogs.J Vet Intern Med. 2025 Mar-Apr;39(2):e70035. doi: 10.1111/jvim.70035. J Vet Intern Med. 2025. PMID: 40110597 Free PMC article.
References
LinkOut - more resources
Full Text Sources
Research Materials
Miscellaneous