. 2020 Oct 9:2020:7653506.
doi: 10.1155/2020/7653506. eCollection 2020.

Screening and Functional Prediction of Key Candidate Genes in Hepatitis B Virus-Associated Hepatocellular Carcinoma

Affiliations

Screening and Functional Prediction of Key Candidate Genes in Hepatitis B Virus-Associated Hepatocellular Carcinoma

Xia Chen et al. Biomed Res Int. .

Abstract

Background: The molecular mechanism by which hepatitis B virus (HBV) induces hepatocellular carcinoma (HCC) is still unknown. The genomic expression profile and bioinformatics methods were used to investigate the potential pathogenesis and therapeutic targets for HBV-associated HCC (HBV-HCC).

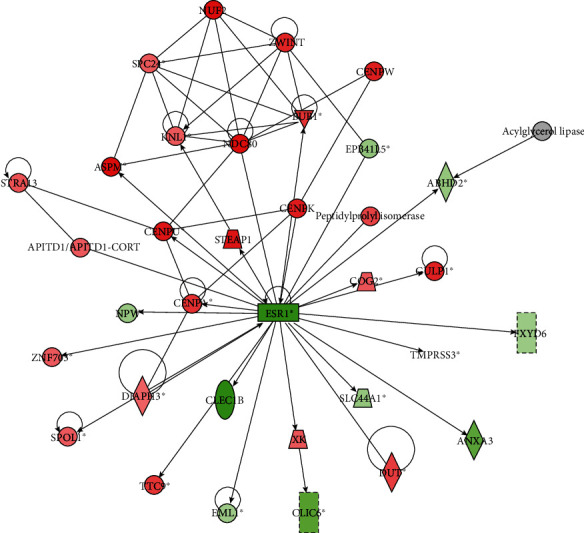
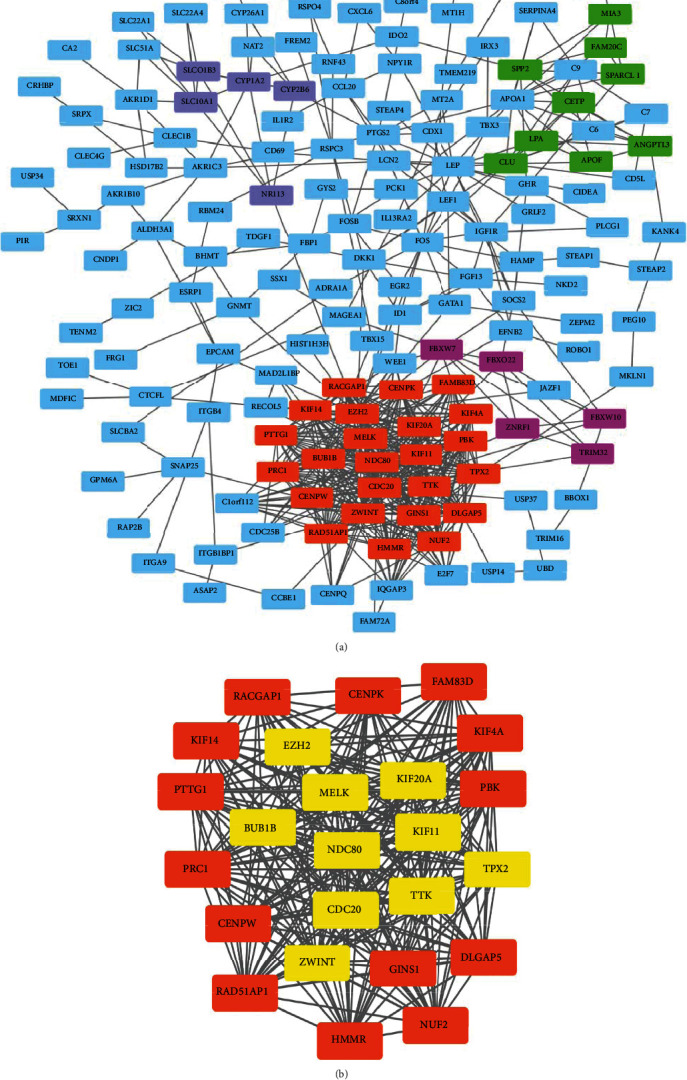
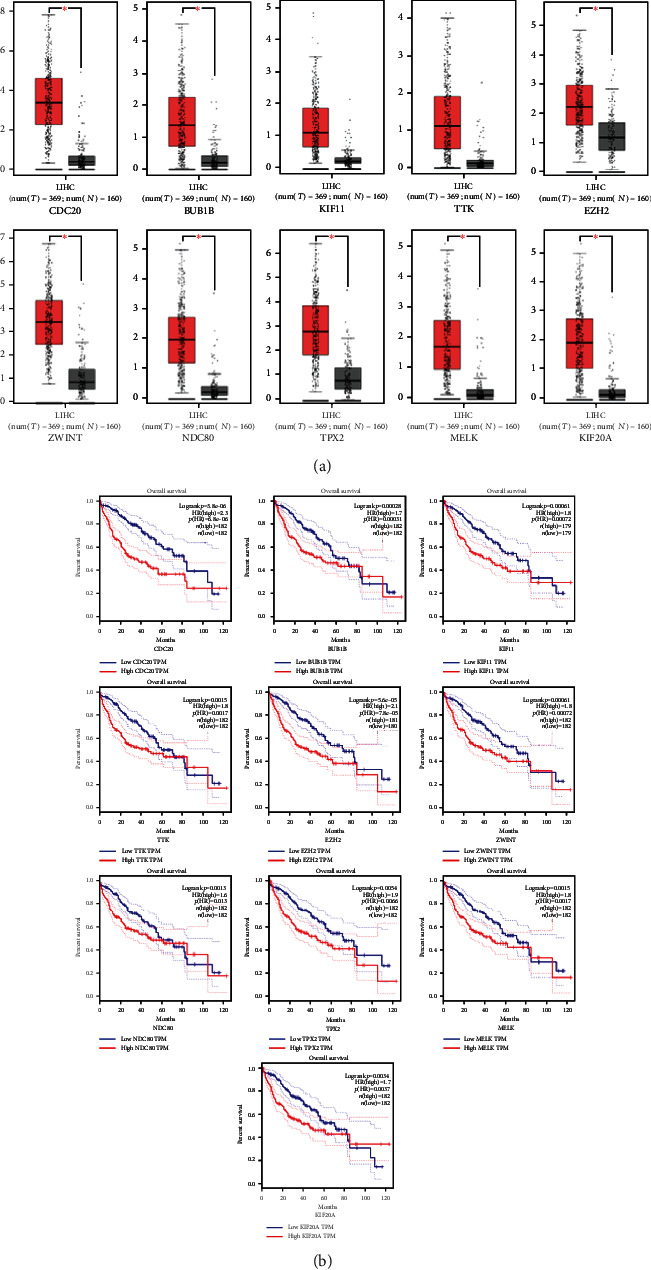
Methods: The microarray dataset GSE55092 was downloaded from the Gene Expression Omnibus (GEO) database. The data was analyzed by the bioinformatics software to find differentially expressed genes (DEGs). Gene Ontology (GO) enrichment analysis, Kyoto Encyclopedia of Genes and Genomes (KEGG) pathway analysis, ingenuity pathway analysis (IPA), and protein-protein interaction (PPI) network analysis were then performed on DEGs. The hub genes were identified using Centiscape2.2 and Molecular Complex Detection (MCODE) in the Cytoscape software (Cytoscape_v3.7.2). The survival data of these hub genes was downloaded from the Gene Expression Profiling Interactive Analysis (GEPIA).

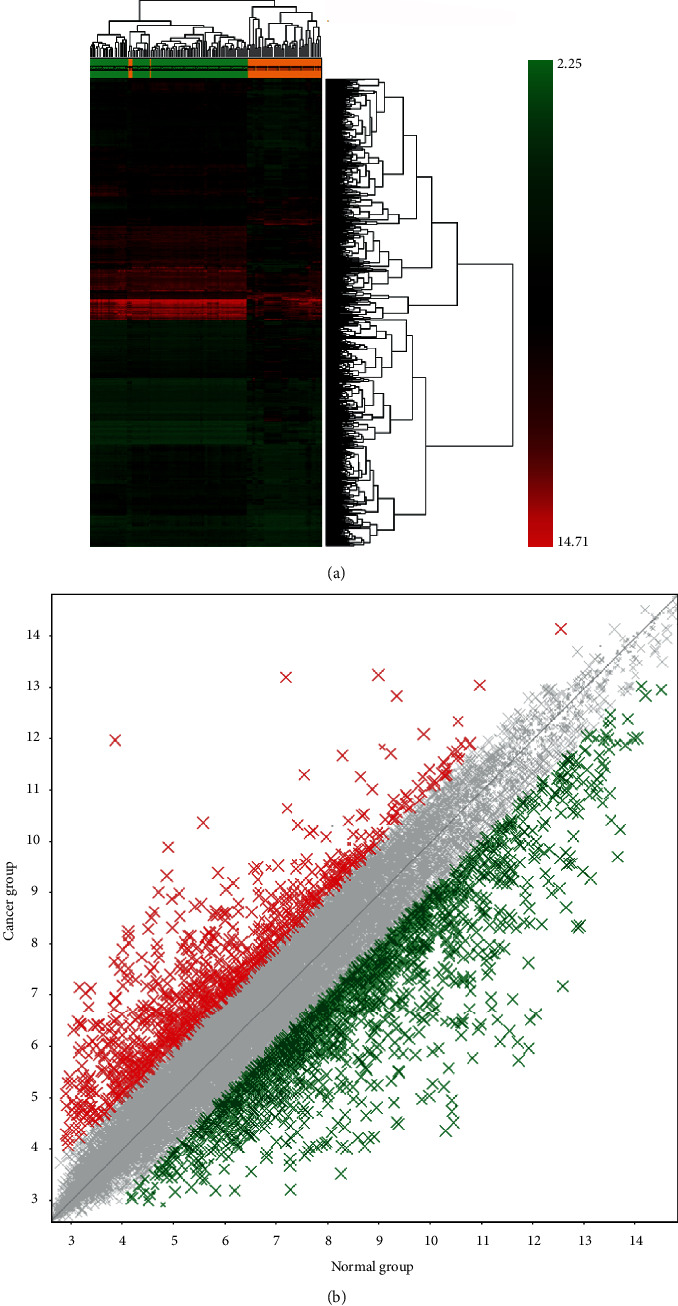
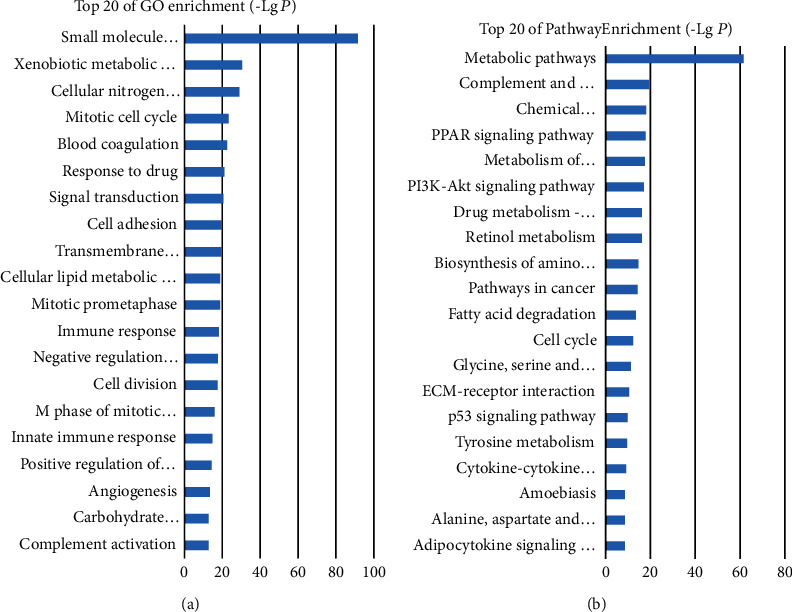
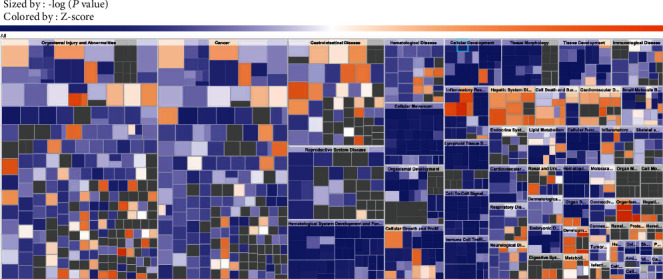
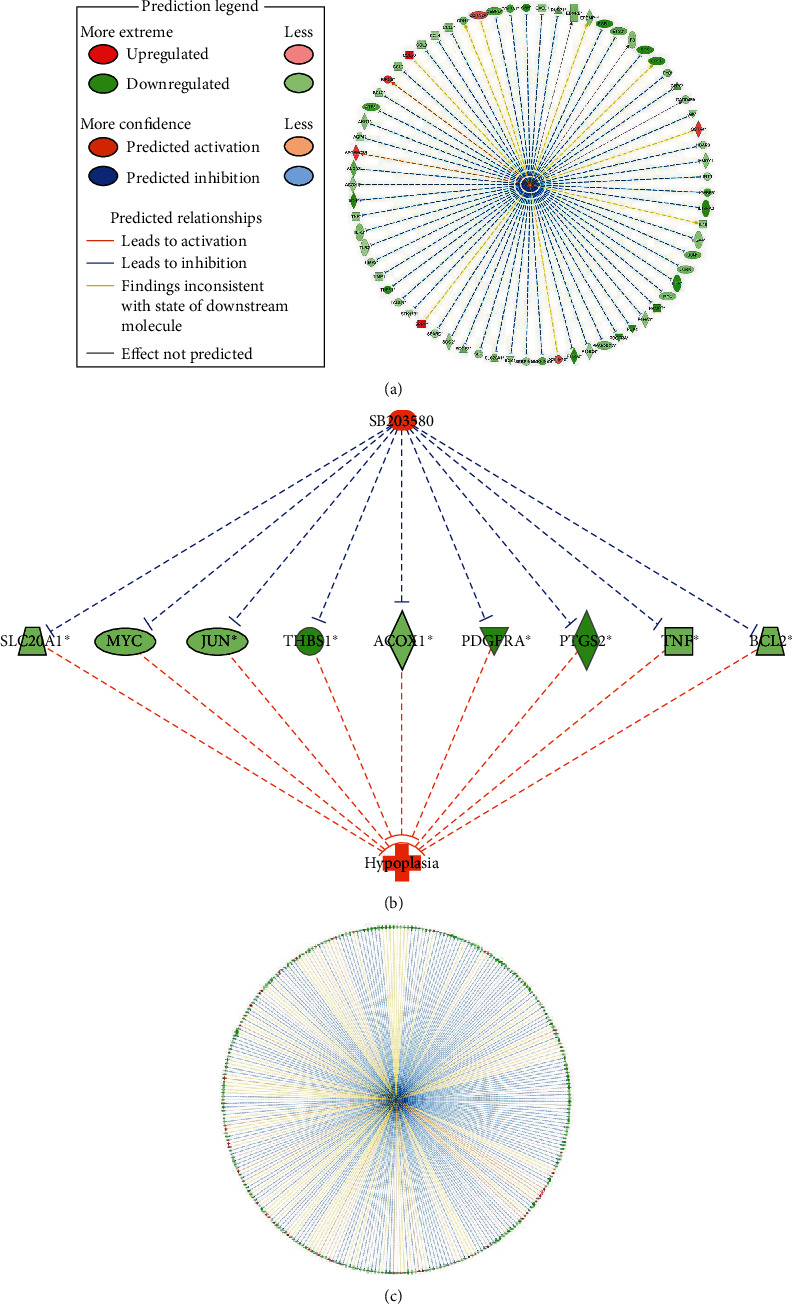
Results: A total of 2264 mRNA transcripts were differentially expressed, including 764 upregulated and 1500 downregulated in tumor tissues. GO analysis revealed that these DEGs were related to the small-molecule metabolic process, xenobiotic metabolic process, and cellular nitrogen compound metabolic process. KEGG pathway analysis revealed that metabolic pathways, complement and coagulation cascades, and chemical carcinogenesis were involved. Diseases and biofunctions showed that DEGs were mainly associated with the following diseases or biological function abnormalities: cancer, organismal injury and abnormalities, gastrointestinal disease, and hepatic system disease. The top 10 upstream regulators were predicted to be activated or inhibited by Z-score and identified 25 networks. The 10 genes with the highest degree of connectivity were defined as the hub genes. Cox regression revealed that all the 10 genes (CDC20, BUB1B, KIF11, TTK, EZH2, ZWINT, NDC80, TPX2, MELK, and KIF20A) were related to the overall survival.

Conclusion: Our study provided a registry of genes that play important roles in regulating the development of HBV-HCC, assisting us in understanding the molecular mechanisms that underlie the carcinogenesis and progression of HCC.


Conflict of interest statement

The authors declare that they have no competing interests.

Figures

Figure 1
Figure 1
Identification of aberrantly expressed mRNAs. (a) Heat map of differentially expressed mRNA. (b) The scatter plot of differentially expressed mRNA. Red color represents upregulation of differential genes, while green color represents downregulation of differential genes. P < 0.05 and ∣logFC | >2 were chosen as the cutoff criteria.
Figure 2
Figure 2
Functional annotation of DEGs by DAVID. (a) The top 20 GO terms related to mRNA dysregulation. (b) The top 20 of KEGG pathway of DEGs in HBV-HCC. The value of -LgP indicates the significance of the GO and KEGG signaling pathway. Differences were considered statistically significant at P < 0.05.
Figure 3
Figure 3
Diseases and biofunctions. In the hierarchical clustering of heat map, each individual colored rectangle is a particular biological function or disease. The patch size is determined by P value. The smaller the P value, the larger the patch is. The plaque color is determined by Z-score; the Z‐score > 2 and <-2 is considered meaningful. Blue color indicates suppressed disease or biological function, and orange indicates that the disease or biological function is activated. Grey indicates that the Z-score for the biological function or disease is unknown.
Figure 4
Figure 4
Upstream regulator analysis of differentially expressed genes in HBV-HCC. (a) The relevant network of SB203580. (b) SB203580 regulates network molecules related to hypoplasia. (c) The relevant network of lipopolysaccharide.
Figure 5
Figure 5
Top network identified by ingenuity pathway analysis. The top network is called “Cell Cycle, Cellular Assembly and Organization, DNA Replication, Recombination, and Repair”. Red represents the upregulation of genes, and green represents the downregulation of genes.
Figure 6
Figure 6
PPI network and module analysis. (a) PPI network of the most significant DEGs identified from GSE55092 was constructed. Four subnetworks were identified by Cytoscape MCODE. Genes in different subnetworks are shown in different colors, and blue nodes indicate other genes. (b) One most important module subnetwork was identified by Cytoscape MCODE. Yellow represents the hub genes.
Figure 7
Figure 7
Validation of hub genes in the TCGA dataset. (a) CDC20, BUB1B, KIF11, TTK, EZH2, ZWINT, NDC80, TPX2, MELK, and KIF20A expressions in 369 LIHC patients compared with 160 normal samples. (b) Overall survival curves of CDC20, BUB1B, KIF11, TTK, EZH2, ZWINT, NDC80, TPX2, MELK, and KIF20A.

Similar articles

Cited by

References

    1. Ayoub W. S., Steggerda J., Yang J. D., Kuo A., Sundaram V., Lu S. C. Current status of hepatocellular carcinoma detection: screening strategies and novel biomarkers. Therapeutic Advances in Medical Oncology. 2019;11 doi: 10.1177/1758835919869120. - DOI - PMC - PubMed
    1. Farazi P. A., DePinho R. A. Hepatocellular carcinoma pathogenesis: from genes to environment. Nature Reviews Cancer. 2006;6(9):674–687. doi: 10.1038/nrc1934. - DOI - PubMed
    1. El J. T., Lagana S. M., Lee H. Update on hepatocellular carcinoma: pathologists' review. World Journal of Gastroenterology. 2019;25(14):1653–1665. - PMC - PubMed
    1. Brito A. F., Abrantes A. M., Tralhão J. G., Botelho M. F. Targeting hepatocellular carcinoma: what did we discover so far? Oncology reviews. 2016;10(2) doi: 10.4081/oncol.2016.302. - DOI - PMC - PubMed
    1. El-Serag H. B. Epidemiology of viral hepatitis and hepatocellular carcinoma. Gastroenterology. 2012;142(6):1264–1273.e1. doi: 10.1053/j.gastro.2011.12.061. - DOI - PMC - PubMed

MeSH terms