. 2020 Sep 16:19:79-92.
doi: 10.1016/j.omto.2020.09.004. eCollection 2020 Dec 16.

A New Tool for CRISPR-Cas13a-Based Cancer Gene Therapy

Affiliations

A New Tool for CRISPR-Cas13a-Based Cancer Gene Therapy

Jinliang Gao et al. Mol Ther Oncolytics. .

Erratum in

Abstract

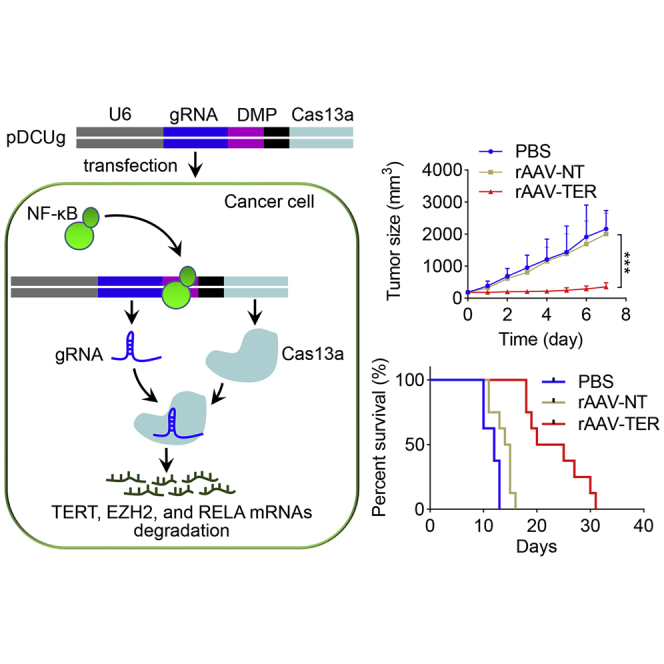
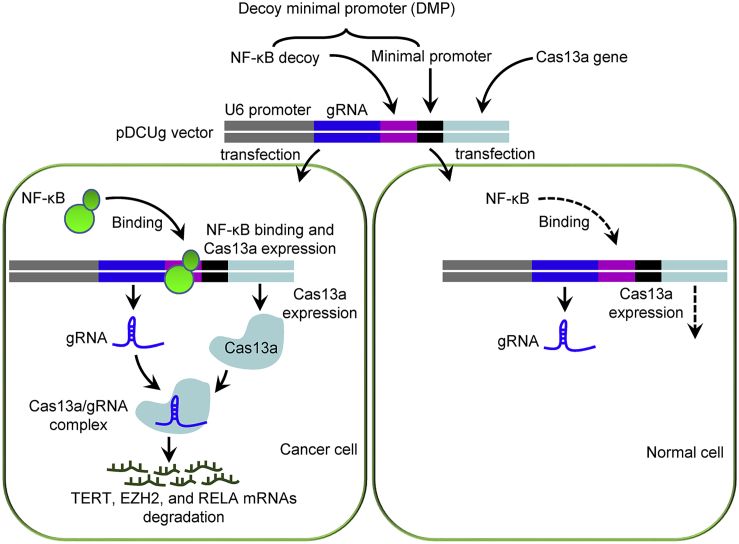
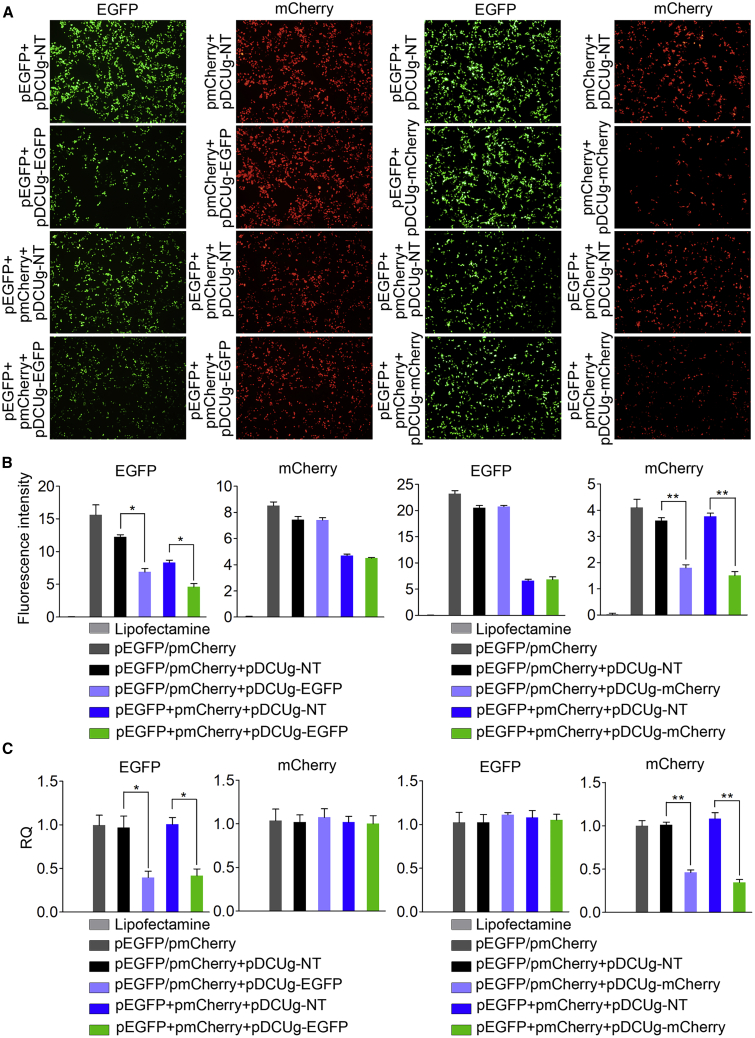
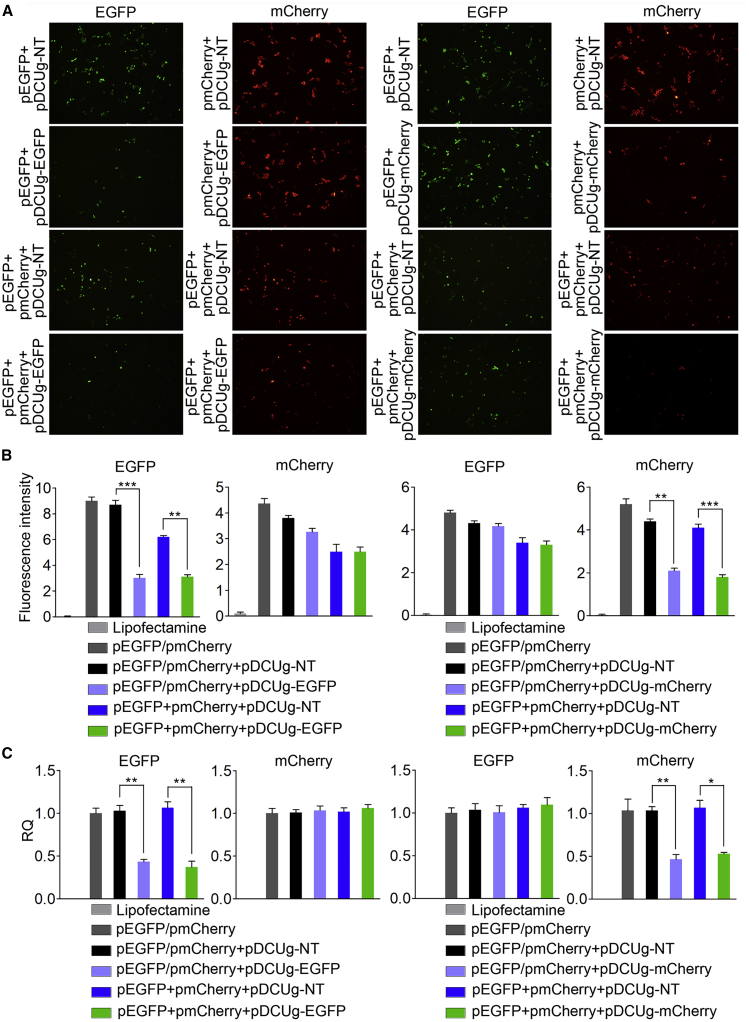
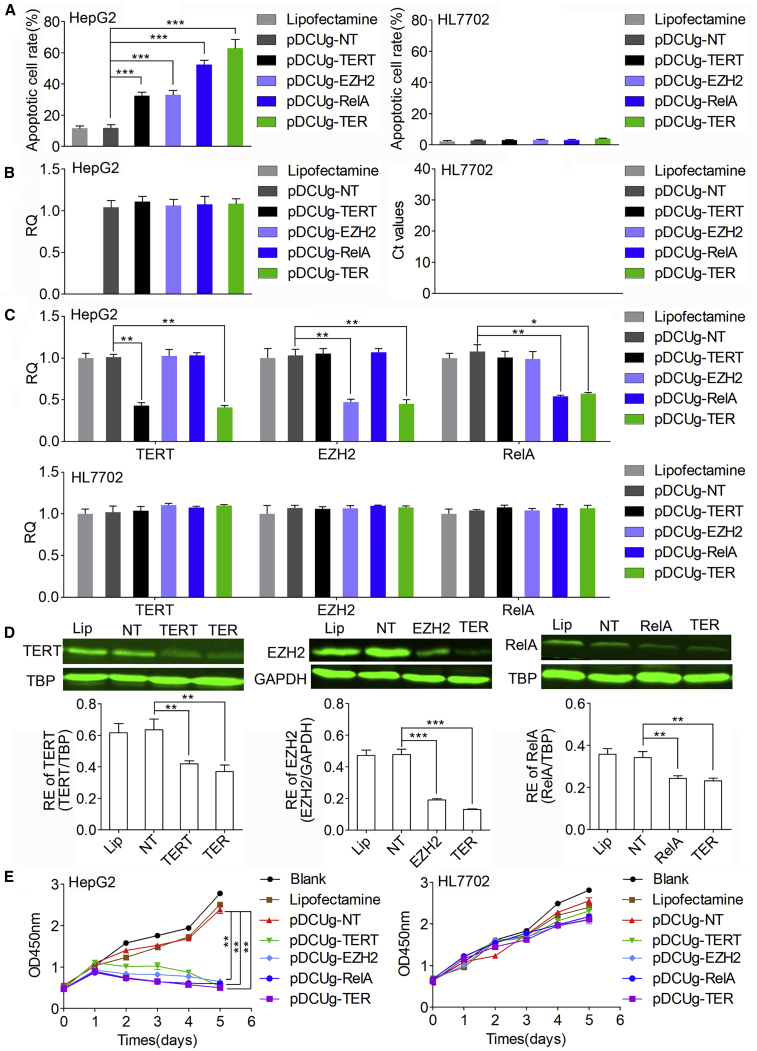
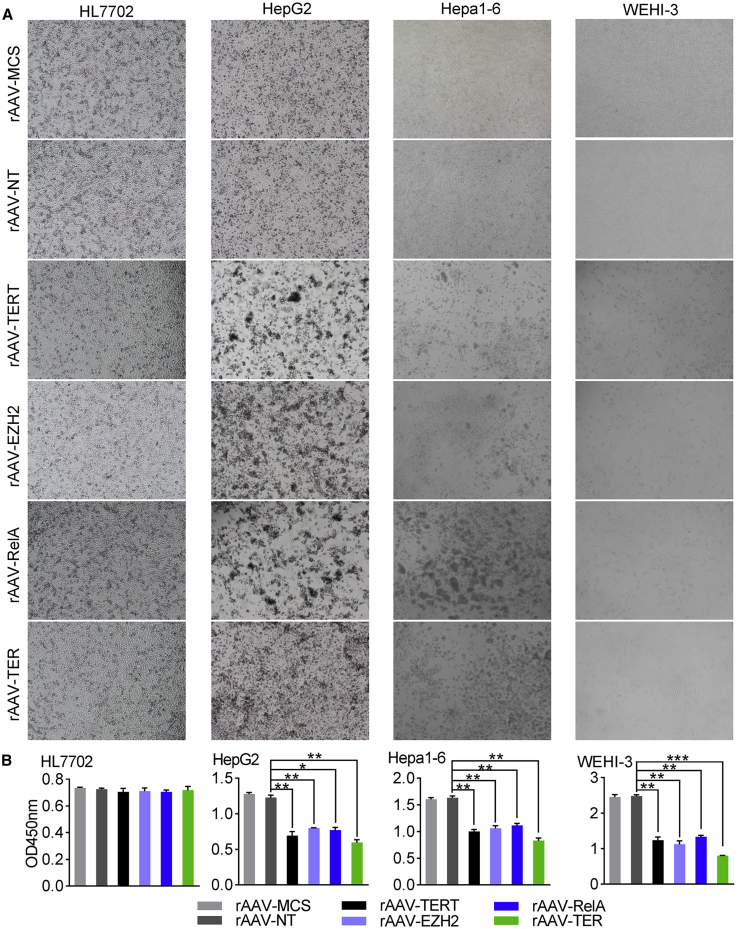
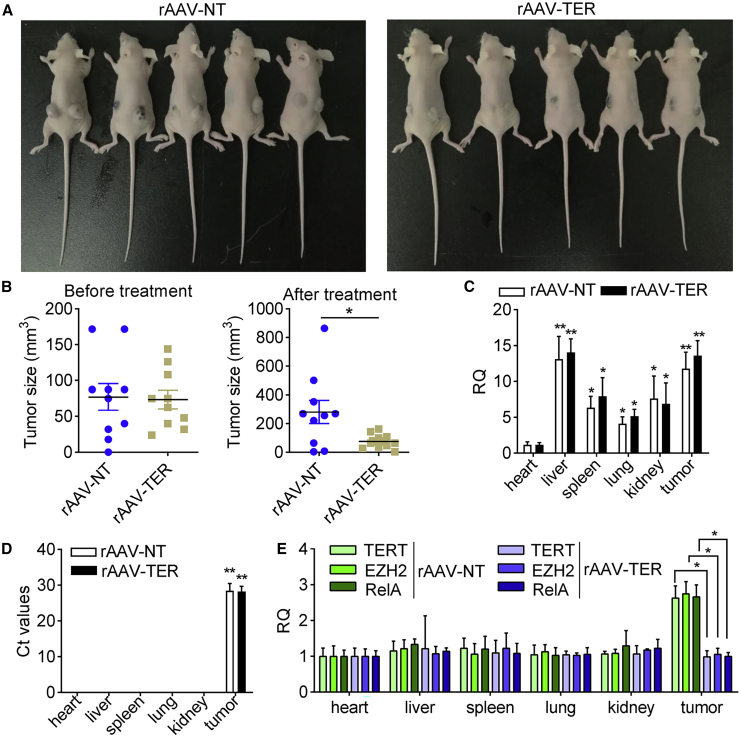
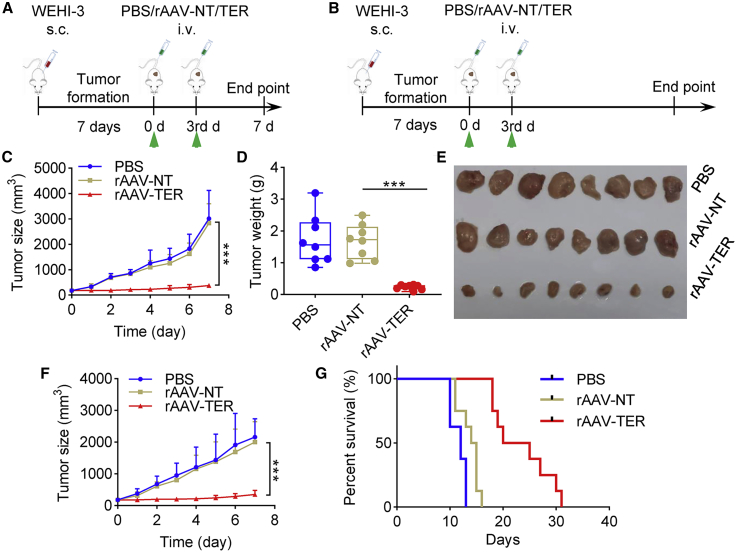
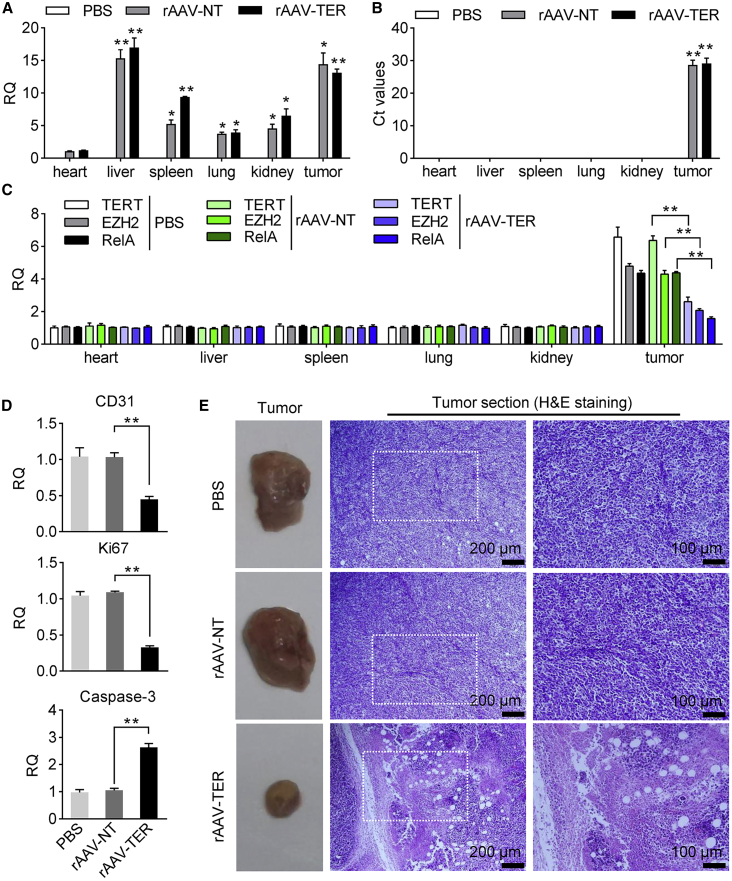
Cas13a has already been successfully applied to virus detection. However, as a new gene interference tool, its potential in cancer treatment was not fully explored until now. This study constructed a new Cas13a expression vector, decoy minimal promoter-Cas13a-U6-guide RNA (DMP-Cas13a-U6-gRNA [DCUg]), by controlling the Cas13a and gRNA expression with a nuclear factor κB (NF-κB)-specific promoter and U6 promoter, respectively. DCUg could specifically and effectively knock down the expression of reporter genes in the 293T and HepG2 cells. DCUg could also similarly knock down the expression of endogenous oncogenes (TERT, EZH2, and RelA) at both mRNA and protein levels in a human hepatoma cell HepG2, which led to significant apoptosis and growth inhibition. In contrast, the same transfection did not affect the target gene expression, cell apoptosis, and growth of a human normal liver cell HL7702. Finally, DCUg targeting these oncogenes was packaged into adeno-associated virus (AAV) and treated four cells (HepG2, HL7702, WEHI-3, and Hepa1-6) and tumor-bearing mice. As results, the recombinant AAV significantly inhibited the growth of three cancer cells (HepG2, Hepa1-6, and WEHI-3) in vitro and the xenografted Hepa1-6 and WEHI-3 tumors in mice. This study therefore developed a new tool for the CRISPR-Cas13a-based cancer gene therapy.

Keywords: CRISPR-Cas13a; NF-κB; RNA interference; cancer; gene therapy.


Figures

None
Graphical abstract
Figure 1
Figure 1
Schematic Illustration of Antitumor Mechanism of DMP-Cas13a-U6-gRNA (DCUg)
Figure 2
Figure 2
Interference of Ectopic Gene Expression in HEK293T Cell with DCUg Cells were transfected by various vectors and detected at 24 h post transfection. (A) Representative fluorescent images of cells. pDCUg-NT/EGFP/mCherry, plasmid expressing DMP-controlled Cas13a and U6-controlled gRNA targeting no, EGFP, and mCherry transcripts. (B) Flow cytometry analysis of fluorescence intensity. (C) qPCR analysis of mRNA expression. RQ, relative quantification. All values are mean ± SEM with n = 3. ∗p < 0.05; ∗∗p < 0.01.
Figure 3
Figure 3
Interference of Ectopic Gene Expression in HepG2 Cell with DCUg Cells were transfected by various vectors and detected at 24 h post transfection. (A) Representative fluorescent images of cells. pDCUg-NT/EGFP/mCherry, plasmid expressing DMP-controlled Cas13a and U6-controlled gRNA targeting no, EGFP, and mCherry transcripts. (B) Flow cytometry analysis of fluorescence intensity. (C) qPCR analysis of mRNA expression. All values are mean ± SEM with n = 3. ∗p < 0.05; ∗∗p < 0.01.
Figure 4
Figure 4
Interference of Endogenous Gene Expression with DCUg Cells were transfected by various vectors and detected at 24 h post transfection. (A) Flow cytometry analysis of cell apoptosis. (B) Expression level of Cas13a mRNA in HepG2 and HL7702 cells. (C) qPCR analysis of mRNA expression. (D) Western blot analysis of protein expression. The representative image and quantified optical density were shown. Lip, Lipofectamine; NT/TERT/EZH2/RelA/TER, pDCUg-NT/TERT/EZH2/RelA/TER. (E) CCK-8 assay of cell growth. Blank, cells without any treatment. Lipofectamine, cells treated with Lipofectamine only. pDCUg-NT/TERT/EZH2/RelA/TER, plasmid expressing DMP-controlled Cas13a and U6-controlled gRNA targeting no transcript (NT), TERT, EZH2, RelA, and TER transcripts. TER, TERT&EZH2&RelA. All values are mean ± SEM with n = 3, unless otherwise noted. ∗p < 0.05; ∗∗p < 0.01.
Figure 5
Figure 5
Antitumor Effects of DCUg Virus In Vitro Cells were inoculated in 24-well plate (1 × 105 cells/well) and cultured for 12 h. Cells were then treated with viruses (5 × 1010 vg/well) including rAAV-MCS, rAAV-NT, rAAV-TERT, rAAV-EZH2, rAAV-RelA, and rAAV-TER, respectively. Cells were cultured for 72 h and imaged at three time points, including 24 h, 48 h, and 72 h, respectively. The cells viability was evaluated using a CCK-8 assay at 72 h post transfection. (A) Representative images of cells at 72 h post transfection. (B) The cells viability at 72 h post transfection. All values are mean ± SEM with n = 3. ∗p < 0.05; ∗∗p < 0.01.
Figure 6
Figure 6
The Antitumor Effects of the DCUg Virus in the Hepa1-6 Xenograft Mice (A) Images of mice that were xenographed with the cancer cell Hepa1-6 transfected by virus rAAV-NT and rAAV-TER. (B) Tumor size before and after virus treatment. (C) Abundance of virus DNA in tissues. (D) Expression of Cas13a mRNA in various tissues of tumor-bearing mice intravenously injected with rAAV-NT and rAAV-TER. All other values were compared with the value of heart of rAAV-NT-treated mice. (E) Abundance of target mRNAs in tissues. All values are mean ± SEM with n = 3. ∗p < 0.05; ∗∗p < 0.01.
Figure 7
Figure 7
The Antitumor Effect of DCUg Virus in the WEHI-3 Xenograft Mice (A and B) Schematic illustration of the xenograft modeling and treatment (A, for groups PBS-1, rAAV-NT-1, and rAAV-TER-1; B, for groups PBS-2, rAAV-NT-2, and rAAV-TER-2). (C–E) Tumor growth curve (C), tumor weight (D), and tumor imaging (E) of mice treated with intravenously injected PBS, rAAV-NT, and rAAV-TER, respectively (groups PBS-1, rAAV-NT-1, and rAAV-TER-1). (F and G) Tumor growth curve (F) and Kaplan-Meier survival curves (G) of mice treated with intravenously injected PBS, rAAV-NT, and rAAV-TER, respectively (groups PBS-2, rAAV-NT-2, and rAAV-TER-2). All values are mean ± SEM with n = 8. ∗p < 0.05; ∗∗p < 0.01, ∗∗∗p < 0.001. s.c., subcutaneous injection; i.v., intravenous injection.
Figure 8
Figure 8
The Antitumor Effect of DCUg Virus in the WEHI-3 Xenograft Mice The tumor-bearing mice were intravenously injected with PBS, rAAV-NT, and rAAV-TER, respectively (groups PBS-1, rAAV-NT-1, and rAAV-TER-1). (A) Abundance of virus DNA in tissues. (B) Expression of Cas13a mRNA in tissues. All other values were compared with the value of heart of PBS-treated mice. (C) Abundance of target mRNAs in tissues. (D) Expression of CD31, Ki67, and Caspase-3 in tumors. (E) Images of tumors and their H&E-stained histological sections. All values are mean ± SEM with n = 3. ∗p < 0.05; ∗∗p < 0.01.

References

    1. Dy R.L., Richter C., Salmond G.P.C., Fineran P.C. Remarkable mechanisms in microbes to resist phage infections. Annu. Rev. Virol. 2014;1:307–331. - PubMed
    1. East-Seletsky A., O’Connell M.R., Burstein D., Knott G.J., Doudna J.A. RNA Targeting by Functionally Orthogonal Type VI-A CRISPR-Cas Enzymes. Mol. Cell. 2017;66:373–383.e3. - PMC - PubMed
    1. Aman R., Ali Z., Butt H., Mahas A., Aljedaani F., Khan M.Z., Ding S., Mahfouz M. RNA virus interference via CRISPR/Cas13a system in plants. Genome Biol. 2018;19:1. - PMC - PubMed
    1. Makarova K.S., Wolf Y.I., Alkhnbashi O.S., Costa F., Shah S.A., Saunders S.J., Barrangou R., Brouns S.J.J., Charpentier E., Haft D.H. An updated evolutionary classification of CRISPR-Cas systems. Nat. Rev. Microbiol. 2015;13:722–736. - PMC - PubMed
    1. Shmakov S., Abudayyeh O.O., Makarova K.S., Wolf Y.I., Gootenberg J.S., Semenova E., Minakhin L., Joung J., Konermann S., Severinov K. Discovery and Functional Characterization of Diverse Class 2 CRISPR-Cas Systems. Mol. Cell. 2015;60:385–397. - PMC - PubMed