. 2020 Oct 7;23(11):101654.
doi: 10.1016/j.isci.2020.101654. eCollection 2020 Nov 20.

Mitochondrial Protein Synthesis Is Essential for Terminal Differentiation of CD45- TER119-Erythroid and Lymphoid Progenitors

Affiliations

Mitochondrial Protein Synthesis Is Essential for Terminal Differentiation of CD45- TER119-Erythroid and Lymphoid Progenitors

Kazuhito Gotoh et al. iScience. .

Abstract

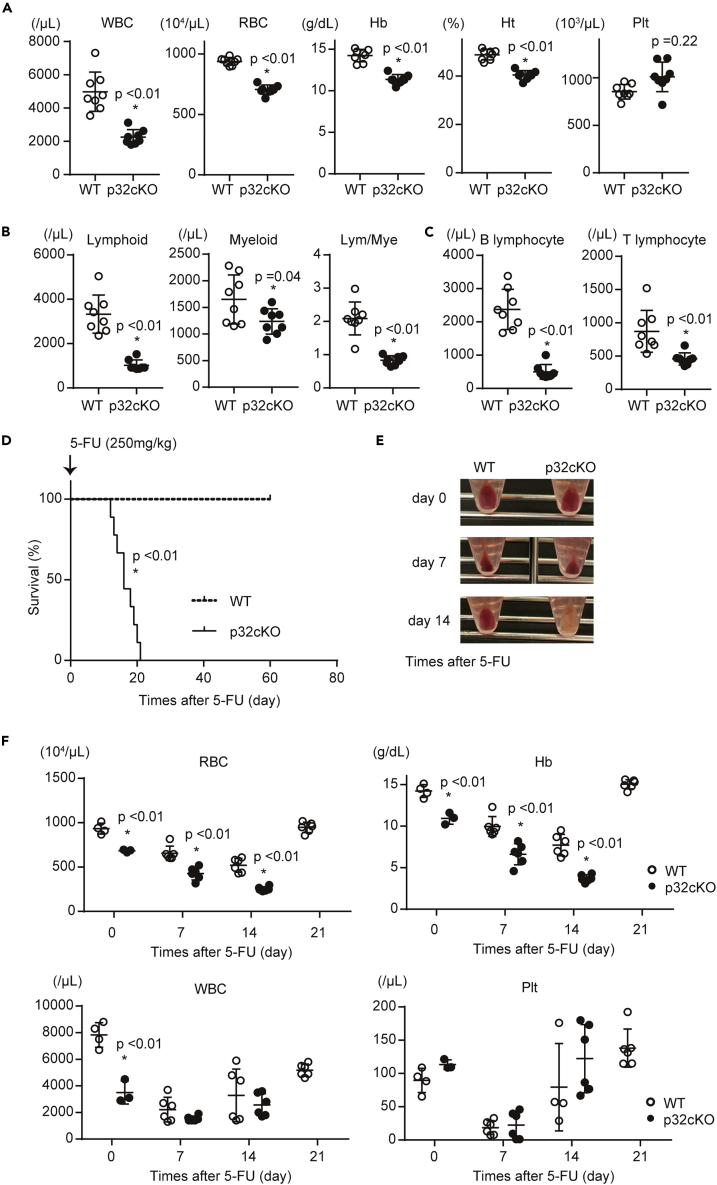
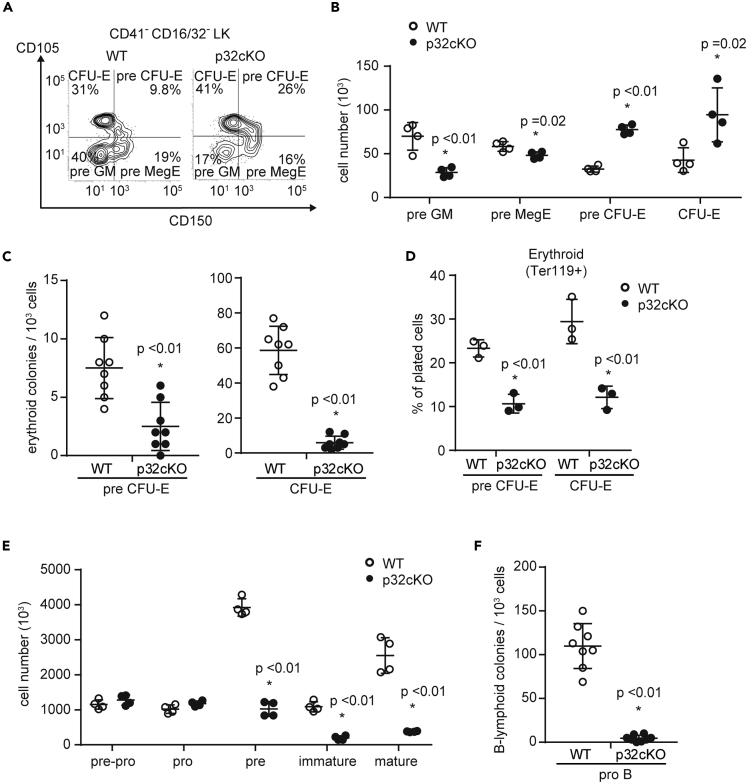
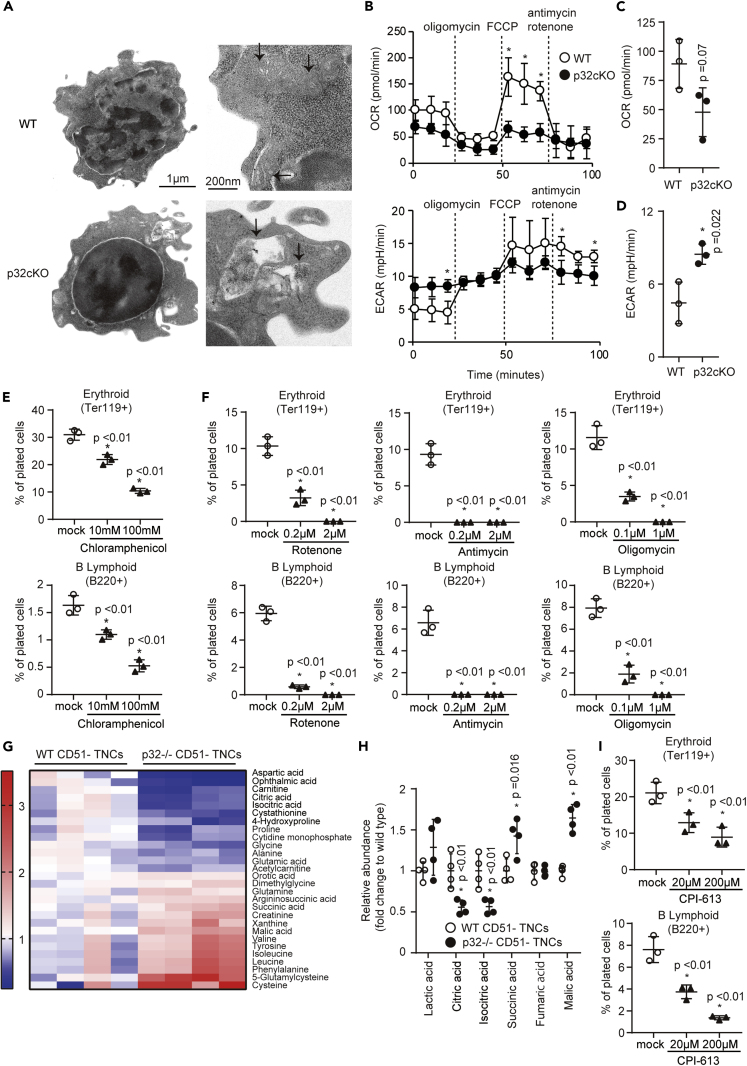
p32/C1qbp regulates mitochondrial protein synthesis and is essential for oxidative phosphorylation in mitochondria. Although dysfunction of p32/C1qbp impairs fetal development and immune responses, its role in hematopoietic differentiation remains unclear. Here, we found that mitochondrial dysfunction affected terminal differentiation of newly identified erythroid/B-lymphoid progenitors among CD45- Ter119- CD31- triple-negative cells (TNCs) in bone marrow. Hematopoietic cell-specific genetic deletion of p32/C1qbp (p32cKO) in mice caused anemia and B-lymphopenia without reduction of hematopoietic stem/progenitor cells. In addition, p32cKO mice were susceptible to hematopoietic stress with delayed recovery from anemia. p32/C1qbp-deficient CD51- TNCs exhibited impaired mitochondrial oxidation that consequently led to inactivation of mTORC1 signaling, which is essential for erythropoiesis. These findings uncover the importance of mitochondria, especially at the stage of TNCs during erythropoiesis, suggesting that dysregulation of mitochondrial protein synthesis is a cause of anemia and B-lymphopenia with an unknown pathology.

Keywords: Developmental Genetics; Molecular Biology.


Conflict of interest statement

The authors declare no competing interests.

Figures

None
Graphical abstract
Figure 1
Figure 1
p32/C1qbp is Essential for Development of Erythrocytes and B-Lymphocytes (A) WBCs, RBCs, hemoglobin concentration (Hb), hematocrit (Ht), and the platelet (Plt) count in peripheral blood from 8-12-week-old WT (open circle, n = 8) and p32cKO (closed squares, n = 8) mice. (B and C) Numbers of lymphoid cells (Gr-1 CD11b), myeloid cells (Gr-1+ CD11b+), B-lymphocytes (CD19+ CD3 Gr-1 CD11b), and T-lymphocytes (CD19 CD3+ Gr-1 CD11b) in the peripheral blood. (D) Kaplan-Meier plots of age-matched WT and p32cKO mice (n = 9) treated with 5-FU (250 mg/kg). (E) Appearance of bone marrow pellets from WT and p32cKO mice after 5-FU injection. (F) WBCs, RBCs, Hb, and Plts in peripheral blood from WT (open circle, n = 4–6) and p32cKO (closed squares, n = 4–6) mice after 5-FU injection (250 mg/kg). In (A–C) and (F), data are shown as means ± SD. ∗p < 0.05 versus WT mice. Data are representative at least three (A–F) independent experiments. See also Figures S1 and S2.
Figure 2
Figure 2
p32/C1qbp Deficiency Prohibits Terminal Differentiation of Erythrocytes and B-Lymphocytes (A) Representative flow cytometry plots of pre-GMs, pre-MegEs, pre-CFU-E cells, and CFU-E cells in bone marrow (BM) of WT and p32cKO mice. (B and E) Numbers of pre-GMs (CD150 CD105 CD41 CD16/32 LK), pre-MegEs (CD150+ CD105 CD41 CD16/32 LK), preCFU-Es (CD150+ CD105+ CD41 CD16/32 LK), CFU-Es (CD150 CD105+ CD41 CD16/32 LK) (B) and pre-pro- (B220+ CD19 CD43+ IgM), pro- (B220+ CD19+ CD43+ IgM), pre- (B220+ CD19+ CD43 IgM), immature (B220+ CD19+ CD43 IgM+), and mature (B220++ CD19+ CD43 IgM+–) B cells (E) in BM from WT and p32cKO mice. (C and F) Sorted pre-CFU-Es, CFU-Es (C), and pro-B cells (F) from WT and p32cKO mice were plated at low densities (1000 cells/well) in methylcellulose (Stem Cell Technologies, Cat#: M3334 [CFU-E] Cat#: 3630 [CFU pre-B + 25ng/mL SCF]). Erythroid and B-lymphoid colonies were enumerated at day 2 (C) and day 5 (F). (D) Sorted pre-CFU-E and CFU-E cells from WT and p32cKO mice were seeded in liquid culture with cytokines (stem cell factor, IL-3, IL-6, erythropoietin, and thrombopoietin) for 48 hr. The erythroid (Ter119+) lineage potential of sorted preCFU-E and CFU-E cells is shown. Cell numbers in each population were normalized as the percentage of total cells plated per well (% of cells plated). (B–F) Data are shown as means ± SD. ∗p < 0.05 versus WT mice. Data are representative at least three (A–F) independent experiments. See also Figures S2 and S3.
Figure 3
Figure 3
Mitoribosomes are Essential for CD45 Erythroid and B-Lymphoid Progenitor Differentiation (A and B) Representative flow cytometry plots of CD44 + CD51 and CD44 CD51 cells among CD31/CD45/Ter119 triple-negative cells (TNCs) in enzymatically digested bone marrow. Histograms of p32 (B) expression in CD44+ CD51 and CD44 CD51cells among TNCs. The IgG isotype control is shown as a dotted line. (C) Histograms of CD44 expression in CD51 TNCs. Results are shown as the mean fluorescence intensity ±SD. (D) Sorted CD51 TNCs from WT and p32cKO mice were plated at low densities (1000 cells/well) in methylcellulose (Stem Cell Technologies, Cat#: M3334 [CFU-E] Cat#: 3630 [CFU pre-B + 25ng/mL SCF]). Erythroid and B-lymphoid colonies were enumerated at day 2 and day 5. (E) Quantification of Ter119+ (erythroid) and B220+ (B-lymphoid) cells that were differentiated from sorted CD51 TNCs of WT and p32cKO mice seeded in liquid culture with cytokines (stem cell factor, IL-3, IL-6, erythropoietin, and thrombopoietin) under normoxia for 48 hr. Cell numbers in each population were normalized as the percentage of total cells plated per well (% of cells plated). (F) FACS analysis of cell death in CD44+ CD51 TNCs, and CD44 CD51 TNCs (left). The rates of the population of Annexin V/Propidium Iodide are indicated (right). In (C–F) data are shown as means ± SD. ∗p < 0.05 versus WT mice. Data are representative at least three (A–F) independent experiments. See also Figures S4.
Figure 4
Figure 4
p32/C1qbp Regulates Mitochondrial OXPHOS in CD51 TNCs (A) Electron microscopic images of sorted CD51 TNCs. Images on the right highlight individual mitochondria (black arrows). (B–D) Measurements of the OCR and ECAR in CD51 TNCs (2×10⁵ cells/well) from WT and p32cKO mice by an XF-24 extracellular flux analyzer. The real-time OCR and ECAR were determined during sequential treatments with oligomycin (ATP synthase inhibitor), FCCP, and antimycin-A/rotenone (ETC inhibitors) (B). (E, F, and I) Quantification of Ter119+ (erythroid) and B220+ (B-lymphoid) cells that were differentiated from sorted CD51 TNCs of WT mice seeded in liquid culture with cytokines in the presence or absence of chloramphenicol (E), rotenone, antimycin, oligomycin (F), and CPI-613 (I) for 48 hr. Cell numbers in each population were normalized as the percentage of total cells plated per well (% of cells plated). (G) Comparisons of the amounts of metabolites between WT and p32−/− CD51 TNCs. Heat map of metabolites extracted from WT and p32−/− CD51 TNCs showing statistically significant changes (P < 0.05). (H) Comparisons of the amounts of metabolites associated with TCA cycle between WT and p32−/− CD51 TNCs. In B–F, H, I, data are shown as means ± SD. ∗p < 0.05 versus WT mice or DMSO controls. Data are representative at least three (A-I) independent experiments. See also Figures S5.
Figure 5
Figure 5
Loss of p32/C1qbp Induces Mitochondrial Integrated Stress Response in CD44+ CD51 TNCs (A and B) Comparisons of the amounts of mRNA between WT and p32−/− CD44+ CD51 TNCs. Volcano plot (A) showing differential gene expression in CD44+ CD51 TNCs isolated from WT (n = 3) and p32cKO (n = 3) mice. Fold change is calculated as log2(expression in p32cKO/expression in WT). Heatmap (B) of CD44+ CD51 TNCs signature genes that are differentially expressed (adjusted P < 0.05, fold change >4) in WT (n = 3) versus p32cKO (n = 3) mice. (C and D) Heat maps of relative mRNA of the genes of amino acid metabolic pathways (C) and mitochondrial integrated stress response (D) in CD44+ CD51 TNCs and CFU-Es isolated from WT (n = 3) and p32cKO (n = 3). (E and F) Comparisons of the amounts of mRNA between WT and p32−/− CFU-Es. Volcano plot (E) showing differential gene expression in CFU-Es isolated from WT (n = 3) and p32cKO (n = 3) mice. Fold change is calculated as log2(expression in p32cKO/expression in WT). Heatmap (F) of CFU-Es signature genes that are differentially expressed (adjusted P < 0.05, fold change >4) in WT (n = 3) versus p32cKO (n = 3) mice. CD44+ CD51 TNCs and CFU-Es from WT (n = 3) and p32cKO (n = 3) mice were isolated on different days. Further processing and sequencing was performed with all twelve samples simultaneously. See also Figures S6.
Figure 6
Figure 6
p32/C1qbp Regulates the mTORC1 Signaling Pathway in CD51 TNCs (A–C) Flow cytometry histograms and quantification of the expression of ATF4 (A), Sestrin2 (B), and p4EBP1 (C) in CD44 + CD51 TNCs from WT (n = 3) and p32cKO (n = 3) mice. IgG isotype controls are depicted as dotted lines. Results are shown as the mean fluorescence intensity ±SD. (D) Quantification of Ter119+ (erythroid) and B220+ (B-lymphoid) cells that were differentiated from sorted CD51 TNCs of WT mice seeded in liquid culture with cytokines in the presence or absence of Torin 1 for 48 hr. Cell numbers in each population were normalized as the percentage of total cells plated per well (% of cells plated). In A–D, data are shown as means ± SD. ∗p < 0.05 versus WT mice or DMSO controls. Data are representative of three independent experiments.
Figure 7
Figure 7
p32cKO Mice are Susceptible to Hemolysis Due to Erythroid Differentiation Failure (A) Kaplan–Meier plot of age-matched WT and p32cKO mice (n = 8 per group) treated with PHZ (80 mg/kg). (B) Hb levels in peripheral blood from WT (n = 8) and p32cKO (n = 8) mice treated with PHZ (80 mg/kg). (C and D) Representative flow cytometry plots (C), and proportions and absolute numbers (D) of Ly6D CD44+ CD51 TNCs in enzymatically digested bone marrow from WT and p32cKO mice after PHZ injection. n = 4 mice per group. (E) Quantification of Ter119+ (erythroid) and B220+ (B-lymphoid) cells that were differentiated from sorted Ly6D CD44+ CD51 TNCs of WT and p32cKO mice seeded in liquid culture with cytokines for 48 hr n = 3 mice per group. (F–H) Analysis of Torin 1-treated mice after PHZ injection. n = 8 mice per group. Hb levels in the peripheral blood (F) and Kaplan–Meier plot of WT mice (n = 8) treated with PHZ (80 mg/kg) after Torin 1 (20 mg/kg) injection (G). Quantification of Ter119+ (erythroid) and B220+ (B-lymphoid) cells that were differentiated from sorted Ly6D CD44+ CD51 TNCs of WT mice (H). Cell numbers in each population were normalized as the percentage of total cells plated per well (% of cells plated). Data are shown as means ± SD. ∗p < 0.05 versus WT mice or DMSO controls. Data are representative of three independent experiments. See also Figures S7.

Similar articles

Cited by

References

    1. Anso E., Weinberg S.E., Diebold L.P., Thompson B.J., Malinge S., Schumacker P.T., Liu X., Zhang Y., Shao Z., Steadman M. The mitochondrial respiratory chain is essential for haematopoietic stem cell function. Nat. Cell Biol. 2017;19:614–625. - PMC - PubMed
    1. Asada N., Kunisaki Y., Pierce H., Wang Z.C., Fernandez N.F., Birbrair A., Ma'ayan A., Frenette P.S. Differential cytokine contributions of perivascular haematopoietic stern cell niches. Nat. Cell Biol. 2017;19:214–223. - PMC - PubMed
    1. Bao X.R., Ong S.E., Goldberger O., Peng J., Sharma R., Thompson D.A., Vafai S.B., Cox A.G., Marutani E., Ichinose F. Mitochondrial dysfunction remodels one-carbon metabolism in human cells. Elife. 2016;5:e10575. - PMC - PubMed
    1. Boulais P.E., Mizoguchi T., Zimmerman S., Nakahara F., Vivie J., Mar J.C., van Oudenaarden A., Frenette P.S. The majority of CD45(-) Ter119(-) CD31(-) bone marrow cell fraction is of hematopoietic origin and contains erythroid and lymphoid progenitors. Immunity. 2018;49:627–639. - PMC - PubMed
    1. Cappelli E., Ravera S., Vaccaro D., Cuccarolo P., Bartolucci M., Panfoli I., Dufour C., Degan P. Mitochondrial respiratory complex I defects in Fanconi anemia. Trends Mol. Med. 2013;19:513–514. - PubMed