. 2020 Nov:2:100036.
doi: 10.1016/j.gloepi.2020.100036. Epub 2020 Oct 19.

Impact assessment of full and partial stay-at-home orders, face mask usage, and contact tracing: An agent-based simulation study of COVID-19 for an urban region

Affiliations

Impact assessment of full and partial stay-at-home orders, face mask usage, and contact tracing: An agent-based simulation study of COVID-19 for an urban region

Hanisha Tatapudi et al. Glob Epidemiol. 2020 Nov.

Abstract

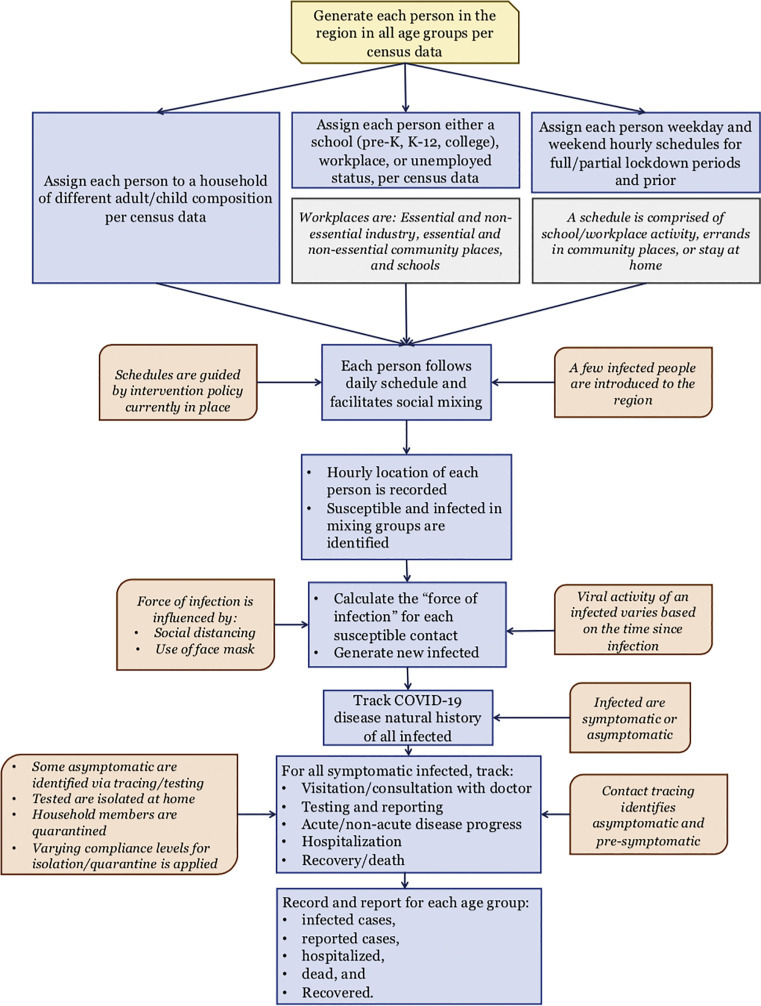
Purpose: Social intervention strategies to mitigate COVID-19 are examined using an agent-based simulation model. Outbreak in a large urban region, Miami-Dade County, Florida, USA is used as a case study. Results are intended to serve as a planning guide for decision makers.

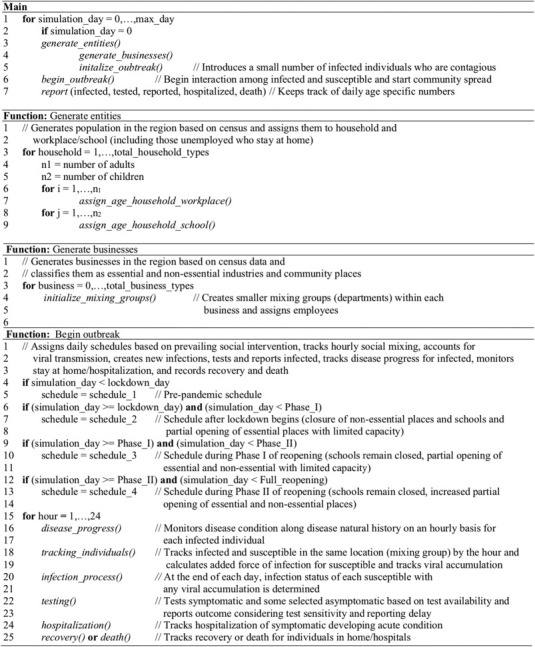
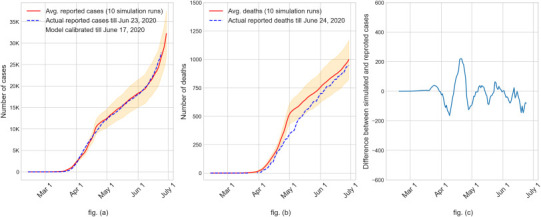
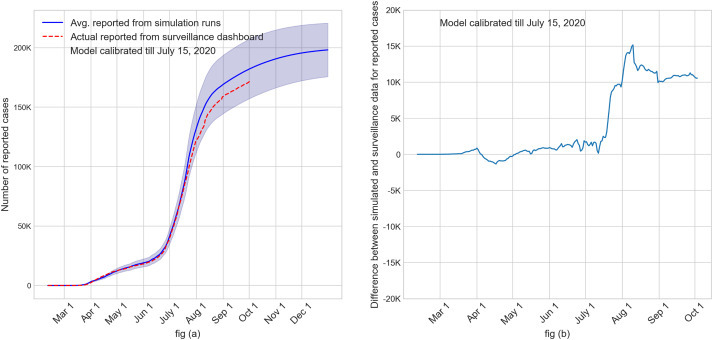
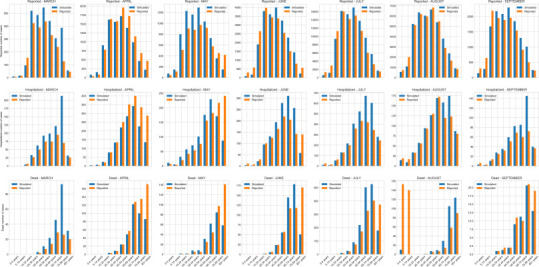
Methods: The simulation model mimics daily social mixing behavior of the susceptible and infected generating the spread. Data representing demographics of the region, virus epidemiology, and social interventions shapes model behavior. Results include daily values of infected, reported, hospitalized, and dead.

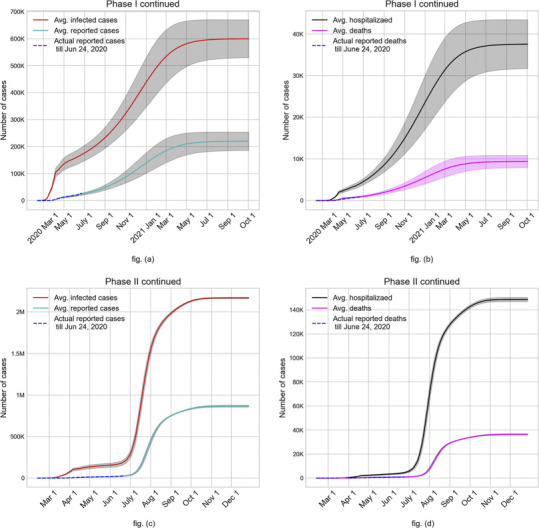
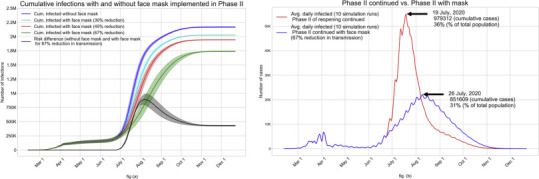
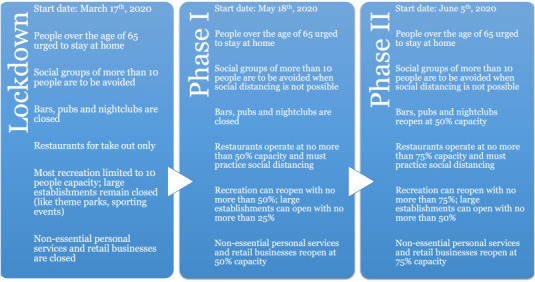
Results: Results show that early implementation of complete stay-at-home order is effective in flattening and reversing the infection growth curve in a short period of time. Whereas, using Florida's Phase II plan alone could result in 75% infected and end of pandemic via herd immunity. Universal use of face masks reduced infected by 20%. A further reduction of 66% was achieved by adding contact tracing with a target of identifying 50% of the asymptomatic and pre-symptomatic.

Conclusions: In the absence of a vaccine, the strict stay-at-home order, though effective in curbing a pandemic outbreak, leaves a large proportion of the population susceptible. Hence, there should be a strong follow up plan of social distancing, use of face mask, contact tracing, testing, and isolation of infected to minimize the chances of large-scale resurgence of the disease. However, as the economic cost of the complete stay-at-home-order is very high, it can perhaps be used only as an emergency first response, and the authorities should be prepared to activate a strong follow up plan as soon as possible. The target level for contact tracing was shown to have a nonlinear impact on the reduction of the percentage of population infected. Increase in contact tracing target from 20% to 30% appeared to provide the largest incremental benefit.

Keywords: Agent-based simulation model; COVID-19; Contact tracing; Face mask; Intervention strategies; SARS-CoV-2.


Conflict of interest statement

The authors declare that they have no known competing financial interests or personal relationships that could have appeared to influence the work reported in this paper.

Figures

Fig. 1
Fig. 1
A schematic of agent-based simulation model for COVID-19.
Fig. 2
Fig. 2
Pseudo-code for agent-based simulation model of COVID-19.
Fig. 3
Fig. 3
Disease natural history of COVID-19 (see Table A6 for average lengths of the periods).
Fig. 4
Fig. 4
Lognormal distribution function for infectiousness profile of a COVID-19 case.
Fig. 5
Fig. 5
Validation of AB simulation model results using the State reported numbers of ‘cumulative infected cases’ in fig. (a) and ‘cumulative deaths’ in fig. (b) for Miami-Dade County, Florida, USA. Fig. (c) difference of the 7-day moving average between cumulative reported cases from simulation and surveillance (mean difference − 8 and 95% CI (−145 to 130)).
Fig. 6
Fig. 6
Growth of actual and reported infected cases (fig. (a)) and hospitalizations and deaths (fig. (b)) if stay-at-home order were not lifted.
Fig. 7
Fig. 7
Case study outcomes (average values with 95% C.I.) of continuing with Phase I reopening (fig. (a) and fig. (b)) and Phase II reopening without face mask and contact tracing (fig. (c) and fig. (d)).
Fig. 8
Fig. 8
(a): Impact of face mask usage starting June 25 (together with Phase II order) on the average cumulative infected for all compliance levels; fig. (b): Impact of universal use of face mask on the average daily infected.
Fig. 9
Fig. 9
Impact of contact tracing, starting on June 30, during Phase II with universal face mask usage.
Fig. 10
Fig. 10
Validation of calibrated simulation model using state reported surveillance numbers for cumulative reported cases. Fig. (a): Cumulative plot of the average reported cases from simulation (with 95% CI) along with surveillance data. Fig (b): Plot of the difference between cumulative values of average reported cases from simulation and surveillance.
Fig. A1
Fig. A1
Florida's phased social intervention plan for COVID-19 pandemic [44].
Fig. A2
Fig. A2
Validation of simulation model by comparing monthly average values of reported cases, hospitalized, and deaths (in orange) with the corresponding reported values from Florida COVID-19 Dashboard (in blue). (For interpretation of the references to colour in this figure legend, the reader is referred to the web version of this article.)

References

    1. Aleta A., Martin-Corral D., Piontti A., Ajelli M., Litvinova M., Chinazzi M. Modeling the impact of social distancing, testing, contact tracing and household quarantine on second-wave scenarios of the COVID-19 epidemic. medRxiv. 2020 doi: 10.1101/2020.05.06.20092841. - DOI - PMC - PubMed
    1. Almukhtar S., Aufrichtig A., Bloch M., Calderone J., Collins K., Conlen M. 2020. Nytimes.com. Coronavirus Map: Tracking the Global Outbreak. Nytimes.com. https://www.nytimes.com/interactive/2020/world/coronavirus-maps.html?aut... accessed 07.07.2020.
    1. Andersen K., Rambaut A., Lipkin W., Holmes E., Garry R. The proximal origin of SARS-CoV-2. Nat Med. 2020;26 doi: 10.1038/s41591-020-0820-9. - DOI - PMC - PubMed
    1. Barmparis G.D., Tsironis G.P. Estimating the infection horizon of COVID-19 in eight countries with a data-driven approach. Chaos Solitons Fractals. 2020;135:109842. doi: 10.1016/j.[s.2020.109842. - DOI - PMC - PubMed
    1. Candido D., Claro I., Jesus J., Marciel de Souza W., Moreira F., Dellicour S. Evolution and epidemic spread of SARS-CoV-2 in Brazil. medRxiv. 2020 doi: 10.1101/2020.06.11.20128249. - DOI - PMC - PubMed