Review
. 2020 Dec 10;63(23):14276-14307.
doi: 10.1021/acs.jmedchem.0c01013. Epub 2020 Oct 26.

Why All the Fuss about Oxidative Phosphorylation (OXPHOS)?

Affiliations
Review

Why All the Fuss about Oxidative Phosphorylation (OXPHOS)?

Yibin Xu et al. J Med Chem. .

Abstract

Certain subtypes of cancer cells require oxidative phosphorylation (OXPHOS) to survive. Increased OXPHOS dependency is frequently a hallmark of cancer stem cells and cells resistant to chemotherapy and targeted therapies. Suppressing the OXPHOS function might also influence the tumor microenvironment by alleviating hypoxia and improving the antitumor immune response. Thus, targeting OXPHOS is a promising strategy to treat various cancers. A growing arsenal of therapeutic agents is under development to inhibit this biological process. This Perspective provides an overview of the structure and function of OXPHOS complexes, their biological functions in cancer, relevant research tools and models, as well as the limitations of OXPHOS as drug targets. We also focus on the current development status of OXPHOS inhibitors and potential therapeutic strategies to strengthen their clinical applications.


Figures

Figure 1.
Figure 1.
Function of OXPHOS complexes. The OXPHOS machinery consists of five multiprotein complexes (Complex I-V), transferring electrons and creating an electrochemical proton gradient to drive the synthesis of adenosine triphosphate (ATP). Electrons are transferred from NADH or succinate to ubiquinone (Q) through complex I or II, then the electrons are removed from QH2 in Complex III to form a proton gradient. In Complex IV, electrons are transferred to the terminal electron acceptor oxygen (O2). All the protons pumped into the intermembrane space by Complex I, III, and IV create a proton gradient that facilitate ATP production by ATP synthase (Complex V). Structural genes for each complex are listed in the table below. Genes encoded by mitochondrial DNA are highlighted in red.
Figure 2.
Figure 2.
Structures of OXPHOS complexes. (A) Complex I consists of peripheral arm and membrane arm. The 49 kDa (light yellow) and PSST (cyan) subunits forming the ubiquinone binding pocket, and ND1 subunit (gray) forming the entrance of ubiquinone access channel is shown. The FMN and Fe-S clusters that forms the electron transfer chain are shown (PDB: 5LC5). (B) Complex II comprises four subunits: SDHA (Fp, green), SDHB (Ip, cyan), SDHC (CybL, yellow), SDHD (CybS, blue), with two ubiquinone binding sites (Qp and Qd site) and a succinate binding site. The Fe-S clusters and heme that are essential for electron transfer are shown. (PDB: 1ZOY). (C) Complex III is a symmetrical dimer with three core subunits: cytochrome b (cyt b, gray) with two b-type hemes (bL and bH), cytochrome c1 (cyt c1, yellow) and the iron-sulfur protein (ISP) with a Fe-S cluster (PDB: 1BGY). (D) The structure of complex IV. Two heme molecules (heme a and heme a3) along with two binuclear copper centers (CuA and CuB) embedded in the structure are critical for the electron transfer (PDB: 5WAU). (E) Complex V (ATP synthase) is composed of Fo sector and F1 sector (PDB: 6CP6).
Figure 3.
Figure 3.
OXPHOS gene expression is higher than average in multiple cancer types. (A) Chow-Ruskey Venn diagram shows 67 genes in common between Hallmark, KEGG, and GO (GO:0006119) OXPHOS gene sets with a custom literature-based gene set. (B) An OXPHOS gene set combining all four gene sets described above was mapped to 320 genes and associated expression values for TCGA patients. The pan-cancer heatmap shows z-score normalized gene expression values per patient with diseases ranked by average patient expression. KICH, ACC, LIHC, UVM, and DLBC have the highest average expression. (C) GSEA was performed to show enrichment significance of high expressing OXPHOS genes for each TCGA disease by ranking genes using average z-score value per gene per disease. 10,000 random permutations were performed to illustrate FDR adjusted p-value significance. The top five diseases are shown (as ranked by NES). NES = normalized enrichment score; FDR= false discovery rate.
Figure 4.
Figure 4.
OXPHOS gene expression shown for TGCA BRCA (A) and LUAD (B) patients with matched tumor and normal samples. Violin plots show patient average z-scores for the OXPHOS union gene set are significantly increased in tumor samples compared to normal samples using paired Wilcoxon test. Heatmaps show top 30 OXPHOS genes as ranked by average fold change of tumor to normal expression per gene. Thirteen genes were in common between BRCA and LUAD top 30 gene lists: ADCK5, CCNB1, CDK1, COA6, IDH2, MRPS12, MRPS30, NDUFAF6, PGK1, SHMT2, TIMM17A, UQCC2 and UQCC3 (p = 1.19E-07, Odds Ratio = 12.1). (C) There were 222 genes in BRCA and 185 genes in LUAD with average fold changes greater than zero. Of the 321 total OXPHOS genes, 155 had increased expression on average in both BRCA and LUAD. (D) Three of these common genes mapped to kinases (ADCK2, ADCK5, CDK1) are highlighted in magenta on a kinome map while a total of 6 OXHPOS genes mapped to kinases. ADCK2: BRCA W p = 2.59E-10, LUAD W p = 0.365. ADCK5: BRCA W p = 4.17E-09, LUAD W p = 4.59E-10. CDK1: BRCA W p = 4.27E-20, LUAD W p = 1.24e-10. The remaining 3 kinases (ADCK1, PDK4, PINK1) are colored green.
Figure 5.
Figure 5.
TCGA OXPHOS Hotspot Variant Survey. (A) Hotspot gain-of-function variants were identified in 22 of 33 diseases with the highest percentage of patients with OXPHOS hotspot variants in LGG (81%) in which the majority of patients had an IDH1 R132 hotspot or IDH2 R172. (B) Oncoprint visualizations for several diseases with the highest number of OXPHOS hotspot variants from the top 20 mutated OXPHOS genes. The remaining top disease Oncoprints are in Supplemental Figure 2. (C) Lollipop visualizations of the hotspot variants for GBM, SKCM, and STAD. Oncoprint and lollipop visualizations generated using Maftools package. IDH1 and RHOA amino acid coordinates use NM_005896 and NM_001664 transcripts respectively.
Figure 6.
Figure 6.
Assays to monitor OXPHOS modulation. (A) Screening compounds in medium enriched with galactose versus glucose. Cells grown in high glucose-containing medium use glycolysis for ATP generation while cells grown in galactose-containing medium rely almost exclusively on mitochondria for their ATP production. (B) Determination of oxygen consumption rate, mitochondrial potential and NADH/NAD+ ratio are also indicative for OXPHOS function. (C) Each OXPHOS complex has unique enzymatic activity, which facilitates the determination of compounds function.
Figure 7.
Figure 7.
Structures of select biguanides as OXPHOS inhibitors.
Figure 8.
Figure 8.
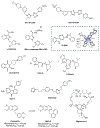
Structures of representative OXPHOS inhibitors. Model for binding of VLX600 to iron was reproduced from the original report.
Figure 9.
Figure 9.
Structures of representative OXPHOS inhibitors used for cancer treatment.
Figure 10.
Figure 10.
Potential strategies to enhance the efficacy of OXPHOS inhibitors in clinical applications: utilize biomarkers to select patients sensitive to OXPHOS inhibitors, apply OXPHOS inhibitors in targeted therapy for resistant patients, and combine OXPHOS inhibitors with other metabolic modulators to achieve synthetic lethality.
Figure 11.
Figure 11.
Combination of metabolic modulators with OXPHOS inhibitors. (A) Metabolic pathways including glycolysis and lactate production were compensatorily upregulated in response to OXPHOS inhibition. (B) Combination of glycolysis inhibitor and LDHA inhibitor with OXPHOS inhibitor significantly shuts down the compensatory effect and leads to synthetic lethality
Figure 12.
Figure 12.
Violin plot shows average z-score for oxidative phosphorylation genes for GTEx tissue samples. Heart, muscle, and kidney tissues have the highest average expression of OXPHOS genes. GTEx patient RNA-Seq and sample attribute data were sourced from https://www.gtexportal.org/. RNA-Seq gene expression values were downloaded, upper-quartile normalized, and log2+1 transformed. RNA-Seq values were converted to z-scores per patient sample. EBV-transformed lymphocytes and cultured fibroblast samples were excluded.
Figure 13.
Figure 13.
Physicochemical property distributions of OXPHOS inhibitors. (A) cLogP distribution. (B) topological polar surface area (tPSA) distribution. (C) fraction of sp3 hybridized carbons (Fsp3) distribution. (D) molecular weight (MW) distribution. (E) hydrogen bond donor (HBD) counts distribution. (F) H-bond acceptor (HBA) counts distribution. High toxicity risk groups are labelled in red.

Similar articles

Cited by

References

    1. Luengo A; Gui DY; Vander Heiden MG Targeting metabolism for cancer therapy. Cell Chem. Biol 2017, 24, 1161–1180. - PMC - PubMed
    1. Hu J; Locasale JW; Bielas JH; O’Sullivan J; Sheahan K; Cantley LC; Vander Heiden MG; Vitkup D Heterogeneity of tumor-induced gene expression changes in the human metabolic network. Nat. Biotechnol 2013, 31, 522–529. - PMC - PubMed
    1. Roesch A; Vultur A; Bogeski I; Wang H; Zimmermann KM; Speicher D; Korbel C; Laschke MW; Gimotty PA; Philipp SE; Krause E; Patzold S; Villanueva J; Krepler C; Fukunaga-Kalabis M; Hoth M; Bastian BC; Vogt T; Herlyn M Overcoming intrinsic multidrug resistance in melanoma by blocking the mitochondrial respiratory chain of slow-cycling JARID1B(high) cells. Cancer Cell 2013, 23, 811–825. - PMC - PubMed
    1. Sriskanthadevan S; Jeyaraju DV; Chung TE; Prabha S; Xu W; Skrtic M; Jhas B; Hurren R; Gronda M; Wang XM; Jitkova Y; Sukhai MA; Lin FH; Maclean N; Laister R; Goard CA; Mullen PJ; Xie S; Penn LZ; Rogers IM; Dick JE; Minden MD; Schimmer AD AML cells have low spare reserve capacity in their respiratory chain that renders them susceptible to oxidative metabolic stress. Blood 2015, 125, 2120–2130. - PMC - PubMed
    1. Sullivan LB; Gui DY; Hosios AM; Bush LN; Freinkman E; Vander Heiden MG Supporting aspartate biosynthesis is an essential function of respiration in proliferating cells. Cell 2015, 162, 552–563. - PMC - PubMed

Publication types