. 2021 Feb 1;320(2):E244-E258.
doi: 10.1152/ajpendo.00391.2020. Epub 2020 Oct 26.

Holistic characterization of single-hepatocyte transcriptome responses to high-fat diet

Affiliations

Holistic characterization of single-hepatocyte transcriptome responses to high-fat diet

Sung Rye Park et al. Am J Physiol Endocrinol Metab. .

Abstract

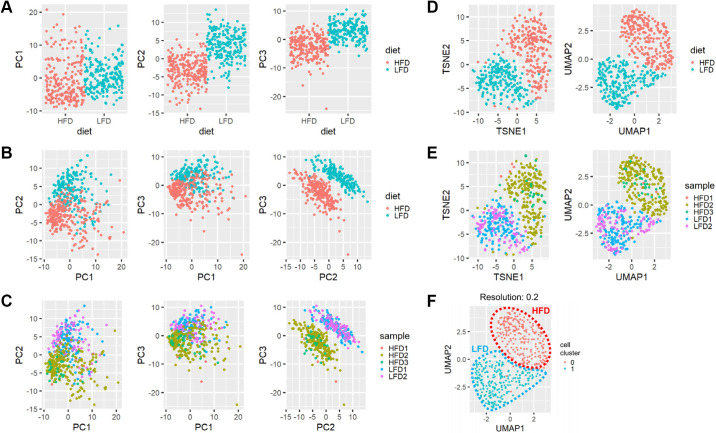
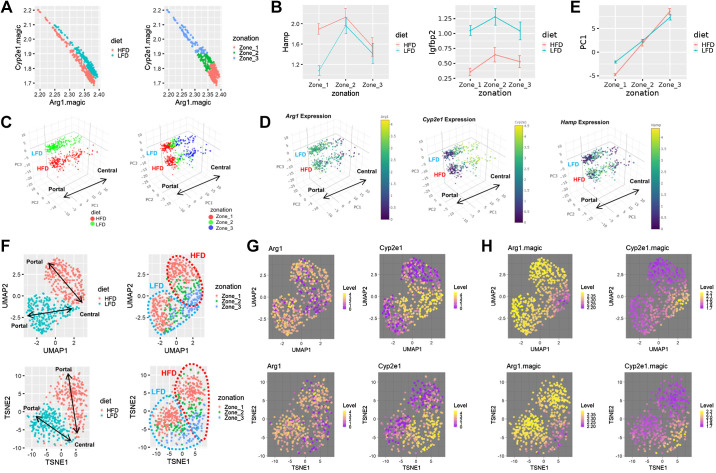
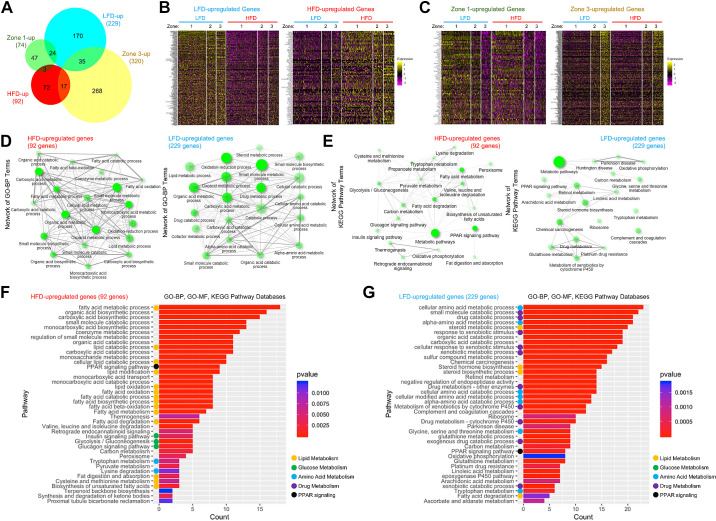
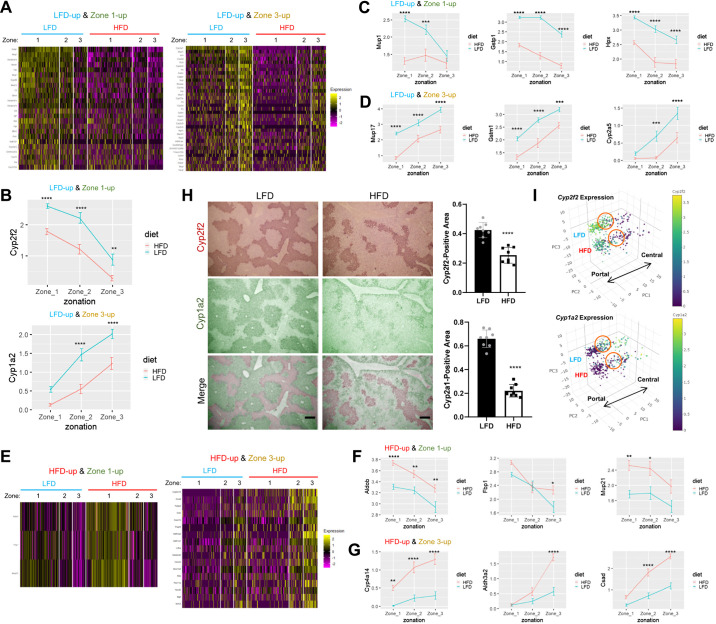
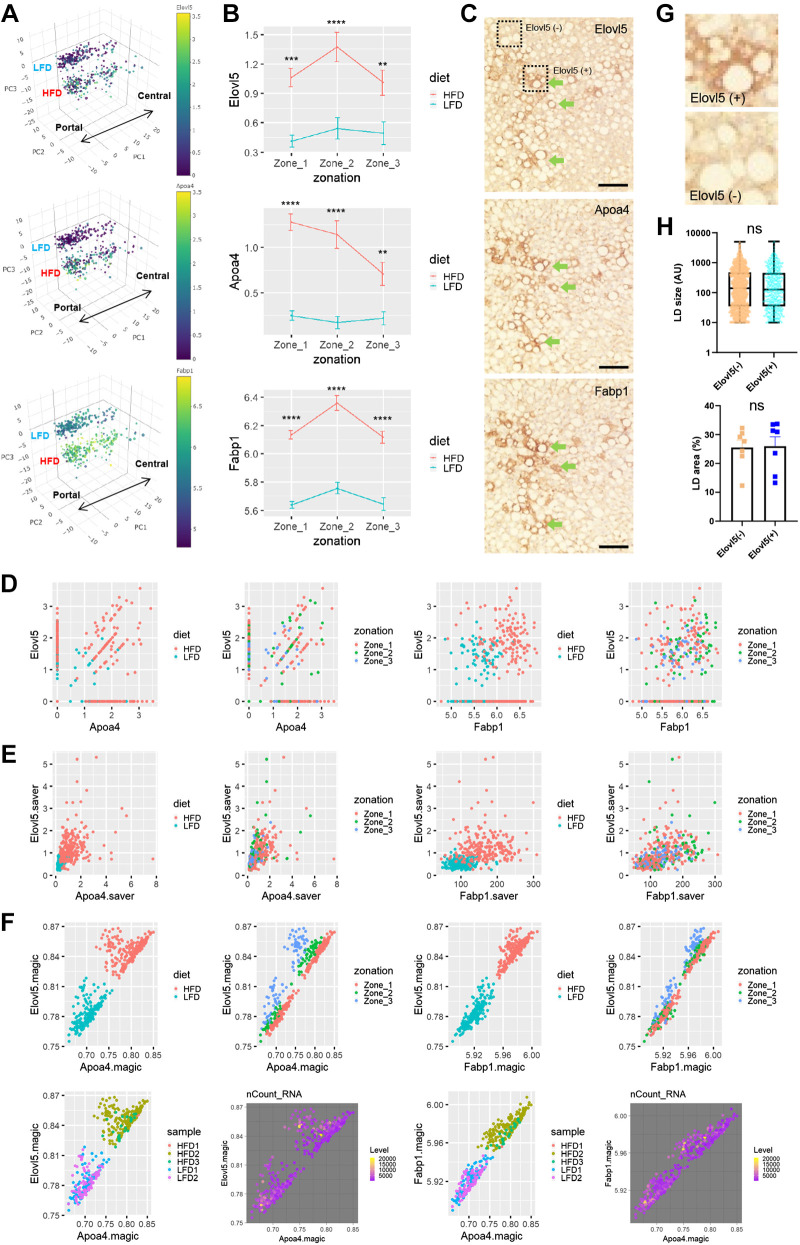
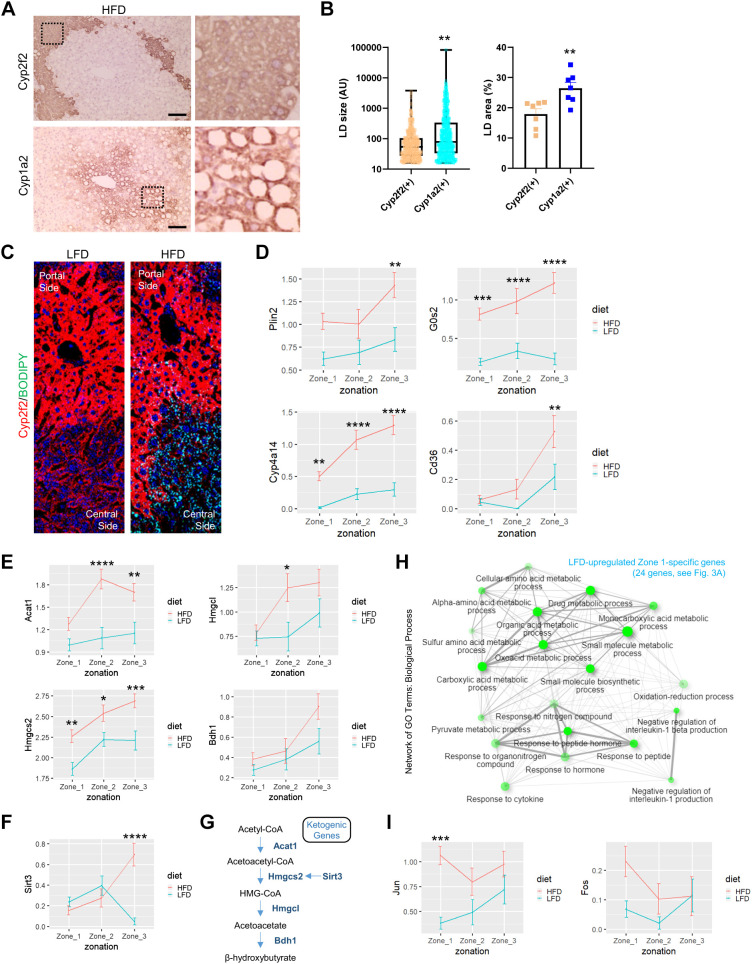
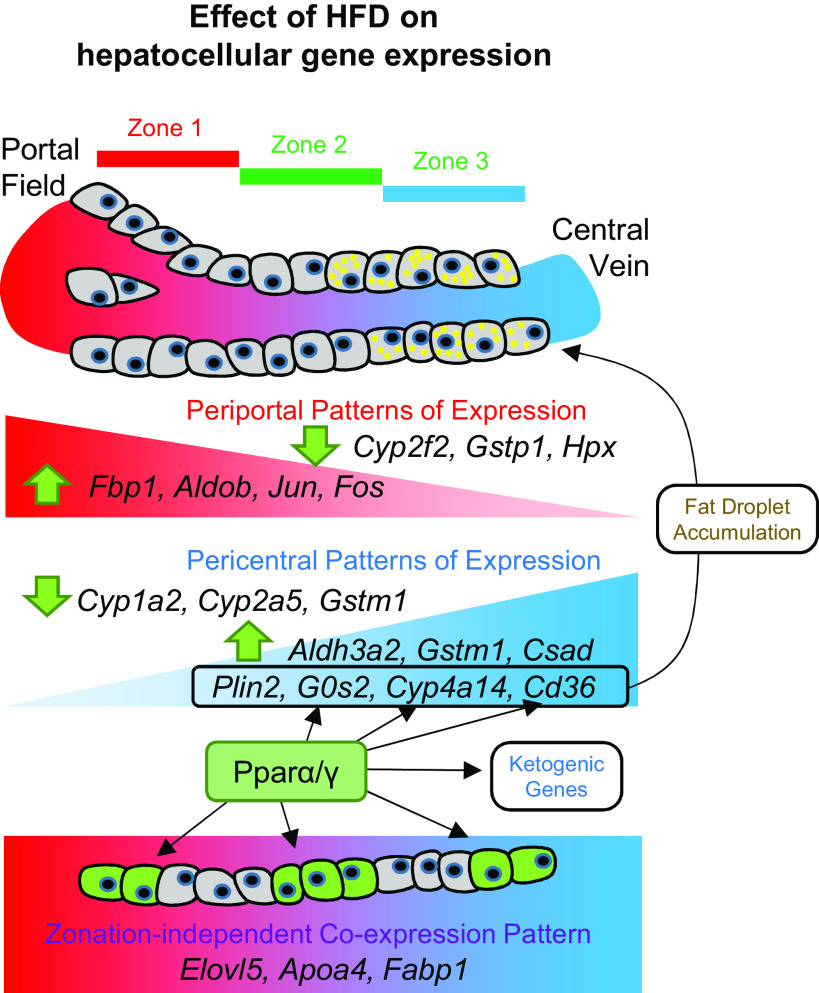
During nutritional overload and obesity, hepatocyte function is grossly altered, and a subset of hepatocytes begins to accumulate fat droplets, leading to nonalcoholic fatty liver disease (NAFLD). Recent single-cell studies revealed how nonparenchymal cells, such as macrophages, hepatic stellate cells, and endothelial cells, heterogeneously respond to NAFLD. However, it remains to be characterized how hepatocytes, the major constituents of the liver, respond to nutritional overload in NAFLD. Here, using droplet-based, single-cell RNA sequencing (Drop-seq), we characterized how the transcriptomic landscape of individual hepatocytes is altered in response to high-fat diet (HFD) and NAFLD. We showed that the entire hepatocyte population undergoes substantial transcriptome changes upon HFD, although the patterns of alteration were highly heterogeneous, with zonation-dependent and -independent effects. Periportal (zone 1) hepatocytes downregulated many zone 1-specific marker genes, whereas a small number of genes mediating gluconeogenesis were upregulated. Pericentral (zone 3) hepatocytes also downregulated many zone 3-specific genes; however, they upregulated several genes that promote HFD-induced fat droplet formation, consistent with findings that zone 3 hepatocytes accumulate more lipid droplets. Zone 3 hepatocytes also upregulated ketogenic pathways as an adaptive mechanism to HFD. Interestingly, many of the top HFD-induced genes, which encode proteins regulating lipid metabolism, were strongly co-expressed with each other in a subset of hepatocytes, producing a variegated pattern of spatial co-localization that is independent of metabolic zonation. In conclusion, our data set provides a useful resource for understanding hepatocellular alteration during NAFLD at single cell level.

Keywords: HFD; NAFLD; hepatocytes; liver; obesity; scRNA-seq; single cell.


Figures

Figure 1.
Figure 1.
High-fat diet (HFD) alters single-cell transcriptome of the entire hepatocyte population. Eight-week-old C57BL/6J male littermate mice were separated into 2 groups and fed a regular chow diet (LFD group) or high-fat diet (HFD group). Droplet-based, single-cell RNA sequencing (Drop-seq) of hepatocytes was performed after 12 wk of dietary modulation. AF: principal component analysis (PCA; AC), t-distributed stochastic neighbor embedding (t-SNE), and Uniform Manifold Approximation and Projection (UMAP; DF) manifolds colored with diet (A, B, and D), sample (C and E), or the result from multidimensional clustering (F). Individual dots represent single-cell transcriptome. In each manifold, the distance between individual dots represents the difference between the single-cell transcriptome. Approximate boundaries of the area for LFD and HFD samples are indicated as dotted outline (F).
Figure 2.
Figure 2.
Zonation patterns of single-hepatocyte transcriptome is preserved after high-fat diet (HFD). A: inverse correlation between imputed expression levels of Arg1 and Cyp2e1 (magic-imputed expression values). Individual dots represent single-cell transcriptome colored with diet (left) and zone assignment (right). B: analysis of single-cell gene expression in hepatocytes of each zone, expressed as means ± SE (scaled expression values). Data from low-fat diet (LFD) and HFD livers were analyzed separately. C and D: 3-dimensional PCA manifolds depicting the effect of diet (C, left), zonation (C, right), and expression levels of indicated genes (D). Individual dots represent single-cell transcriptome. The size of the dots represents the number of RNA features captured in the droplet. PC1 is composed of genes showing zone-specific expression patterns. PC2 and PC3 are composed of genes showing diet-regulated expression patterns. LFD and HFD area, as well as the directionality of metabolic zonation (from portal to central), are indicated in each manifold. E: analysis of single-cell PC1 values in hepatocytes of each zone, expressed as means ± SE (raw component scores). Data from LFD and HFD livers were analyzed separately. FH: Uniform Manifold Approximation and Projection (UMAP; top) and t-distributed stochastic neighbor embedding (t-SNE; bottom) manifolds depicting the effect of diet (F, left), zonation (F, right), and scaled (G) and imputed (H) expression levels of indicated genes. LFD and HFD area (F, right), as well as the directionality of metabolic zonation (from portal to central; F, left), are indicated.
Figure 3.
Figure 3.
Isolation of genes showing diet- and zone-specific expression patterns. A: area-proportional Venn diagram depicting the relationship between diet-regulated genes and zone-specific genes. B and C: heat map analysis depicting gene expression across single-cell population. Single cells were clustered into 6 groups (thick columns) according to diet and zone. Diet-regulated genes (B) and zone-specific genes (C) were analyzed. D and E: network analysis of gene ontology-biological pathway (GO-BP; D) and Kyoto Encyclopedia of Genes and Genomes (KEGG; E) pathway enrichment terms, using ShinyGO (11). Pathways whose enrichment is significant (FDR < 0.05; top 20 terms) were presented as nodes. Two nodes are connected if they share 20% or more genes. Darker nodes are more significantly enriched gene sets. Bigger nodes represent larger gene sets. Thicker edges represent more overlapped genes. F and G: enrichment analysis of high-fat diet (HFD)-upregulated (left) and downregulated (right) genes, using clusterProfiler (53) with GO-BP, GO-molecular function (GO-MF), and KEGG databases. Color of bars indicates significance (P values), whereas length of bars indicates gene count. Color of circles indicate GO terms related to lipid metabolism (yellow), glucose metabolism (green), amino acid metabolism (blue), drug metabolism (purple), and PPAR pathway (black).
Figure 4.
Figure 4.
Isolation of genes that are substantially influenced by both diet and zonation. A and E: heat map analysis depicting gene expression across single-cell population. Cells were clustered into 6 groups according to diet and zone. High-fat diet (HFD)-downregulated (A) and -upregulated (E) genes that show periportal (zone 1-high; left in each panel) or pericentral (zone 3-high; right in each panel) patterns of expression were analyzed. BD, F, and G: analysis of single-cell gene expression in hepatocytes of each zone, expressed as means ± SE (scaled expression values). Data from low-fat diet (LFD) and HFD livers were analyzed separately. *P <0.05, **P <0.01, ***P <0.001, and ****P <0.0001 in Sidak’s multiple-comparison test. H: Cyp2f2 and Cyp1a2 protein expression was visualized through immunohistochemistry from serial sections of LFD and HFD mouse liver (left). Cyp2f2 and Cyp1a2 staining signals were artificially colored with red (1st row) and green (2nd row), respectively, to produce merged images (3rd row) of the serial liver sections. Cyp2f2- and Cyp1a2-positive areas were quantified (right). Scale bars, 200 µm. I: 3-dimensional PCA manifold depicting the single-cell expression levels of indicated genes. Individual dots represent single-cell transcriptome. The size of the dots represents the number of RNA features captured in the droplet. LFD and HFD area, as well as the directionality of metabolic zonation (from portal to central), are indicated in each manifold. Orange circles indicate the approximate position of zone 2 hepatocytes.
Figure 5.
Figure 5.
Spatial co-expression pattern of high-fat diet (HFD)-induced genes regulating lipid metabolism. A: 3-dimensional PCA manifold depicting the single-cell expression levels of indicated genes. Individual dots represent single-cell transcriptome. The size of the dots represents the number of RNA features captured in the droplet. Low-fat diet (LFD) and HFD area, as well as the directionality of metabolic zonation (from portal to central), are indicated in each manifold. B: analysis of single-cell gene expression in hepatocytes of each zone, expressed as means ± SE (scaled expression values). Data from LFD and HFD livers were analyzed separately. **P <0.01, ***P <0.001, and ****P <0.0001 in Sidak’s multiple-comparison test. C, G, and H: Elovl5, Apoa4, and Fabp1 protein expression was visualized through immunohistochemistry from serial sections of HFD mouse liver (C). Green arrows indicate areas of positive staining that are congruently observed across all three staining images. Elovl5-high (+) and -low (−) areas (dotted boxes) are magnified in G. Lipid droplet (LD) size (n ≥ 479; H, top) and area (n = 7; H, bottom) in Elovl5-high and -low areas were quantified. Data are expressed as a box plot [arbitrary unit (AU); top] or means ± SE (%area; bottom) with individual data points. Student’s t tests failed to detect a significant difference between the 2 groups (NS). Scale bars, 100 µm. DF: correlation between expression levels of Elovl5, Apoa4, and Fabp1 genes from scaled (D), saver-imputed (E), and magic-imputed (F) droplet-based, single-cell RNA sequencing (Drop-seq) data set. Individual dots represent single-cell expression levels colored by diet, zone, sample information, and level of total RNA counts (nCount_RNA).
Figure 6.
Figure 6.
High-fat diet (HFD) induces zone 3 hepatocytes to express genes promoting lipid droplet accumulation. A and B: serial sections of HFD mouse liver were stained with zone 1 marker Cyp2f2 (A, top) and zone 2 marker Cyp1a2 (A, bottom). Boxed areas in A were magnified at right. Lipid droplet (LD) size (n ≥ 535; B, left) and area (n = 7; B, right) in each compartment were quantified. Data are expressed as box plot [arbitrary units (AU); left] or means ± SEM (%area; right) with individual data points. Student’s t tests were used to examine significant differences between the 2 groups (**P <0.01 ). Scale bars, 100 µm. C: Fresh frozen sections from low-fat diet (LFD) and HFD mouse liver were immunostained to visualize Cyp2f2 (red), LDs (green, stained by BODIPY 493/503), and DNA (blue, by DAPI). DF and I: analysis of single-cell gene expression in hepatocytes of each zone, expressed as means ± SE (scaled expression values). Data from LFD and HFD livers were analyzed separately. *P <0.05, **P <0.01, ***P <0.001, and ****P <0.0001 in Sidak’s multiple-comparison test. G: Ketogenic genes induced by HFD in zone 3 hepatocytes are presented in a pathway diagram. H: network analysis of gene ontology-biological pathway (GO-BP) enrichment terms in the HFD-downregulated zone 1-specific gene list, using ShinyGO (11). Pathways whose enrichment is significant (FDR < 0.05) are presented as nodes. Two nodes are connected if they share 20% or more genes. Darker nodes are more significantly enriched gene sets. Bigger nodes represent larger gene sets. Thicker edges represent more overlapped genes.
Figure 7.
Figure 7.
Holistic understanding of heterogeneous hepatocyte responses to high-fat diet (HFD). The schematic diagram depicts the heterogeneous effect of HFD on single hepatocellular gene expression. Our data set indicates that the entire hepatocyte population undergoes substantial transcriptome changes upon HFD and that the patterns of alteration were highly heterogeneous across the hepatocyte population with zonation-dependent and -independent effects.

Similar articles

Cited by

References

    1. Lazo M, Hernaez R, Eberhardt MS, Bonekamp S, Kamel I, Guallar E, Koteish A, Brancati FL, Clark JM. Prevalence of nonalcoholic fatty liver disease in the United States: the Third National Health and Nutrition Examination Survey, 1988–1994. Am J Epidemiol 178: 38–45, 2013. doi:10.1093/aje/kws448. - DOI - PMC - PubMed
    1. Michelotti GA, Machado MV, Diehl AM. NAFLD, NASH and liver cancer. Nat Rev Gastroenterol Hepatol 10: 656–665, 2013. doi:10.1038/nrgastro.2013.183. - DOI - PubMed
    1. Xiong X, Kuang H, Ansari S, Liu T, Gong J, Wang S, Zhao X-Y, Ji Y, Li C, Guo L, Zhou L, Chen Z, Leon-Mimila P, Chung MT, Kurabayashi K, Opp J, Campos-Pérez F, Villamil-Ramírez H, Canizales-Quinteros S, Lyons R, Lumeng CN, Zhou B, Qi L, Huertas-Vazquez A, Lusis AJ, Xu XZS, Li S, Yu Y, Li JZ, Lin JD. Landscape of intercellular crosstalk in healthy and NASH liver revealed by single-cell secretome gene analysis. Mol Cell 75: 644–660.e5, 2019. doi:10.1016/j.molcel.2019.07.028. - DOI - PMC - PubMed
    1. Dobie R, Wilson-Kanamori JR, Henderson BEP, Smith JR, Matchett KP, Portman JR, Wallenborg K, Picelli S, Zagorska A, Pendem SV, Hudson TE, Wu MM, Budas GR, Breckenridge DG, Harrison EM, Mole DJ, Wigmore SJ, Ramachandran P, Ponting CP, Teichmann SA, Marioni JC, Henderson NC. Single-cell transcriptomics uncovers zonation of function in the mesenchyme during liver fibrosis. Cell Rep 29: 1832–1847, 2019. e1838doi:10.1016/j.celrep.2019.10.024. - DOI - PMC - PubMed
    1. Krenkel O, Hundertmark J, Ritz TP, Weiskirchen R, Tacke F. Single cell RNA sequencing identifies subsets of hepatic stellate cells and myofibroblasts in liver fibrosis. Cells 8: 503, 2019. doi:10.3390/cells8050503. - DOI - PMC - PubMed

Publication types

MeSH terms