. 2021 Feb 1;218(2):e20200487.
doi: 10.1084/jem.20200487.

Multi-transcription factor reporter mice delineate early precursors to the ILC and LTi lineages

Affiliations

Multi-transcription factor reporter mice delineate early precursors to the ILC and LTi lineages

Darshan N Kasal et al. J Exp Med. .

Abstract

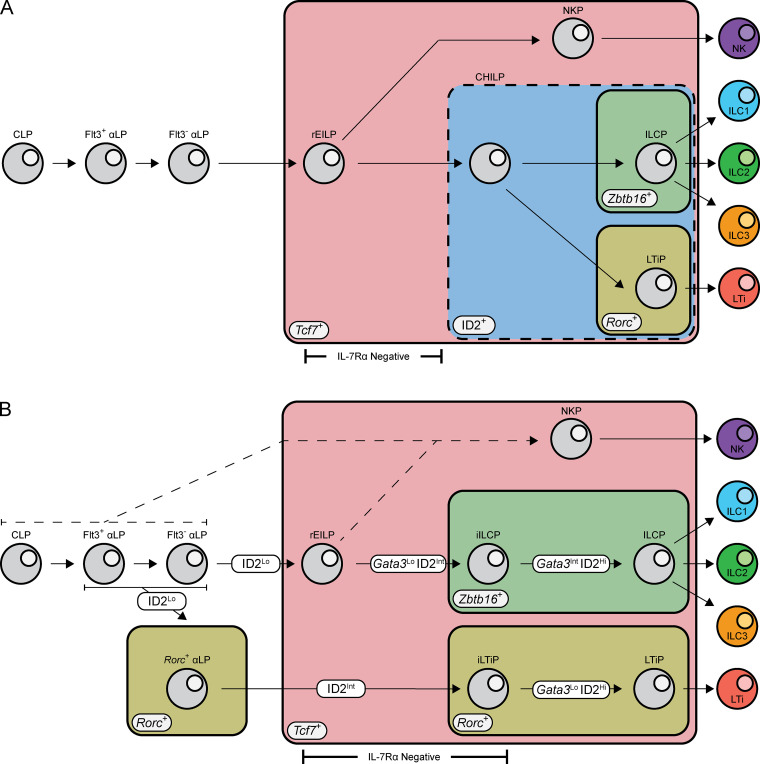
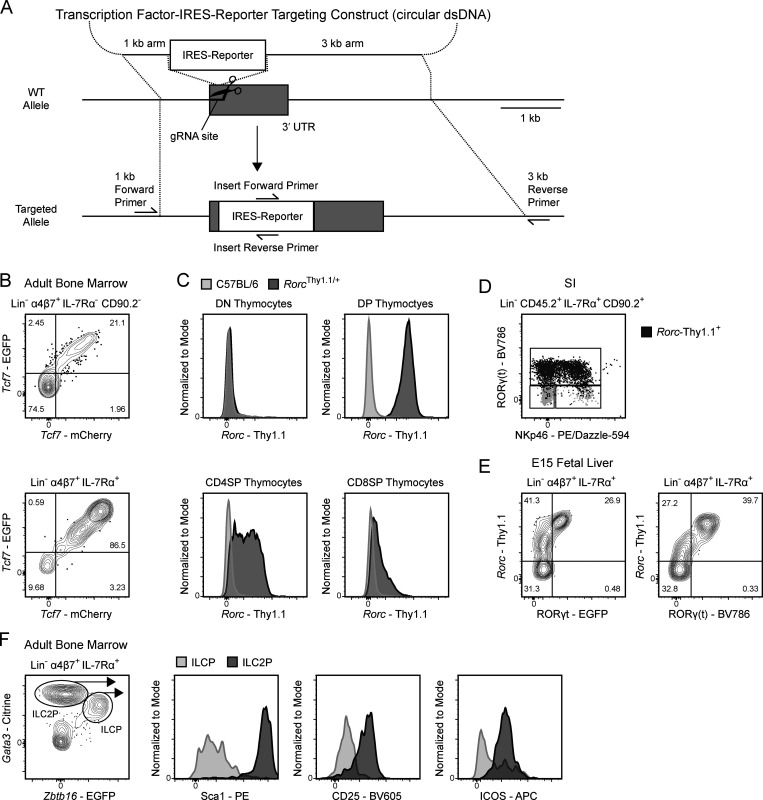
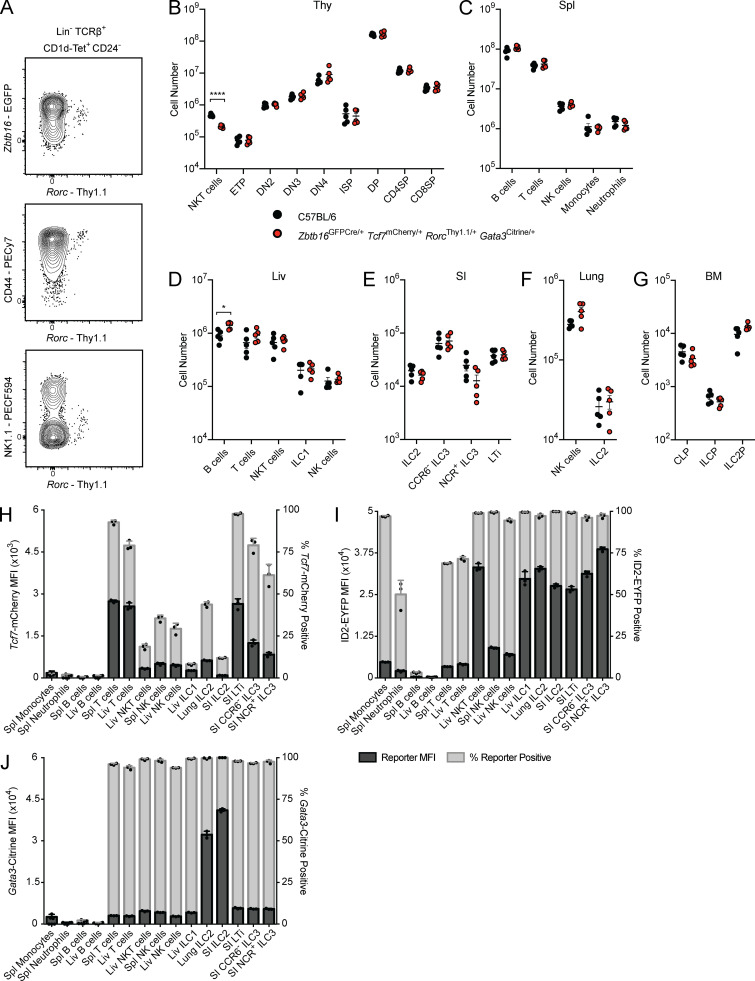
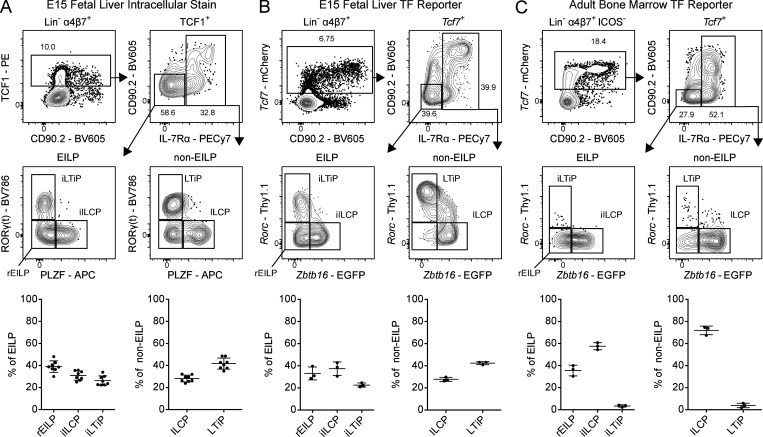
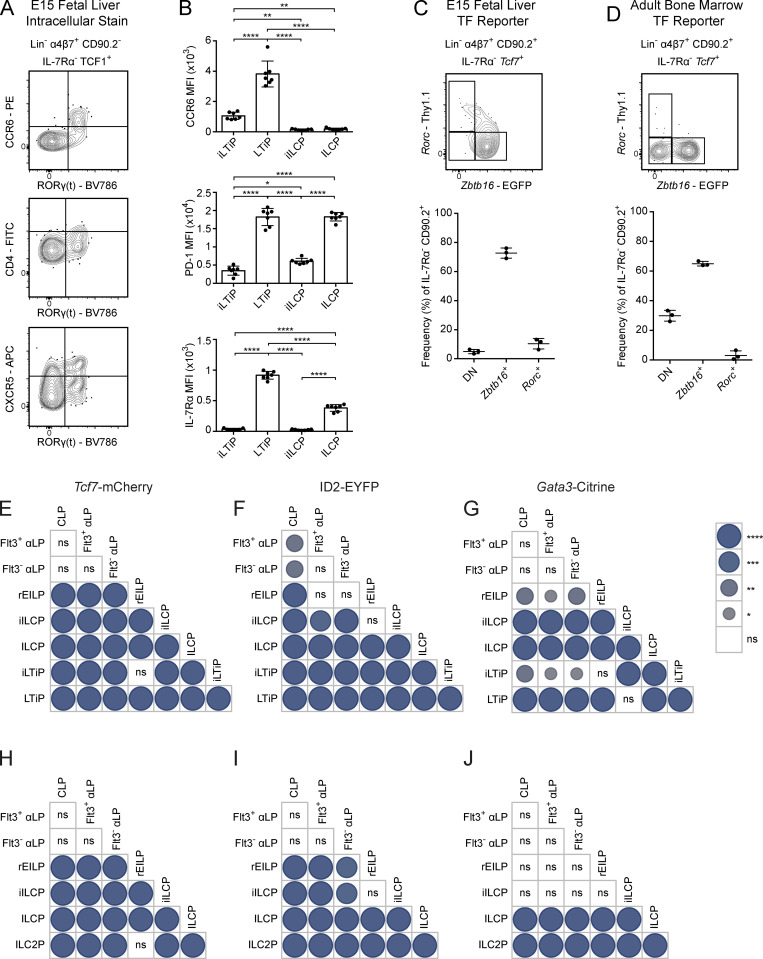
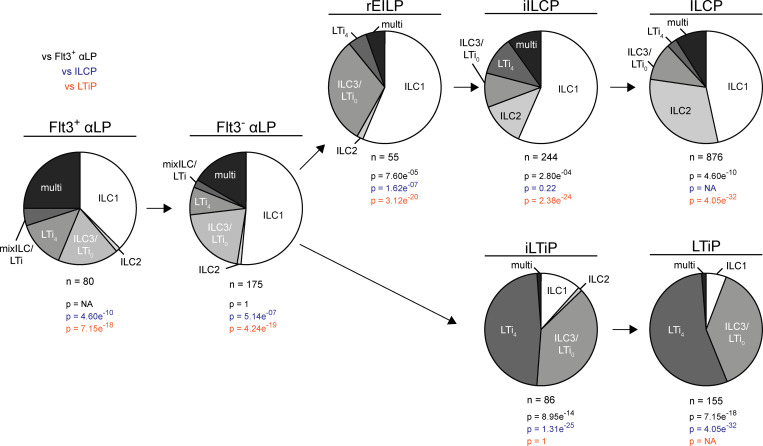
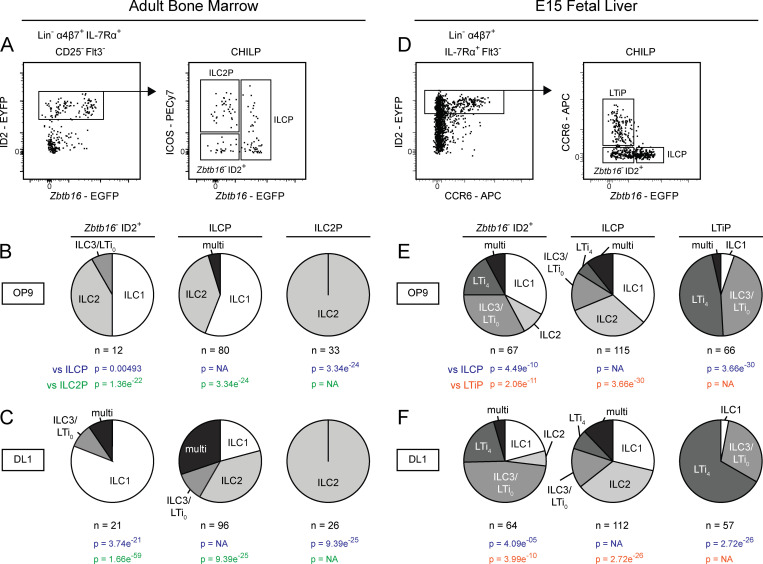
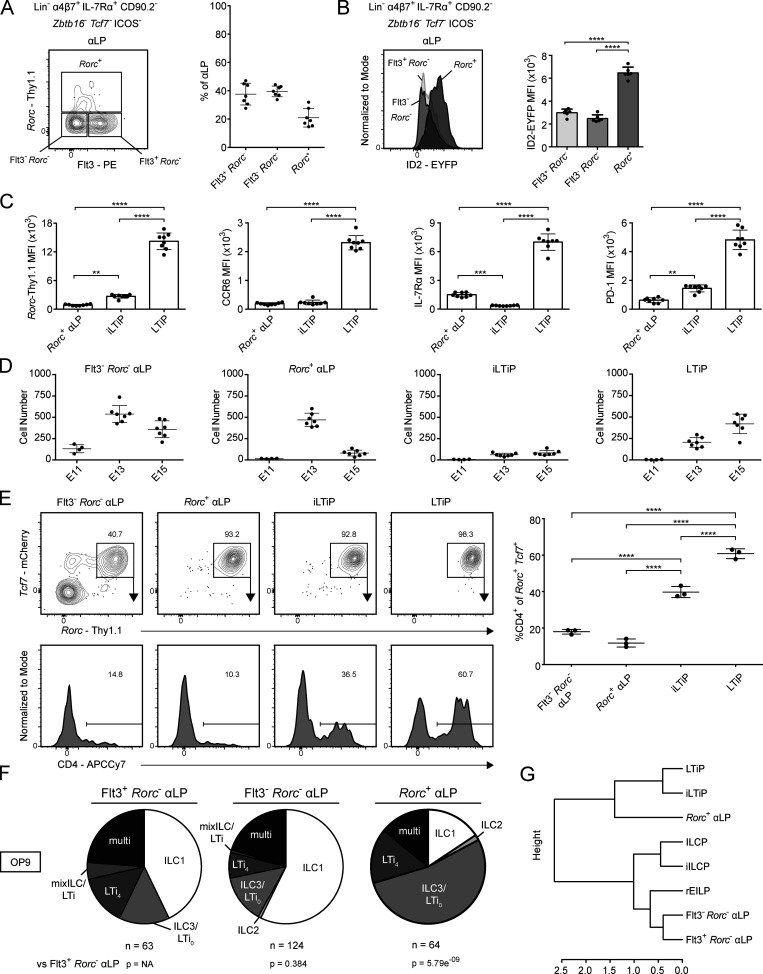
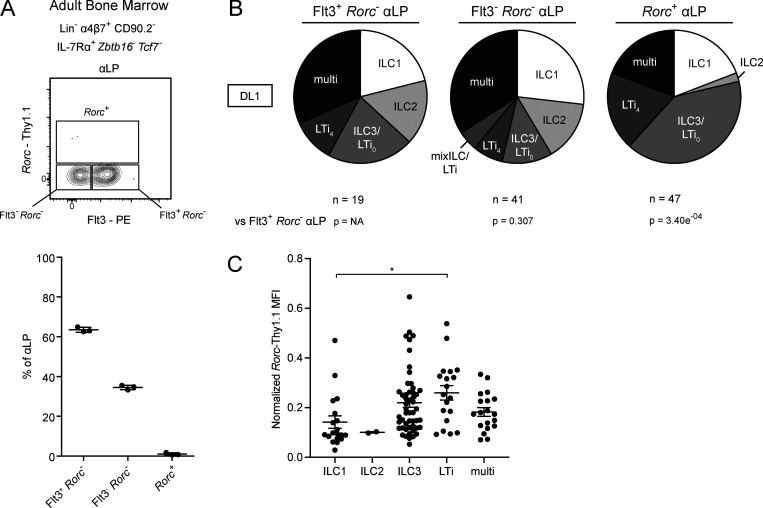
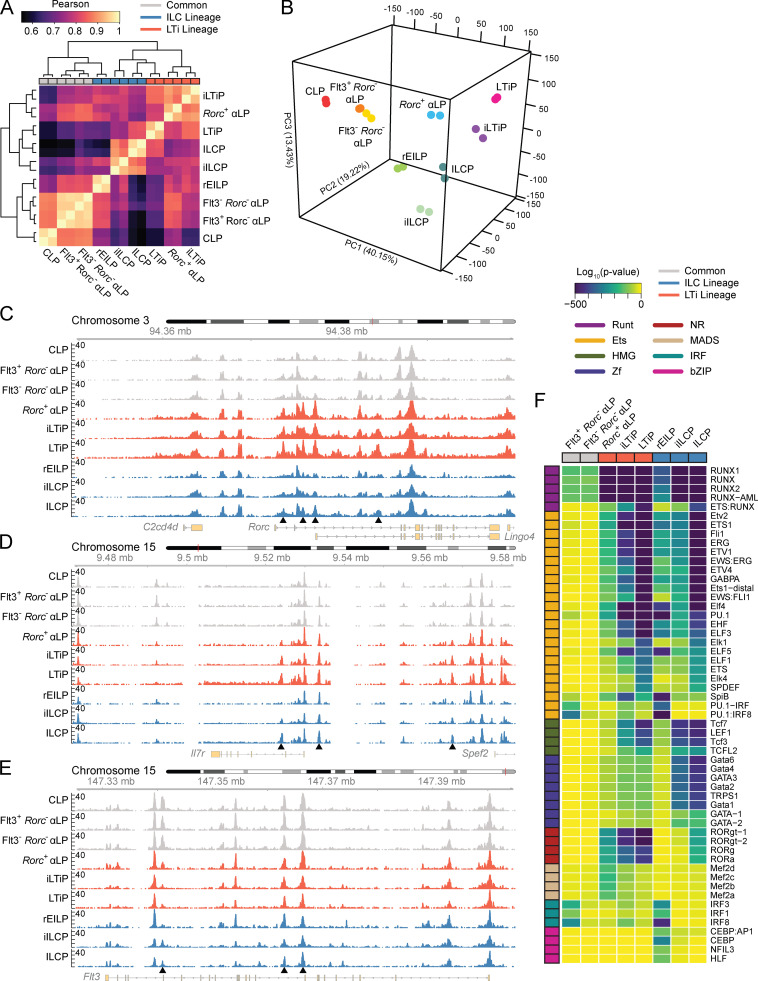
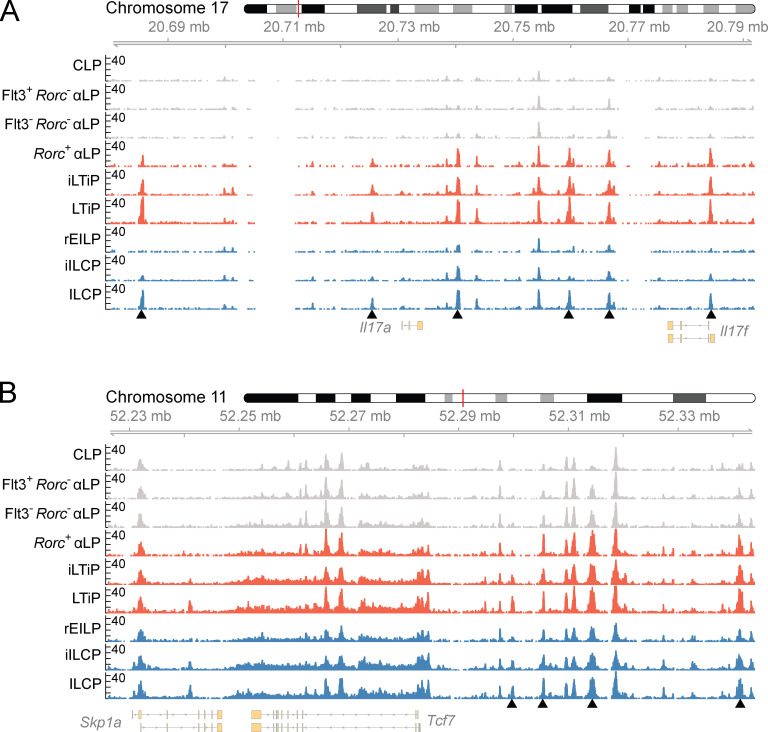
Transcription factor (TF) reporter mice have proved integral to the characterization of murine innate lymphoid cell (ILC) development and function. Here, we implemented a CRISPR/Cas9-generated combinatorial reporter approach for the simultaneous resolution of several key TFs throughout ILC development in both the fetal liver and adult bone marrow. We demonstrate that the Tcf7-expressing early innate lymphoid precursor (EILP) and the common helper ILC precursor (CHILP) both contain a heterogeneous mixture of specified ILC and lymphoid tissue inducer (LTi) precursors with restricted lineage potential rather than a shared precursor. Moreover, the earliest specified precursor to the LTi lineage was identified upstream of these populations, before Tcf7 expression. These findings match dynamic changes in chromatin accessibility associated with the expression of key TFs (i.e., GATA3 and RORγ(t)), highlighting the distinct origins of ILC and LTi lineages at the epigenetic and functional levels, and provide a revised map for ILC development.


Conflict of interest statement

Disclosures: The authors declare no competing interests exist.

Figures

Figure S1.
Figure S1.
Current and revised models for ILC development. (A) In the current model, CLP give rise to αLP, gaining α4β7 expression and progressively losing Flt3. The EILP, identified by Tcf7 expression and the lack of IL-7Rα, arises downstream of the αLP generating all known ILC subsets. The CHILP, identified by high ID2 expression, is downstream of the EILP generating ILC and LTi lineage cells. The ILCP, identified by Zbtb16 expression, and LTiP, identified by Rorc, both arise from the CHILP and generate ILC1/2/3 or LTi, respectively. (B) In the revised model, CLP give rise to αLP, gaining α4β7 expression and progressively losing Flt3. Bifurcation into the ILC and LTi lineage occurs within the αLP stage and is marked by low expression of ID2 and the early expression of Rorc within the αLP. Expression of ID2 increases to intermediate levels as cells mature, coinciding with the transient down-regulation of IL-7Rα expression. Expression of Zbtb16 in the iILCP and further up-regulation of Rorc in the iLTiP along with differential Gata3 up-regulation mark the restriction of cellular potential. High expression of ID2 and augmented Gata3 expression coincides with IL-7Rα reexpression as cells further differentiate toward the ILCP and LTiP.
Figure 1.
Figure 1.
Generation of the novel TF reporter mice. (A) Design of CRISPR/Cas9 knock-in strategy. (B–F) Representative flow plots of ILC progenitors from a Tcf7EGFP × Tcf7mCherry adult BM (B), thymocytes from a RorcThy1.1 adult thymus (C), mature ILCs from a RorcThy1.1 SI lamina propria with Rorc-Thy1.1+ cells overlaid in dark gray and total ILCs in light gray (D), ILC progenitors from a RorcThy1.1 x RORγtEGFP E15 FL with RORγ(t) intracellular staining (E), and ILC progenitors from Gata3Citrine adult BM (F). Data are representative of at least two independent experiments (B–F). DN, double negative; DP, double positive; dsDNA, double-strand DNA.
Figure S2.
Figure S2.
Immune phenotyping of Tcf7mCherry, RorcThy1.1, Gata3Citrine, and ID2EYFP reporters. (A–G) Expression of Rorc-Thy1.1 in thymic NKT cells from Zbtb16EGFPCreRorcThy1.1 adult mice. Cell numbers from adult C57BL/6 and Zbtb16EGFPCre/+Tcf7mCherry/+RorcThy1.1/+Gata3Citrine/+ mice taken from the thymus (Thy; B), spleen (Spl; C), liver (Liv; D), SI (E), lung (F), and BM (G; n = 5). Each symbol represents an individual mouse; data are presented as mean ± SEM. Q-values were calculated with multiple t tests controlling for false discovery rate. (H–J) Reporter MFI and frequency of reporter positive cells in the indicated populations from select tissues of Zbtb16EGFPCreTcf7mCherry (H), Zbtb16EGFPCreTcf7mCherryID2EYFP (I), and Zbtb16EGFPCreTcf7mCherryGata3Citrine (J) adult mice (n = 3). Each symbol represents an individual mouse. Data are representative of (A) or pooled from (B–J) at least two independent experiments. *, Q < 0.05; ****, Q < 0.0001. ETP, early thymic precursor; DN, double negative; ISP, immature single positive; DP, double positive; SP, single positive.
Figure 2.
Figure 2.
Characterization of TF expression in the FL EILP. (A) Intracellular staining for TCF1, PLZF, and RORγ(t) TFs in C57BL/6 E15 FL (n = 8). (B) Representative flow cytometry plots of ILC progenitors from a Zbtb16EGFPCreTcf7mCherryRorcThy1.1 E15 FL (n = 3). (C) Representative flow cytometry plots of ILC progenitors from a Zbtb16EGFPCreTcf7mCherryRorcThy1.1 adult BM (n = 3). Associated plots reflect population frequencies; each symbol represents an individual FL or BM; data are presented as mean ± SEM. Data are representative of or pooled from at least two independent experiments.
Figure S3.
Figure S3.
Analysis of ILC and LTi maturation markers on iILCP and iLTiP. (A) Representative flow cytometry plots of the EILP from a C57BL/6 E15 FL stained for the indicated surface markers and intracellular RORγ(t) (n = 4). (B) MFI of CCR6, PD-1, and IL-7Rα on the iLTiP, LTiP, iILCP, and ILCP from a Zbtb16EGFPCreTcf7mCherryRorcThy1.1 E15 FL (n = 7). Each symbol represents an individual FL; data are presented as mean ± SEM. (C) Representative flow cytometry plots of ILC progenitors from a Zbtb16EGFPCreTcf7mCherryRorcThy1.1 E15 FL (n = 3). (D) Representative flow cytometry plots of ILC progenitors from a Zbtb16EGFPCreTcf7mCherryRorcThy1.1 adult BM (n = 3). Associated plots reflect population frequencies; each symbol represents an individual FL or BM; data are presented as mean ± SEM. (E–J) Pairwise comparisons of Tcf7-mCherry, ID2-EYFP, and Gata3-Citrine reporter expression MFI from Fig. 3 plots for FL (E–G) and BM (H–J) precursors. Circle size and color denote level of significance. Data are representative of (A) or pooled from (B–J) at least two independent experiments. Pairwise comparison P values were calculated by one-way ANOVA with Tukey’s multiple comparisons test *, P < 0.05; **, P < 0.01; ***, P < 0.001; ****, P < 0.0001; ns, not significant.
Figure 3.
Figure 3.
TF reporter expression in FL and adult BM ILC progenitors. (A–F) Representative histogram plots of Tcf7-mCherry, ID2-EYFP, and Gata3-Citrine reporter expression in the indicated ILC progenitors from (A) Zbtb16EGFPCreTcf7mCherryRorcThy1.1 E15 FLs (n = 3), (B) Zbtb16EGFPCreTcf7mCherryRorcThy1.1ID2EYFP E15 FLs (n = 6), (C) Zbtb16EGFPCreTcf7mCherryRorcThy1.1Gata3Citrine E15 FLs (n = 3), (D) Zbtb16EGFPCreTcf7mCherry adult BM, (E) Zbtb16EGFPCreTcf7mCherryRorcThy1.1ID2EYFP adult BM (n = 3), and (F) Zbtb16EGFPCreTcf7mCherryRorcThy1.1Gata3Citrine adult BM (n = 3). Associated plots reflect population median fluorescent intensity (MFI); each symbol represents an individual FL or BM; data are presented as mean ± SEM; pairwise comparison P values are presented in Fig. S3, E–J, and were calculated by one-way ANOVA with Tukey’s multiple comparisons test. Data are representative of or pooled from at least two independent experiments.
Figure 4.
Figure 4.
Clonal potential of FL ILC progenitors. Single-cell potential of the indicated ILC progenitors sorted from Zbtb16EGFPCreTcf7mCherryRorcThy1.1 E14-E16 FLs onto OP9 stromal cells. Pie charts represent the frequency of single ILC1 (NK1.1+ICOSα4β7), ILC2 (NK1.1ICOS+α4β7), and ILC3/LTi0 (NK1.1ICOS+/−α4β7+CD4); two or more ILC subsets (multi); LTi4 (NK1.1ICOS+/−α4β7+CD4+); and mixed ILC1/2/3/LTi0 and LTi4 (mixILC/LTi). Data are pooled from >20 independent experiments. P values for pie charts were calculated using Chi-Square Test for Independence followed by post-hoc analysis with Bonferroni correction; comparisons were made against the Flt3+ αLP (black), ILCP (blue), and LTiP (orange).
Figure 5.
Figure 5.
Clonal analysis of the CHILP from adult BM and FL. (A–C) Index gating strategy for the CHILP from Zbtb16EGFPCreID2EYFP adult BM. Pie charts represent the frequency of single ILC1, ILC2, ILC3/LTi0; two or more ILC subsets (multi); LTi4; and mixed ILC1/2/3/LTi0 and LTi4 (mixILC/LTi) on OP9 (B) and OP9-DL1 (C) stromal cells. (D) Index gating strategy for the CHILP from Zbtb16EGFPCreID2EYFP E14-E16 FL. (E and F) Pie charts represent the frequency of single ILC1, ILC2, ILC3/LTi0; two or more ILC subsets (multi); LTi4; and mixed ILC1/2/3/LTi0 and LTi4 (mixILC/LTi) on (E) OP9 and (F) OP9-DL1 stromal cells. Early T cells were identified in OP9-DL1 cultures by high expression of CD25+; T cell–only wells were excluded from pie charts, while ILC+T cell wells were included with the appropriate ILC classification. Data are representative of (A and D) or pooled from (B, C, E, and F) four independent experiments. P values for pie charts were calculated using Chi-Square Test for Independence followed by post-hoc analysis with Bonferroni correction; comparisons were made against the ILCP (blue), ILC2P (green), and LTiP (orange).
Figure 6.
Figure 6.
Identification of Rorc expression in the FL αLP. (A) Representative flow cytometry plot of αLP from Zbtb16EGFPCreTcf7mCherryRorcThy1.1 E15 FL (n = 7). Adjacent plot reflects population frequencies. (B) Representative histogram plot of ID2-EYFP expression in the indicated ILC progenitors from Zbtb16EGFPCreTcf7mCherryRorcThy1.1ID2EYFP E15 FL (n = 6). Associated plots reflect population MFI. (C) MFI of Rorc-Thy1.1, CCR6, IL-7Rα, and PD-1 on Rorc+ αLP, iLTiP, and LTiP from Zbtb16EGFPCreTcf7mCherryRorcThy1.1 E15 FL (n = 8). (D) Quantification of Flt3 Rorc αLP, Rorc+ αLP, iLTiP, and LTiP from Zbtb16EGFPCreTcf7mCherryRorcThy1.1 FL at E11, E13, and E15. (E) Representative flow plots and histograms of bulk cultured Flt3Rorc αLP, Rorc+ αLP, iLTiP, and LTiP from Zbtb16EGFPCreTcf7mCherryRorcThy1.1 E15 FL cultured for 2 d on OP9 stromal cells (n = 3). Adjacent plot reflects CD4+ frequency among Rorc+Tcf7+ cells. (F) Single-cell potential of the indicated αLP precursors sorted from Zbtb16EGFPCreTcf7mCherryRorcThy1.1 E15 FL onto OP9 stromal cells. (G) Hierarchical clustering dendrogram of ILC progenitor clonal potential on OP9 stromal cells calculated from Pearson correlation. For plots, each symbol represents an individual FL; data are presented as mean ± SEM; and P values were determined by one-way ANOVA with Tukey’s multiple comparisons test. P values for pie charts were calculated using Chi-Square Test for Independence followed by post-hoc analysis with Bonferroni correction; comparisons were made against the Flt3+ Rorc αLP (black). Data are pooled from at least two independent experiments. **, P < 0.01; ***, P < 0.001; ****, P < 0.0001.
Figure S4.
Figure S4.
Analysis of Rorc+ αLP. (A) Representative flow cytometry plot of αLP from Zbtb16EGFPCreTcf7mCherryRorcThy1.1 adult BM (n = 3). Associated plot reflects population frequencies; each symbol represents an individual BM; data are presented as mean ± SEM. (B) Single-cell potential of the indicated αLP precursors sorted from Zbtb16EGFPCreTcf7mCherryRorcThy1.1 E15 FL onto OP9-DL1 stromal cells. Early T cells were identified in OP9-DL1 cultures by high expression of CD25+; T cell–only wells were excluded from charts, while ILC+T cell wells were included with the appropriate ILC. (C) Normalized Rorc-Thy1.1 MFI of index-sorted single Rorc+ αLP categorized by in vitro potential on OP9 and OP9-DL1. Data were normalized by experiment to average LTiP Rorc-Thy1.1 MFI; data are presented as mean ± SEM; and P values were determined by one-way ANOVA with Tukey’s multiple comparisons test. Data are pooled from two (A and B) or four (C) independent experiments. P values for pie charts were calculated using Chi-Square Test for Independence followed by post-hoc analysis with Bonferroni correction; comparisons were made against the Flt3+ Rorc αLP (black). *, P < 0.05.
Figure 7.
Figure 7.
Chromatin accessibility of FL ILC progenitors. (A) Correlation heatmap for FL ILC progenitor ATAC-seq samples (n = 2). Precursors are categorized by in vitro clonal potential. (B–E) 3D principal component (PC) analysis of ATAC-seq data. Accessibility coverage tracks at the indicated loci in FL ILC progenitors: Rorc (C), Il7r (D), and Flt3 (E). Black arrow heads indicate regions of dynamic chromatin accessibility. (F) Developmental trajectory heatmap of TF motif enrichment derived from comparing the indicated FL ILC progenitor to the CLP. Motifs were plotted if they exhibited a log10(P value) ≤ −100 and a signal-to-noise ratio ≥1.5 in at least one comparison. Data represents two samples per cell type and were collected across seven independent experiments.
Figure S5.
Figure S5.
Chromatin accessibility profiles of FL ILC progenitors. (A and B) Accessibility coverage tracks at the (A) Il17a/Il17f and (B) Tcf7 loci in FL ILC progenitors. Black arrow heads indicate regions of dynamic chromatin accessibility. Data represents two samples per cell type and were collected across seven independent experiments.

Similar articles

Cited by

References

    1. Allman, D., Sambandam A., Kim S., Miller J.P., Pagan A., Well D., Meraz A., and Bhandoola A.. 2003. Thymopoiesis independent of common lymphoid progenitors. Nat. Immunol. 4:168–174. 10.1038/ni878 - DOI - PubMed
    1. Buenrostro, J.D., Wu B., Chang H.Y., and Greenleaf W.J.. 2015a. ATAC-seq: a method for assaying chromatin accessibility genome-wide. Curr. Protoc. Mol. Biol. 109:1–9. 10.1002/0471142727.mb2129s109 - DOI - PMC - PubMed
    1. Buenrostro, J.D., Wu B., Litzenburger U.M., Ruff D., Gonzales M.L., Snyder M.P., Chang H.Y., and Greenleaf W.J.. 2015b. Single-cell chromatin accessibility reveals principles of regulatory variation. Nature. 523:486–490. 10.1038/nature14590 - DOI - PMC - PubMed
    1. Chea, S., Schmutz S., Berthault C., Perchet T., Petit M., Burlen-Defranoux O., Goldrath A.W., Rodewald H.-R., Cumano A., and Golub R.. 2016. Single-Cell Gene Expression Analyses Reveal Heterogeneous Responsiveness of Fetal Innate Lymphoid Progenitors to Notch Signaling. Cell Rep. 14:1500–1516. 10.1016/j.celrep.2016.01.015 - DOI - PubMed
    1. Cherrier, M., Sawa S., and Eberl G.. 2012. Notch, Id2, and RORγt sequentially orchestrate the fetal development of lymphoid tissue inducer cells. J. Exp. Med. 209:729–740. 10.1084/jem.20111594 - DOI - PMC - PubMed

Publication types