. 2021 Jun;529(8):1863-1875.
doi: 10.1002/cne.25061. Epub 2020 Nov 23.

Projections of ipRGCs and conventional RGCs to retinorecipient brain nuclei

Affiliations

Projections of ipRGCs and conventional RGCs to retinorecipient brain nuclei

Corinne Beier et al. J Comp Neurol. 2021 Jun.

Abstract

Retinal ganglion cells (RGCs), the output neurons of the retina, allow us to perceive our visual environment. RGCs respond to rod/cone input through the retinal circuitry, however, a small population of RGCs are in addition intrinsically photosensitive (ipRGCs) and project to unique targets in the brain to modulate a broad range of subconscious visual behaviors such as pupil constriction and circadian photoentrainment. Despite the discovery of ipRGCs nearly two decades ago, there is still little information about how or if conventional RGCs (non-ipRGCs) target ipRGC-recipient nuclei to influence subconscious visual behavior. Using a dual recombinase fluorescent reporter strategy, we showed that conventional RGCs innervate many subconscious ipRGC-recipient nuclei, apart from the suprachiasmatic nucleus. We revealed previously unrecognized stratification patterns of retinal innervation from ipRGCs and conventional RGCs in the ventral portion of the lateral geniculate nucleus. Further, we found that the percent innervation of ipRGCs and conventional RGCs across ipsi- and contralateral nuclei differ. Our data provide a blueprint to understand how conventional RGCs and ipRGCs innervate different brain regions to influence subconscious visual behaviors.

Keywords: Circadian rhythms; Melanopsin; Parallel pathways; Pupillary light response; Retinofugal projections; Retinohypothalamic tract; ipRGCs; nonimage forming visual functions.


Figures

Figure 1.
Figure 1.. Experiment design and verification
(a) Schematic detailing experiment strategy. AAV2-hSyn-Flpo is injected intravitreally into one eye of adult Opn4Cre/+;Rosa26CAG-tdTomato-eGFP/+ mice. Conventional RGC (magenta) and ipRGC (green) projections can be visualized in retinorecipient nuclei. (b) Immunostaining of GFP and RFP in the retina of the eye without intravitreal injection (left eye) in Opn4Cre/+;Rosa26CAG-tdTomato-eGFP/+ mice. No cells are labeled. Scale bar 1000 μm. (c) Immunostaining of GFP (green) and RFP (magenta) in the retina of the eye that received intravitreal viral injection in Opn4Cre/+;Rosa26CAG-tdTomato-eGFP/+ mice. Scale bar 1000 μm. (d) Detail view from location indicated in (c). Melanopsin (Opn4) antibody stains a subset of cells (cyan, arrows). All melanopsin-positive cells are GFP-positive (green). RFP-positive cells (magenta) do not overlap with melanopsin- or GFP-positive cells. Scale bar 100 μm. (e) Most ganglion cells (86.5 ± 6.5 %) are labeled after an intravitreal injection. RBPMS antibody stains all retinal ganglion cells (cyan). Most RBPMS positive cells are also positive for either GFP (green) or RFP (magenta). Some ganglion cells are not labeled by the intravitreal injection (dashed circles).
Figure 2.
Figure 2.. ipRGC and conventional RGC projections in the SCN
ipRGC (green) and conventional RGC (magenta, inset) innervation to the suprachiasmatic nucleus (SCN). ipRGC input is uniform across the contra (left) and ipsilateral (right) lobes (dashed outlines). Scale bars 100 μm.
Figure 3.
Figure 3.. ipRGC and conventional RGC projections in the SC
(a) ipRGC (green) and conventional RGC (magenta) innervation to the contralateral (left) and ipsilateral (right) superior colliculus (SC). Conventional RGC and ipRGC innervation to the ipsilateral SC overlap (inset). Scale bar 500 μm. (b-c) Quantification of conventional RGC and ipRGC innervation overlap in the contralateral (b) and ipsilateral (c) SC. (See Methods for overlap calculation, Mean ± SEM quantified from n = 2–4 coronal brain slices from n = 4 mice). ipRGC innervation overlaps with conventional RGC innervation 97±3% of the time in the contralateral SC and 78±8% of the time in the ipsilateral SC.
Figure 4.
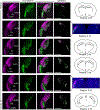
Figure 4.. ipRGC and conventional RGC projections to the geniculate complex
Conventional RGC (magenta) and ipRGC (green) innervation to the contralateral and ipsilateral geniculate. The dorsal lateral geniculate nucleus (dLGN) and the ventral LGN (vLGN) are separated by a thin region, the intergeniculate leaflet (IGL). Retinal innervations to the contralateral dLGN and vLGN are outlined (dashed lines). Scale bars 500 μm. Sections are displayed top to bottom, from rostral to caudal, with distances from Bregma listed far right.
Figure 5.
Figure 5.. Ipsilateral ipRGC and conventional RGC projections to the geniculate complex
(a-c) The projection in percent of ipRGC (green) and conventional RGC (cRGCs, magenta) innervation to the dorsal lateral geniculate nucleus (dLGN), the intergeniculate leaflet (IGL), and the ventral LGN (vLGN). Ipsilateral innervation between ipRGCs and conventional RGCs was not significantly different except in the caudal IGL. See Methods for ipsilateral projection calculation. Individual points show the ipsilateral projection calculated from a single coronal brain slice (n = 1–2 slices from n = 4 mice per group, Anova one way, post hoc Bonferroni, p < 0.05 indicated by * and p > 0.05 shown as n.s.). (d-e) Detailed view of conventional RGC (magenta) and ipRGC (green) innervation to the rostral (d) and caudal (e) ipsilateral vLGN and IGL, as seen in Figure 4. The approximate area of retinal innervation from the contralateral eye to the vLGN is outlined (dashed lines). The IGL is indicated by arrows between the vLGN and dLGN. Scale bars 100 μm.
Figure 6.
Figure 6.. ipRGC and conventional RGC projections to the contralateral vLGN and IGL
Conventional RGC (magenta) and ipRGC (green) innervation to the contralateral ventral lateral geniculate nucleus (vLGN) and intergeniculate leaflet (IGL). Retinal innervation to the vLGN is outlined (dashed lines). The IGL is indicated by arrows between the vLGN and dorsal LGN (dLGN). Scale bars 100 μm.
Figure 7.
Figure 7.. Stratification of ipRGCs and conventional RGCs in the dLGN and vLGN
(a) Schematic summarizing quantification of the stratification of ipRGCs (green) and conventional RGCs (cRGCs, magenta) in the dorsal and ventral lateral geniculate nucleus (dLGN and vLGN). (b-d) Quantification of the innervation of ipRGCs (green) and conventional RGCs (magenta) in the rostral, medial, and caudal dLGN as distance from the lateral edge of the optic tract towards the medial edge of the dLGN. ipRGC innervation is concentrated towards the medial edge of the dLGN but overlaps with conventional RGC innervation. (e-g) Same as in (b-d) except innervation of the vLGN is shown. Conventional RGCs overlap with ipRGC innervation in the rostral vLGN (e) but segregate in the medial (f) and caudal vLGN (g).
Figure 8.
Figure 8.. ipRGC and conventional RGC projections to the OPN
ipRGC (green) and conventional RGC (magenta) innervation to the contralateral and ipsilateral olivary pretectal nucleus (OPN). Retinal innervation to the OPN is outlined (dashed lines). Scale bars 100 μm.
Figure 9.
Figure 9.. ipRGC and conventional RGC projections to the PHb
(a) ipRGC (green) and conventional RGC (magenta, inset) innervation to the contralateral peri habenula (PHb). Dashed lines indicate the border between the hippocampus and the lateral habenula (LHb). (b) Another example of PHb innervation. Scale bars 100 μm.
Figure 10.
Figure 10.. ipRGC and conventional RGC projections to the ZI
(a) ipRGC (green) and conventional RGC (magenta, inset) innervation to the contralateral zona incerta (ZI). Arrowhead indicates retinal innervation to the peripeduncular nucleus. Retinal innervation to the zona incerta lies between the arrows. Dashed line outlines the cerebral peduncle along the optic tract (ot) and the ZI. (b) Another example of ZI innervation. Scale bars 100 μm.
Figure 11.
Figure 11.. ipRGC and conventional RGC projections to the SON
(a) ipRGC (green) and conventional RGC (magenta) innervation to the contralateral supraoptic nucleus (SON). Above the optic tract, retinal innervation to the SON is outlined (dashed line). (b) Another example of SON innervation. Scale bars 100 μm.

References

    1. Altimus CM, Güler AD, Villa KL, McNeill DS, Legates TA, and Hattar S. (2008). Rods-cones and melanopsin detect light and dark to modulate sleep independent of image formation. Proc. Natl. Acad. Sci. U. S. A 105, 19998–20003. - PMC - PubMed
    1. Baver SB, Pickard GE, Sollars PJ, and Pickard GE (2008). Two types of melanopsin retinal ganglion cell differentially innervate the hypothalamic suprachiasmatic nucleus and the olivary pretectal nucleus. Eur. J. Neurosci 27, 1763–1770. - PubMed
    1. Chen S-K, Badea TC, and Hattar S. (2011). Photoentrainment and pupillary light reflex are mediated by distinct populations of ipRGCs. Nature 476, 92–95. - PMC - PubMed
    1. Chew KS, Renna JM, McNeill DS, Fernandez DC, Keenan WT, Thomsen MB, Ecker JL, Loevinsohn GS, VanDunk C, Vicarel DC, et al. (2017). A subset of ipRGCs regulates both maturation of the circadian clock and segregation of retinogeniculate projections in mice. Elife 6, e22861. - PMC - PubMed
    1. Cunningham JT, Penny ML, and Murphy D. (2004). Cardiovascular regulation of supraoptic neurons in the rat: Synaptic inputs and cellular signals. Prog. Biophys. Mol. Biol 84, 183–196. - PubMed

Publication types