. 2020 Oct 26;16(10):e1009181.
doi: 10.1371/journal.pgen.1009181. eCollection 2020 Oct.

AKH-FOXO pathway regulates starvation-induced sleep loss through remodeling of the small ventral lateral neuron dorsal projections

Affiliations

AKH-FOXO pathway regulates starvation-induced sleep loss through remodeling of the small ventral lateral neuron dorsal projections

Qiankun He et al. PLoS Genet. .

Abstract

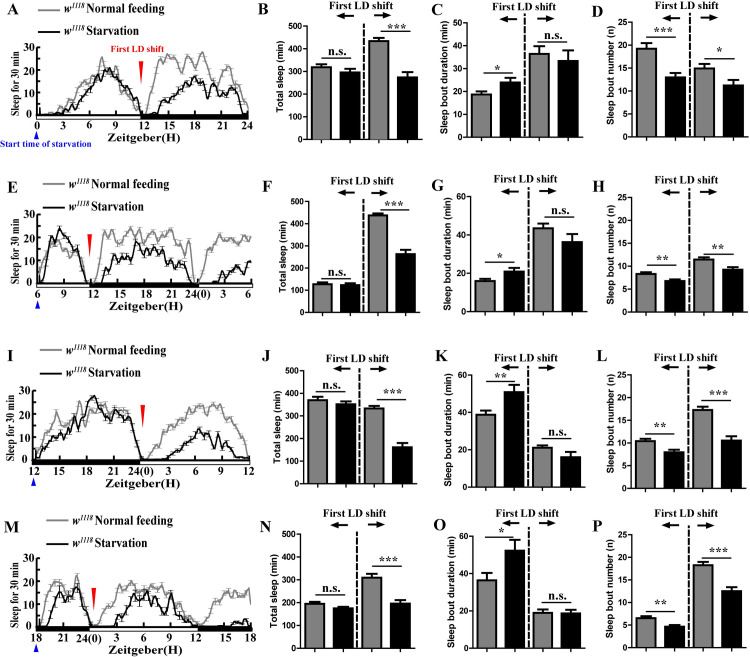
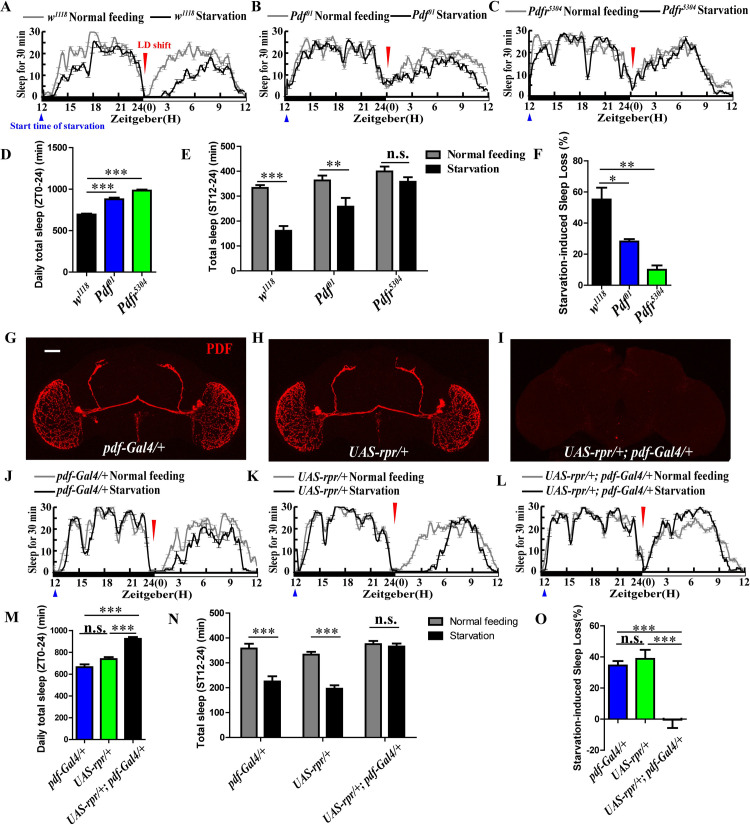
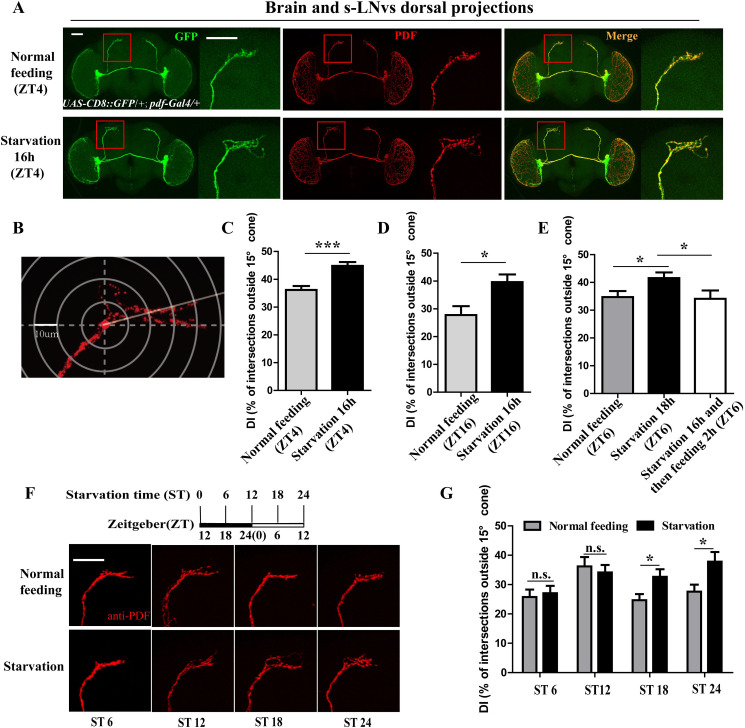
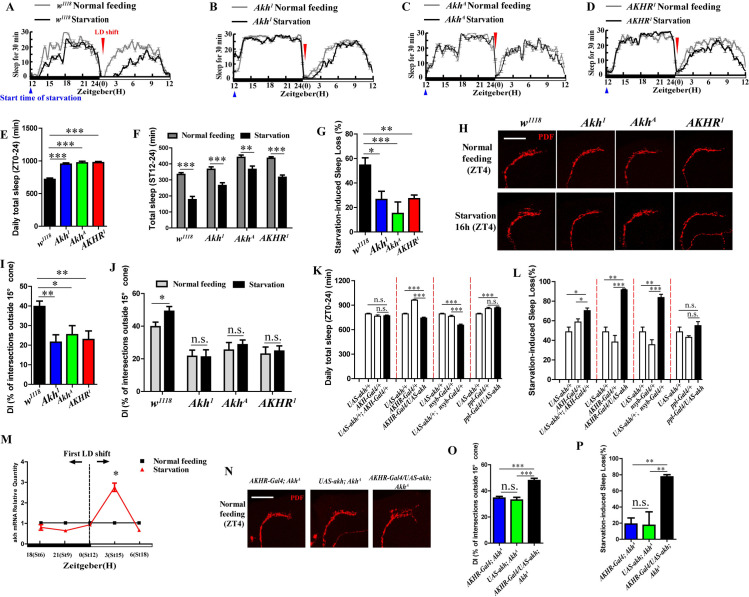
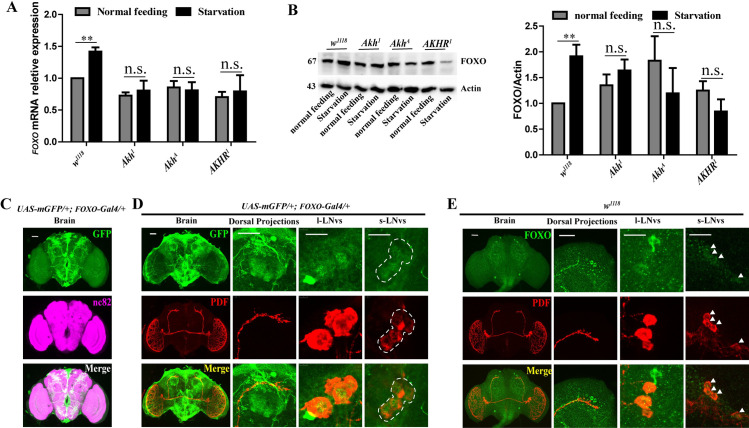
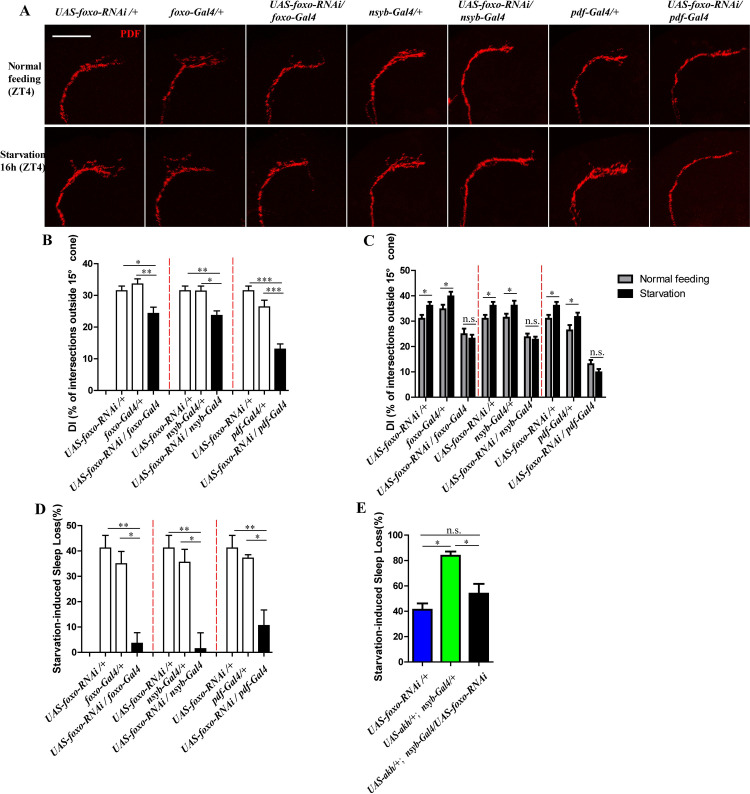
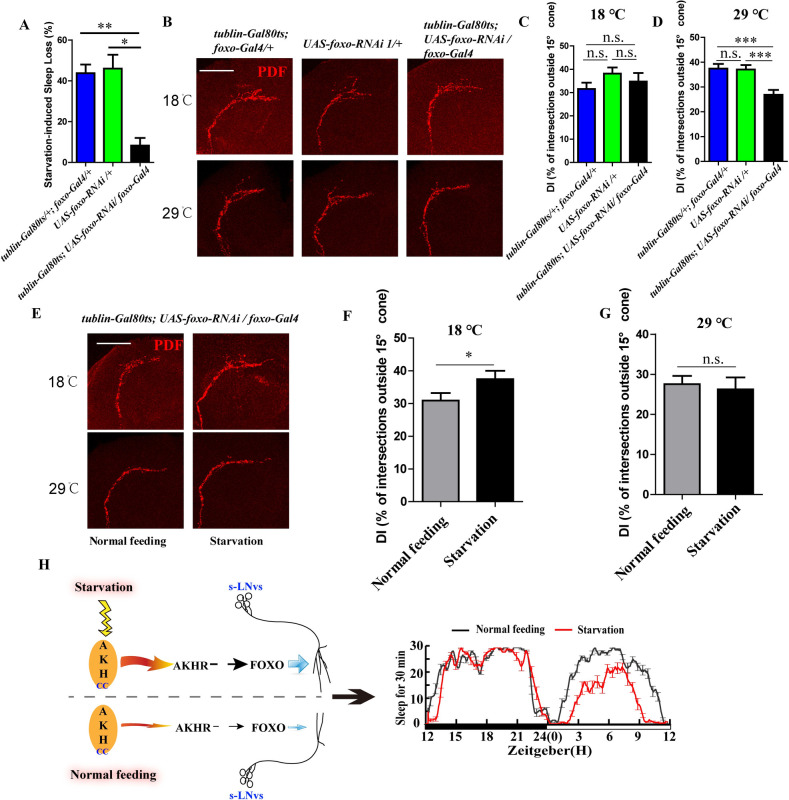
Starvation caused by adverse feeding stresses or food shortages has been reported to result in sleep loss in animals. However, how the starvation signal interacts with the central nervous system is still unknown. Here, the adipokinetic hormone (AKH)-Fork head Box-O (FOXO) pathway is shown to respond to energy change and adjust the sleep of Drosophila through remodeling of the s-LNv (small ventral lateral neurons) dorsal projections. Our results show that starvation prevents flies from going to sleep after the first light-dark transition. The LNvs are required for starvation-induced sleep loss through extension of the pigment dispersing factor (PDF)-containing s-LNv dorsal projections. Further studies reveal that loss of AKH or AKHR (akh receptor) function blocks starvation-induced extension of s-LNv dorsal projections and rescues sleep suppression during food deprivation. FOXO, which has been reported to regulate synapse plasticity of neurons, acts as starvation response factor downstream of AKH, and down regulation of FOXO level considerably alleviates the influence of starvation on s-LNv dorsal projections and sleep. Taking together, our results outline the transduction pathways between starvation signal and sleep, and reveal a novel functional site for sleep regulation.


Conflict of interest statement

The authors have declared that no competing interests exist.

Figures

Fig 1
Fig 1. Starvation prevents the Drosophila from going to sleep.
(A) Sleep profile of wild type flies (w1118) under normal condition (gray line) (n = 43) and starvation (black line) (n = 31). The blue triangle indicates start time of food deprivation (ZT0). The red inverted triangle indicates the first light-dark (LD) shift during starvation. The white bar indicates light period, the black bar indicates the dark phase. (B to D) Total sleep (B), sleep bout duration (C), and sleep bout number (D) of w1118 flies before and after first LD shift during normal feeding (n = 43) and starvation starting at ZT0 (n = 31). Gray column indicates the data of normal feeding, black column indicates the data of starvation. The data were analyzed by t test, ***p<0.0001 and *p< 0.05. (E) Sleep profile of w1118 under normal condition (gray line) (n = 65) and starvation (black line) (n = 60). The blue triangle indicates start time of food deprivation (ZT6). The red inverted triangle indicates the first light-dark (LD) shift during starvation. The white bar indicates light period, the black bar indicates the dark phase. (F to H) Total sleep (F), sleep bout duration (G), and sleep bout number (H) of w1118 flies before and after first LD shift during normal feeding (n = 65) and starvation starting at ZT6 (n = 60). Gray column indicates the data of normal feeding, black column indicates the data of starvation. The data were analyzed by t test, ***p<0.0001, **p<0.001 and *p< 0.05. (I) Sleep profile of w1118 under normal condition (gray line) (n = 44) and starvation (black line) (n = 38). The blue triangle indicates start time of food deprivation (ZT12). The red inverted triangle indicates the first light-dark (LD) shift during starvation. The white bar indicates light period, the black bar indicates the dark phase. (J to L) Total sleep (J), sleep bout duration (K), and sleep bout number (L) of w1118 flies before and after first LD shift during normal feeding (n = 44) and starvation starting at ZT12 (n = 38). Gray column indicates the data of normal feeding, black column indicates the data of starvation. The data were analyzed by t test, ***p<0.0001 and **p<0.001. (M) Sleep profile of w1118 under normal condition (gray line) (n = 42) and starvation (black line) (n = 52). The blue triangle indicates start time of food deprivation (ZT18). The red inverted triangle indicates the first light-dark (LD) shift during starvation. The white bar indicates light period, the black bar indicates the dark phase. (N to P) Total sleep (N), sleep bout duration (O), and sleep bout number (P) of w1118 flies before and after first LD shift during normal feeding (n = 42) and starvation starting at ZT18 (n = 52). Gray column indicates the data of normal feeding, black column indicates the data of starvation. The data were analyzed by t test, ***p<0.0001, **p<0.001 and *p< 0.05.
Fig 2
Fig 2. PDF and PDF neurons are required for starvation-induced sleep loss.
(A to C) Sleep profile of w1118 (A), Pdf01 (B), and Pdfr5304 (C) under normal condition (gray line) and starvation (black line). The blue triangle indicates start time of food deprivation (ZT12). The red inverted triangle indicates the first light-dark (LD) shift during starvation. (D) Daily total sleep of w1118 (black column), Pdf01 (blue column), and Pdfr5304 (green column) flies. Data were analyzed by One-way ANOVA, Dunnett’s Multiple Comparison Test. ***p<0.0001. (E) Sleep time of w1118, Pdf01and Pdfr5304 flies during ST12-St24 (Starvation time 12–24; ZT0-ZT12) under normal feeding condition (gray columns) and starvation (black columns). Data were analyzed by t test, ***p<0.0001 and **p<0.001. (F) Starvation induced sleep loss in w1118 (black column), Pdf01 (blue column), and Pdfr5304 (green column) flies. Data were analyzed by One-way ANOVA, Dunnett’s Multiple Comparison Test. **p<0.001 and *p< 0.05. (G to I) Anti-PDF immunostaining in pdf-Gal4/+ (G), UAS-rpr/+ (H), and UAS-rpr/+; pdf-Gal4/+ (I) flies. (J to L) Sleep profile of pdf-Gal4/+ (J), UAS-rpr/+ (K), and UAS-rpr/+; pdf-Gal4/+ (L) under normal condition (gray line) and starvation (black line). The blue triangle indicates start time of food deprivation (ZT12). The red inverted triangle indicates the first light-dark (LD) shift during starvation. (M) Daily total sleep of pdf-Gal4/+ (blue column), UAS-rpr/+ (green column), and UAS-rpr/+; pdf-Gal4/+ (black column) flies. Data were analyzed by One-way ANOVA, Tukey’s Multiple Comparison Test, ***p<0.0001. (N) Sleep time of pdf-Gal4/+, UAS-rpr/+ and UAS-rpr/+; pdf-Gal4/+ flies during ST12-ST24 (ZT0-ZT12) under normal feeding condition (gray columns) and starvation (black columns). Data were analyzed by t test, ***p<0.0001 and **p<0.001. (O) Starvation-induced sleep loss in pdf-Gal4/+ (blue column), UAS-rpr/+ (green column), and UAS-rpr/+; pdf-Gal4/+ (black column) flies. Data were analyzed by One-way ANOVA, Tukey’s Multiple Comparison Test, **p<0.001 and *p< 0.05.
Fig 3
Fig 3. Starvation-induced extension of s-LNv dorsal projections.
(A) The immunostaining of UAS-CD8::GFP/+; pdf-Gal4/+ flies under normal feeding condition at ZT4 and starvation condition at ST16 (ZT4) with anti-GFP (green) and anti-PDF (red). The scale bar indicates 50um. (B) The diagram of quantification of fasciculation of s-LNv dorsal projections. Defasciculation index (DI), percentage of intersections between concentric rings and dorsal projections outside of a 15% cone, was introduced to indicate the extent of synaptic diffusion (refer to 27). (C) DI of UAS-CD8::GFP/+; pdf-Gal4/+ flies under normal condition at ZT4 (gray columns) and during starvation at ST16 (ZT4) (black column). The DI’s were calculated using PDF immunofluorescence (which completely overlaps GFP immunofluorescence in s-LNv dorsal projections in UAS-CD8::GFP/+; pdf-Gal4/+ flies). Data were analyzed by t test, ***p<0.0001. (D) DI of UAS-CD8::GFP/+; pdf-Gal4/+ flies under normal condition at ZT16 (gray columns) and during starvation at ST16 (ZT16) (black column). Data were analyzed by t test, *p< 0.05. (E) DI of w1118 flies under normal condition at ZT6 (gray columns), during starvation at ST18 (ZT6) (black column) and during food deprivation for 16h and then refeeding 2h (ZT6) (white column). Data were analyzed by t test, *p< 0.05. (F) PDF staining in w1118 flies during starvation at ST6 (ZT18), ST12 (ZT0), ST18 (ZT6), ST24 (ZT12) and flies under normal feeding at same points. (G) DIs of w1118 flies under normal feeding condition (gray column) and food deprivation (black column) at ST6 (ZT18), ST12 (ZT0), ST18 (ZT6), ST24 (ZT12). Data were analyzed by t test, *p< 0.05.
Fig 4
Fig 4. AKH is indispensable for starvation-induced sleep loss and extension of PDF-containing s-LNv dorsal projections.
(A to D) Sleep profile of w1118 (A), Akh1 (B), AkhA (C), and AKHR1 (D) flies under normal condition (gray line) and starvation (black line). The blue triangle indicates start time of food deprivation (ZT12). The red inverted triangle indicates the first light-dark (LD) shift during starvation. (E) Daily total sleep of w1118 (black column), Akh1 (blue column), AkhA (green column), and AKHR1 (red column) flies. Data were analyzed by One-way ANOVA, Dunnett’s Multiple Comparison Test. ***p<0.0001. (F) Sleep time of w1118, Akh1, AkhA, and AKHR1 flies during ST12-ST24 (ZT0-ZT12) under normal feeding condition (gray columns) and starvation (black columns). Data were analyzed by t test, ***p<0.0001 and **p<0.001. (G) Starvation induced sleep loss in w1118 (black column), Akh1 (blue column), AkhA (green column), and AKHR1 (red column) flies. Data were analyzed by One-way ANOVA, Dunnett’s Multiple Comparison Test. ***p<0.0001, **p<0.001 and *p< 0.05. (H) PDF staining in w1118, Akh1, AkhA, and AKHR1 flies under normal feeding condition at ZTt4 and starvation condition at ST16 (ZT4). The scale bar indicates 50um. (I) DIs of w1118 (black column), Akh1 (blue column), AkhA (green column), and AKHR1 (red column) flies under normal feeding condition at ZT4. Data were analyzed by One-way ANOVA, Dunnett’s Multiple Comparison Test. **p<0.001 and *p< 0.05. (J) DI of w1118, Akh1, AkhA, and AKHR1 flies under normal condition at ZT4 (gray column) and during starvation at ST16 (ZT4) (black column). Data were analyzed by t test, *p< 0.05. (K) Daily total sleep of akh overexpression flies driving by AKH-Gal4, AKHR-Gal4, nsyb-Gal4, and ppl-Gal4 (black column) and its controls (white column). Data were analyzed by One-way ANOVA, Tukey’s Multiple Comparison Test. ***p<0.0001. (L) Starvation induced sleep loss in akh overexpression flies driving by AKH-Gal4, AKHR-Gal4, nsyb-Gal4, and ppl-Gal4 (black column) and its controls (white column). Data were analyzed by One-way ANOVA, Tukey’s Multiple Comparison Test. ***p<0.0001, and *p< 0.05. (M) qRT-PCR analysis of akh amounts in w1118 flies during starvation before and after first LD shift. Black cube indicates akh expression in the normal feeding condition, and the red triangle indicates the akh expression in the starvation condition (relative to its expression in the normal feeding). Data were analyzed by t test, *p< 0.05. (N) PDF staining in AKHR-Gal4; AkhA, UAS-akh; AkhA and AKHR-Gal4/UAS-akh; AkhA flies under normal feeding condition at ZT4 and starvation condition at ST16 (ZT4). The scale bar indicates 50um. (O) DIs of AKHR-Gal4; AkhA (blue column), UAS-akh; AkhA (green column), and AKHR-Gal4/UAS-akh; AkhA (red column) flies under normal feeding condition at ZT4. Data were analyzed by One-way ANOVA, Tukey’s Multiple Comparison Test. ***p<0.0001. (P) Starvation induced sleep loss in AKHR-Gal4; AkhA (blue column), UAS-akh; AkhA (green column), and AKHR-Gal4/UAS-akh; AkhA (black column) flies. Data were analyzed by One-way ANOVA, Tukey’s Multiple Comparison Test, **p<0.001.
Fig 5
Fig 5. FOXO as starvation response factor acts downstream of AKH pathway, and was detected in the LNvs and in Surrounding s-LNv dorsal projections.
(A) qRTPCR analysis of foxo amounts in w1118, Akh1, AkhA, and AKHR1 flies under normal condition at ZT4 (gray column) and during starvation at ST16 (ZT4) (black column). Data were analyzed by t test, **p<0.001. (B) Activated FOXO levels in w1118, Akh1, AkhA, and AKHR1 flies under normal condition at ZT4 and during starvation at ST16 (ZT4). The intensity of protein bands (B) was quantified by Image J and calculated as a relative value (the intensity of FOXO/the intensity of Actin) (C). Data were analyzed by t test, **p<0.001. (C) The brain immunofluorescence of UAS-mGFP/+; foxo-Gal4/+ flies with anti-GFP (green) and anti-nc82 (magenta). (D) The immunofluorescence with anti-GFP (green) and anti-PDF (red) in UAS-mGFP/+; foxo-Gal4/+ flies in brain, dorsal protocerebrum, l-LNvs, and s-LNvs. (E) The immunofluorescence with anti-FOXO (green) and anti-PDF (red) in w1118 flies in brain, dorsal protocerebrum, l-LNvs, and s-LNvs.
Fig 6
Fig 6. Downregulated foxo levels inhibit starvation-induced sleep loss and s-LNv dorsal projection openings.
(A) PDF staining on s-LNvs dorsal projections in foxo down regulated flies and its control under normal feeding condition at ZT4 and starvation condition at ST16 (ZT4). The scale bar indicates 50um. (B) DIs of foxo down regulated flies (black column) and its controls (white column) under normal feeding condition at ZT4. Data were analyzed by One-way ANOVA, Tukey’s Multiple Comparison Test. * p<0.05, **p<0.001, *** p<0.0001. (C) DIs of foxo down regulated flies and its controls under normal condition at ZT4 (gray column) and during starvation at St16 (ZT4) (black column). Data were analyzed by t test, *p<0.05. (D) Starvation induced sleep loss in foxo down regulated flies (black column) and its controls (white column). Data were analyzed by One-way ANOVA, Tukey’s Multiple Comparison Test. *p< 0.05, **p<0.001. (E) Starvation induced sleep loss in UAS-foxo-RNAi/+, UAS-akh/+; nsyb-Gal4/+ and UAS-akh/+; nsyb-Gal4/UAS-foxo-RNAi flies. Data were analyzed by One-way ANOVA, Tukey’s Multiple Comparison Test. *p< 0.05.
Fig 7
Fig 7. The roles of foxo on starvation-induced sleep loss and s-LNv dorsal projections are independent of development.
(A) Starvation induced sleep loss in tublin-Gal80ts/+; foxo-Gal4/+ (blue column), UAS-foxo-RNAi/+ (green column), and tublin-Gal80ts/+; UAS-foxo-RNAi/foxo-Gal4 (black column) flies. Data were analyzed by One-way ANOVA, Tukey’s Multiple Comparison Test, **p<0.001 and *p< 0.05. (B) PDF staining in tublin-Gal80ts/+; foxo-Gal4/+, UAS-foxo-RNAi/+ and tublin-Gal80ts/+; UAS-foxo-RNAi/foxo-Gal4 flies under normal feeding condition at ZT4 at 18°C and 29°C. The scale bar indicates 50um. (C and D) DIs of tublin-Gal80ts/+; foxo-Gal4/+ (blue column), UAS-foxo-RNAi/+ (green column), and tublin-Gal80ts/+; UAS-foxo-RNAi/foxo-Gal4 (black column) flies under normal feeding condition at ZT4 at 18°C (C) and 29°C (D). Data were analyzed by One-way ANOVA, Tukey’s Multiple Comparison Test. ***p<0.0001. (E) PDF staining in tublin-Gal80ts/+; UAS-foxo-RNAi/foxo-Gal4 flies under normal feeding condition at ZT4 and starvation condition at ST16 (ZT4) at 18°C and 29°C. The scale bar indicates 50um. (F and G) DIs of tublin-Gal80ts/+; UAS-foxo-RNAi/foxo-Gal4 flies under normal feeding condition at ZT4 (gray column) and starvation condition at ST16 (ZT4) (black column) at 18°C (F) and 29°C (G). Data were analyzed by t test, *p< 0.05. (H) Working model of starvation induced sleep loss. AKH receives and transmits the starvation signal to the FOXO and then adjusts sleep through regulating the axonal remodeling of the s-LNv dorsal projections.

References

    1. Méndez G, Wieser W. Metabolic responses to food deprivation and refeeding in juveniles of Rutilus rutilus, (Teleostei: Cyprinidae). Environmental Biology of Fishes 1993;36(1):73–81.
    1. McCue MD. Starvation physiology: reviewing the different strategies animals use to survive a common challenge. Comp Biochem Physiol A Mol Integr Physiol. 2010;156(1):1–18. 10.1016/j.cbpa.2010.01.002 . - DOI - PubMed
    1. Wang B, Moya N, Niessen S, Hoover H, Mihaylova MM, Shaw RJ, et al. A hormone-dependent module regulating energy balance. Cell. 2011;145(4):596–606. 10.1016/j.cell.2011.04.013 - DOI - PMC - PubMed
    1. Grönke S, Müller G, Hirsch J, Fellert S, Andreou A, Haase T, et al. Dual lipolytic control of body fat storage and mobilization in Drosophila. PLoS biology. 2007;5(6):e137 10.1371/journal.pbio.0050137 - DOI - PMC - PubMed
    1. Taghert PH, Choi S, Lim D-S, Chung J. Feeding and Fasting Signals Converge on the LKB1-SIK3 Pathway to Regulate Lipid Metabolism in Drosophila. PLoS genetics. 2015;11(5):e1005263 10.1371/journal.pgen.1005263 - DOI - PMC - PubMed

Publication types

MeSH terms

LinkOut - more resources