. 2021 Jan 8;49(D1):D924-D931.
doi: 10.1093/nar/gkaa914.

The mouse Gene Expression Database (GXD): 2021 update

Affiliations

The mouse Gene Expression Database (GXD): 2021 update

Richard M Baldarelli et al. Nucleic Acids Res. .

Abstract

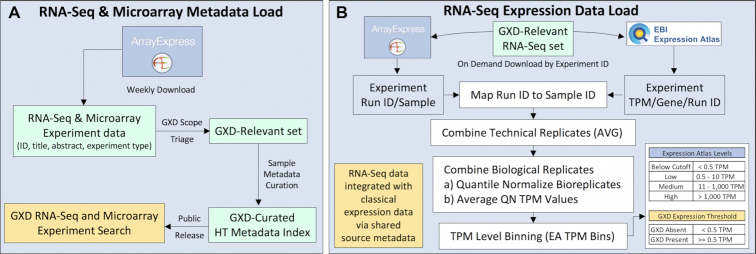
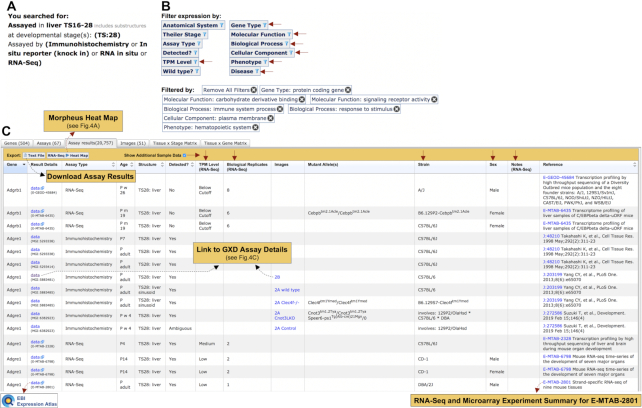
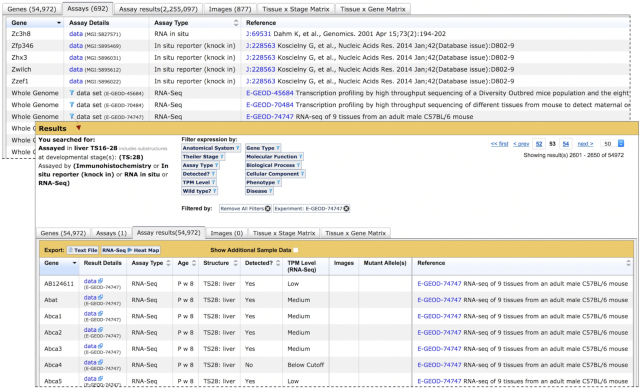
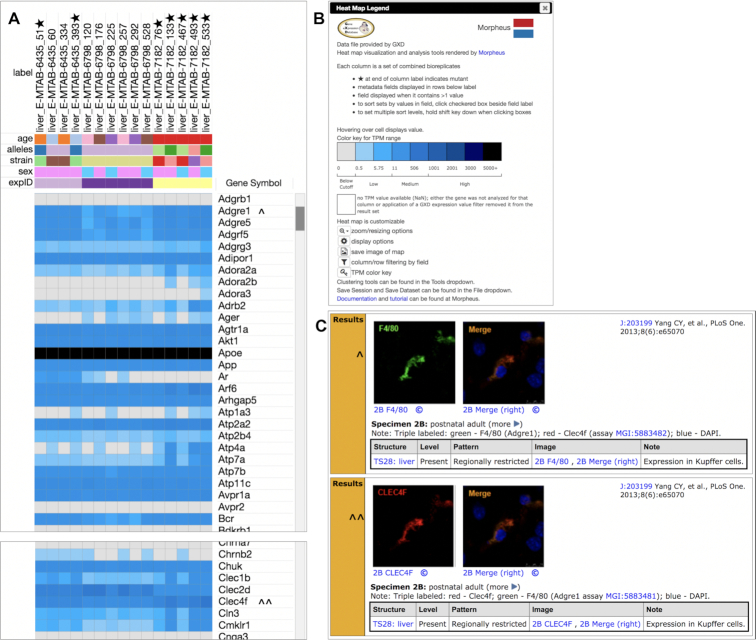
The Gene Expression Database (GXD; www.informatics.jax.org/expression.shtml) is an extensive and well-curated community resource of mouse developmental gene expression information. For many years, GXD has collected and integrated data from RNA in situ hybridization, immunohistochemistry, RT-PCR, northern blot, and western blot experiments through curation of the scientific literature and by collaborations with large-scale expression projects. Since our last report in 2019, we have continued to acquire these classical types of expression data; developed a searchable index of RNA-Seq and microarray experiments that allows users to quickly and reliably find specific mouse expression studies in ArrayExpress (https://www.ebi.ac.uk/arrayexpress/) and GEO (https://www.ncbi.nlm.nih.gov/geo/); and expanded GXD to include RNA-Seq data. Uniformly processed RNA-Seq data are imported from the EBI Expression Atlas and then integrated with the other types of expression data in GXD, and with the genetic, functional, phenotypic and disease-related information in Mouse Genome Informatics (MGI). This integration has made the RNA-Seq data accessible via GXD's enhanced searching and filtering capabilities. Further, we have embedded the Morpheus heat map utility into the GXD user interface to provide additional tools for display and analysis of RNA-Seq data, including heat map visualization, sorting, filtering, hierarchical clustering, nearest neighbors analysis and visual enrichment.


Figures

Figure 1.
Figure 1.
Overview of GXD high-throughput expression data loads. (A) GXD loads RNA-Seq and microarray metadata from ArrayExpress weekly, to download experiment-level information for new mouse RNA-Seq and expression microarray experiments. Experiments are evaluated for GXD relevance. Sample metadata from GXD-relevant experiments are downloaded on demand into a GXD high-throughput sample curation tool, where sample metadata and experimental variables are annotated using controlled vocabularies and ontologies, and added to the GXD high-throughput expression metadata index, released weekly. (B) The GXD RNA-Seq Expression Data load runs on demand as new GXD-relevant RNA-Seq experiments become available from the Expression Atlas (EA). Per experiment, technical replicate identifiers (Run IDs) per Sample are loaded from ArrayExpress and TPM values per gene, per Run ID are loaded from the Expression Atlas. The load joins technical replicate information to produce TPM values per gene, per run ID, per sample for each experiment. TPM values per gene from technical replicates (run IDs for a sample) are averaged. Biological replicates are identified by shared GXD-curated metadata source profiles, and combined in a two step process of (A) quantile normalizing TPM values across bioreplicates for an experiment and (B) averaging quantile normalized (QN) TPM values for each gene of the bioreplicate set. These averaged, QN TPM values are then mapped to TPM range bins established by the Expression Atlas, and to a GXD expression threshold (Present/Absent), based on TPM value relative to the Below Cutoff value range. RNA-Seq expression data are integrated with classical types of GXD expression data through the combination of shared biological source metadata, shared gene annotations and common use of Present/Absent calls.
Figure 2.
Figure 2.
Integrated Classical and RNA-Seq Expression Results. Partial results from a search for genes expressed in liver, at TS:28 (postnatal), assayed by classical in situ methods and by RNA-Seq are shown. New features are identified with red arrows, featured links shown as dotted arrows. (A) Search parameters. (B) Suite of expression result filters. Sample-level filters (left column) restrict expression results by sample metadata, and include the new TPM Level filter (RNA-Seq data only). New gene-level filters (right column) restrict expression results by gene annotations, including gene type, and high-level terms for ontology annotations (Gene Ontology, Mammalian Phenotype Ontology, and Disease Ontology). Filters enacted for this result set are shown (Filtered by). (C) Filtered result set showing Assay results tab (Assays tab view shown in Figure 3). Link-outs indicated by dotted arrows. New sample-level metadata columns (down arrows) can be shown/hidden with the Show Additional Sample Data toggle (RNA-Seq data-specific columns indicated). A new Morpheus heat map of RNA-Seq results is rendered by clicking the RNA-Seq ▸ Heat Map button (see Figure 4A). New links to the Expression Atlas at EBI and the GXD RNA-Seq and Microarray Experiment Summary for RNA-Seq experiments are shown. Links to the GXD assay details (including images) exhibited in Figure 4C, from the Result Details and Images columns are shown. The complete Assay results set can be exported as text to the user's desktop, and includes the new sample-level metadata columns shown.
Figure 3.
Figure 3.
Access to Integrated Results for Specific RNA-Seq Experiments from the Assays Tab. Assays tab view (upper table) of expression results for RNA-Seq and in situ assays of mouse liver at TS:28. For classical experiment types, each gene analyzed and the assay type used are specified for each assay, and links are provided to GXD assay details (data) in the Assay Details column. For RNA-Seq experiments, ‘Whole Genome’ is displayed in the Gene column, because each experiment involves all genes in the Ensembl transcriptome. The default sort for classical expression type assays is by gene symbol. Whole Genome RNA-Seq experiments are positioned after classical type assays, and are sorted by experiment ID. The transition between classical type and RNA-Seq assays is shown in the upper table. Users can view integrated expression results for an individual RNA-Seq experiment by clicking on the filter icon in the Result Details column for that experiment. This applies a filter to the original search, which limits results to the selected RNA-Seq experiment (lower table). The full suite of annotation filters is now available to explore results from that single experiment. Links to complete expression results (without search restrictions) for a single RNA-Seq experiment can be obtained from the GXD RNA-Seq and Microarray Experiment Summary (not shown).
Figure 4.
Figure 4.
Heat Map of RNA-Seq Results. Expression heat map of RNA-Seq data from GXD expression results shown in Figure 2, rendered using the Morpheus tool. (A) Heat map grid shows quantitative expression of genes (rows) from distinct bioreplicate sample sets (columns). Column labels are derived from anatomical structure, experiment ID and bioreplicate set ID. Stars indicate mutant samples, wild type samples have no star. Common annotations for a given metadata type (age, strain, sex, etc.) share the same color in that row (if all samples share the same metadata value, that row is not shown, by default). Expression data rows (Gene Symbol) reflect average, quantile-normalized TPM values for the corresponding genes in each bioreplicate set, using a color scheme designed to accommodate the wide dynamic range of TPM values in the data (see B). Cell values (metadata or TPM) are displayed by hovering over the cell. Genes Adgre1 and Clec4f are marked (carets) for comparison in (C). (B) Heat map legend includes TPM range color key, guide to usability options (sorting, filtering), pointers to data clustering tools and file saving, and links to documentation at the Morpheus resource. (C) Partial GXD assay results (immunohistochemical staining) for two genes included in the RNA-Seq heat map (carets in A) reveal coexpression of these genes in Kupffer cells.

Similar articles

Cited by

References

    1. Bult C.J., Blake J.A., Smith C.L., Kadin J.A., Richardson J.E. the Mouse Genome Database Group . Mouse Genome Database (MGD) 2019. Nucleic Acids Res. 2019; 47:D801–D806. - PMC - PubMed
    1. Smith C.M., Hayamizu T.F., Finger J.H., Bello S.M., McCright I.J., Xu J., Baldarelli R.M., Beal J.S., Campbell J.W., Corbani L.E. et al. .. The mouse Gene Expression Database (GXD): 2019 update. Nucleic Acids Res. 2018; 47:D774–D779. - PMC - PubMed
    1. Drabkin H.J., Christie K.R., Dolan M.E., Hill D.P., Ni L., Sitnikov D., Blake J.A.. Application of comparative biology in GO functional annotation: the mouse model. Mamm. Genome. 2015; 9:574–583. - PMC - PubMed
    1. Ruzicka L., Howe D.G., Ramachandran S., Toro S., Van Slyke C.E., Bradford Y.M., Eagle A., Fashena D., Frazer K., Kalita P. et al. .. The Zebrafish Information Network: new support for non-coding genes, richer Gene Ontology annotations and the Alliance of Genome Resources. Nucleic Acids Res. 2019; 47:D867–D873. - PMC - PubMed
    1. Fortriede J.D., Pells T.J., Chu S., Chaturvedi P., Wang D., Fisher M.E., James-Zorn C., Wang Y., Nenni M.J, Burns K.A. et al. .. Xenbase: deep integration of GEO & SRA RNA-seq and ChIP-seq data in a model organism database. Nucleic Acids Res. 2020; 48:D776–D782. - PMC - PubMed

Publication types