. 2020 Dec 2;48(21):12365-12379.
doi: 10.1093/nar/gkaa928.

2'-O-Methylation can increase the abundance and lifetime of alternative RNA conformational states

Affiliations

2'-O-Methylation can increase the abundance and lifetime of alternative RNA conformational states

Hala Abou Assi et al. Nucleic Acids Res. .

Abstract

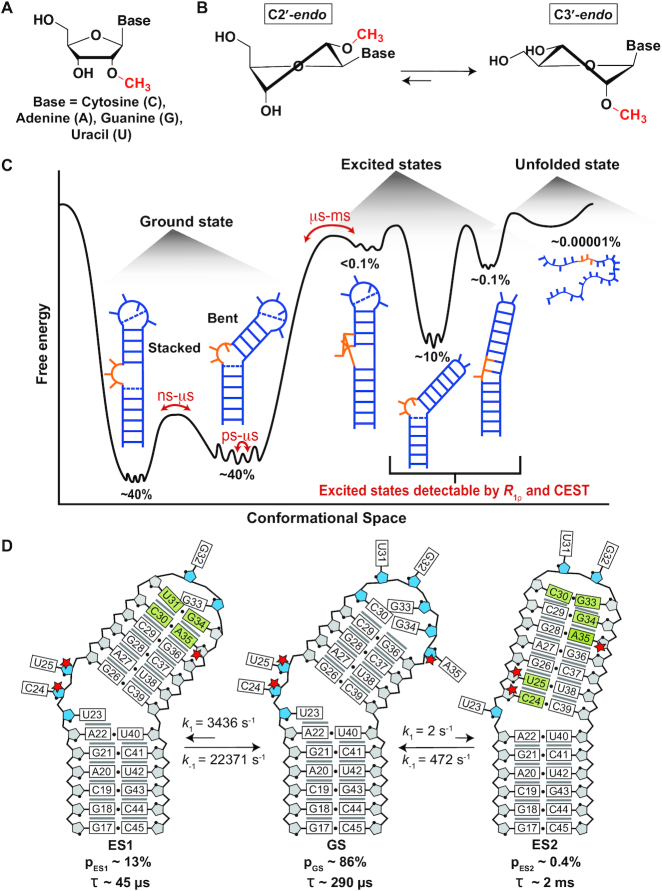
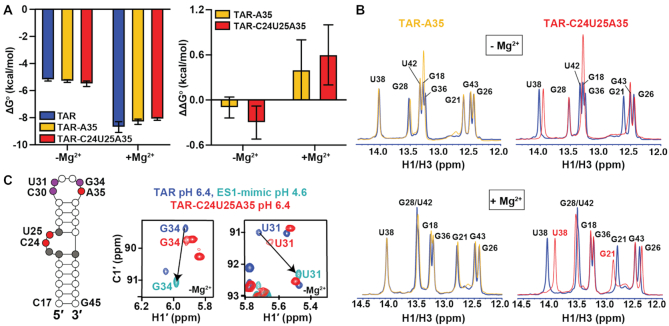
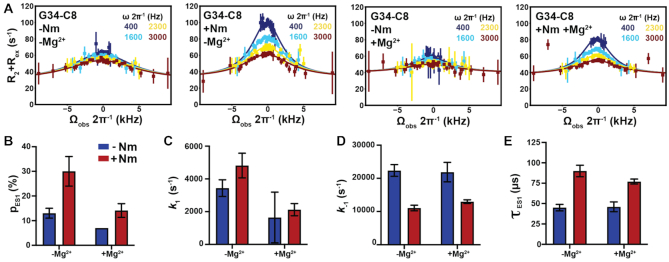
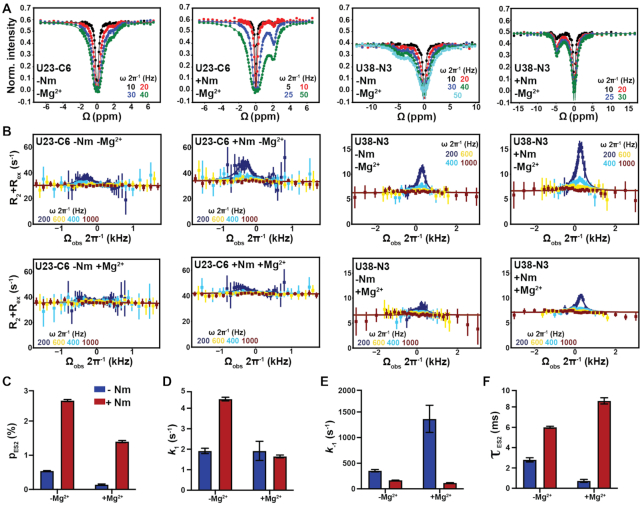
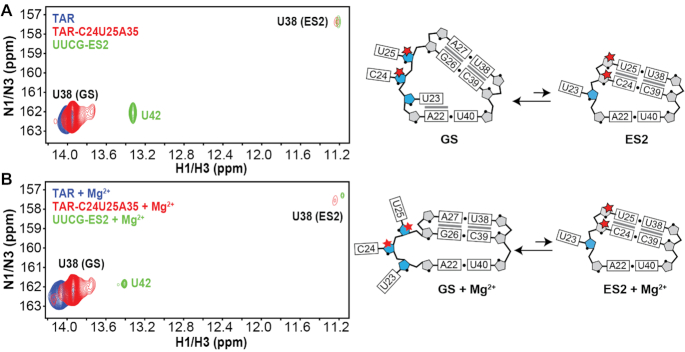
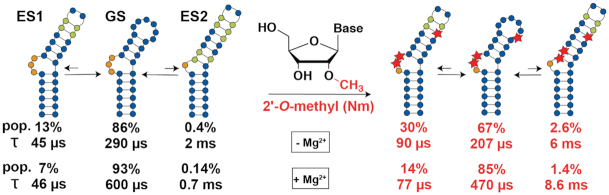
2'-O-Methyl (Nm) is a highly abundant post-transcriptional RNA modification that plays important biological roles through mechanisms that are not entirely understood. There is evidence that Nm can alter the biological activities of RNAs by biasing the ribose sugar pucker equilibrium toward the C3'-endo conformation formed in canonical duplexes. However, little is known about how Nm might more broadly alter the dynamic ensembles of flexible RNAs containing bulges and internal loops. Here, using NMR and the HIV-1 transactivation response (TAR) element as a model system, we show that Nm preferentially stabilizes alternative secondary structures in which the Nm-modified nucleotides are paired, increasing both the abundance and lifetime of low-populated short-lived excited states by up to 10-fold. The extent of stabilization increased with number of Nm modifications and was also dependent on Mg2+. Through phi-value analysis, the Nm modification also provided rare insights into the structure of the transition state for conformational exchange. Our results suggest that Nm could alter the biological activities of Nm-modified RNAs by modulating their secondary structural ensembles as well as establish the utility of Nm as a tool for the discovery and characterization of RNA excited state conformations.


Figures

Figure 1.
Figure 1.
(A) Chemical structure of a 2′-O-methylated nucleoside (Nm). (B) Nm biases the sugar pucker towards C3′-endo (34). (C) The RNA free energy landscape of HIV-1 TAR includes (i) the dominant GS secondary structure that interconverts between the bent and coaxially stacked conformations, (ii) ESs that have non-native secondary structures and (iii) the unfolded/melted conformations. ESs with populations >0.1% can be studied using R and CEST NMR experiments. (D) Secondary structure of the TAR GS and ESs. The exchange parameters shown are for TAR in the absence of Mg2+ as reported previously (69,70). Nucleotides that undergo sugar repuckering from C2′-endo (blue) in the GS to C3′-endo (grey) in the ES are indicated using green bases in the ESs. Red stars indicate the Nm-modified residues. Black dots denote base pairing and grey lines denote stacking. The lifetime (τ) of each ES is equal to 1/k-1, and τ of the GS = 1/(k1,ES1 + k1,ES2).
Figure 2.
Figure 2.
Impact of Nm on the thermal stability of TAR GS. (A) ΔG°and ΔΔG° values derived from melting curves in the absence and presence of 3 mM Mg2+. Error bars on Δ denote standard deviation of triplicate measurements as described in the methods. formula image. Error bars on ΔΔ were obtained by propagating the errors from triplicate measurements (see Methods). (B) Overlays comparing 1D 1H imino spectra for unmodified TAR (blue), TAR-A35 (yellow) and TAR-C24U25A35 (red) in the absence and presence of 3 mM Mg2+. All samples were unlabeled. (C) Secondary structure of TAR with Nm-modified residues shown in red, residues showing CSPs towards ES1 are in purple, and residues exhibiting CSPs due to bulge modifications are in grey. Overlay of natural abundance 2D [13C, 1H] HSQC spectra for the C1′-H1′ region in TAR (pH 6.4), TAR ES1-mimic (pH 4.6) (69), and TAR-C24U25A35 (pH 6.4), in the absence of Mg2+. Lowering the pH to 4.6 shifts the population of TAR (structure shown in Supplementary Figure S3) to stabilize ES1 as the dominant conformation due to protonation of the A35-C30 mismatch unique to ES1 (69). Spectra with complete assignments are shown in Supplementary Figures S2 and S3.
Figure 3.
Figure 3.
Impact of Nm on GS–ES1 exchange. (A) Off-resonance R13C RD profiles for G34-C8 in TAR and TAR-C24U25A35 at 25°C, in the absence and presence of 1 mM Mg2+. R data was fit with a two-state model using Bloch-McConnell equations. Spin-lock powers are color-coded. Errors in the R data were calculated as described previously (110). (B–E) Comparison of ES1 population (pES1), forward (k1) and backward (k1) rate constants, and lifetime (τ) between TAR and TAR-C24U25A35, in the absence and presence of 1 mM Mg2+, as obtained from fitting R data. Error bars were calculated using a Monte-Carlo scheme (110).
Figure 4.
Figure 4.
Impact of Nm on GS–ES2 exchange in TAR. (A) 13C and 15N CEST profiles in TAR and TAR-C24U25A35 in the absence of Mg2+. (B) Off-resonance 13C and 15N R RD profiles for U23-C6 and U38-N3 in TAR and TAR-C24U25A35 in the absence and presence of 1 mM of Mg2+. R data was fit with a two-state model using Bloch–McConnell equations. Fits of R profiles were preformed fixing the population to the value measured using CEST. Errors in the R data were calculated as described previously (110). Spin-lock powers in CEST and R are color-coded. (C–F) Comparison of pES2, k1 and k-1 rate constants, and τ ES2 between TAR and TAR-C24U25A35 in the absence and presence of 1 mM Mg2+ obtained from fitting the CEST and R data. Error bars were calculated using a Monte-Carlo scheme (62).
Figure 5.
Figure 5.
Direct observation of ES2 U38-N3H3 resonance in the Nm-modified TAR sample in NMR 2D spectra. Overlay of 2D [1H,15N] HSQC spectra of uniformly 15N/13C labeled UUCG-ES2 with 15N(U38) site-labeled TAR and TAR-C24U25A35 (left) and zoom in showing the bulge region in the GS and ES2 (right) in the (A) absence or (B) presence of 1 mM Mg2+. The ES2 U38-N3H3 resonance is absent in unmodified TAR and clearly visible in TAR-C24U25A35. Full [1H,15N] 2D HSQC spectra of UUCG-ES2 are shown in Supplementary Figure S9.
Figure 6.
Figure 6.
Summary of the effect of Nm on GS-ES exchange in the presence and absence of Mg2+. Bulge nucleotides are shown in orange. Nucleotides that transition from being unpaired in GS to paired in the ES are shown in green. Red stars indicate the Nm-modified residues. Pop and τ refer to the population and lifetime of the conformational state (GS, ES1 or ES2).

References

    1. Marchand V., Pichot F., Thuring K., Ayadi L., Freund I., Dalpke A., Helm M., Motorin Y.. Next-generation sequencing-based RiboMethSeq protocol for analysis of tRNA 2′-O-methylation. Biomolecules. 2017; 7:13. - PMC - PubMed
    1. Taoka M., Nobe Y., Yamaki Y., Sato K., Ishikawa H., Izumikawa K., Yamauchi Y., Hirota K., Nakayama H., Takahashi N. et al.. Landscape of the complete RNA chemical modifications in the human 80S ribosome. Nucleic Acids Res. 2018; 46:9289–9298. - PMC - PubMed
    1. Krogh N., Kongsbak-Wismann M., Geisler C., Nielsen H.. Substoichiometric ribose methylations in spliceosomal snRNAs. Org. Biomol. Chem. 2017; 15:8872–8876. - PubMed
    1. Dai Q., Moshitch-Moshkovitz S., Han D., Kol N., Amariglio N., Rechavi G., Dominissini D., He C.. Nm-seq maps 2′-O-methylation sites in human mRNA with base precision. Nat. Methods. 2017; 14:695–698. - PMC - PubMed
    1. Elliott B.A., Ho H.T., Ranganathan S.V., Vangaveti S., Ilkayeva O., Abou Assi H., Choi A.K., Agris P.F., Holley C.L.. Modification of messenger RNA by 2′-O-methylation regulates gene expression in vivo. Nat. Commun. 2019; 10:3401. - PMC - PubMed

Publication types