

Alcohol Consumption in Response to the COVID-19 Pandemic in the United States
- PMID: 33105169
- PMCID: PMC8327759
- DOI: 10.1097/ADM.0000000000000767
Alcohol Consumption in Response to the COVID-19 Pandemic in the United States
Abstract
Objectives: Excessive alcohol use is a serious and growing public health problem. Alcoholic beverage sales in the United States increased greatly immediately after the stay-at-home orders and relaxing of alcohol restrictions associated with the COVID-19 pandemic. However, it is not known to what degree alcohol consumption changed. This study assesses differences in alcohol drinking patterns before and after the enactment of stay-at-home orders.
Methods: In May 2020, a cross-sectional online survey of 993 individuals using a probability-based panel designed to be representative of the US population aged 21 and older was used to assess alcohol drinking patterns before (February, 2020) and after (April, 2020) the enactment of stay-at-home orders among those who consumed alcohol in February, 2020 (n = 555). Reported differences in alcohol consumption were computed, and associations between differences in consumption patterns and individual characteristics were examined.
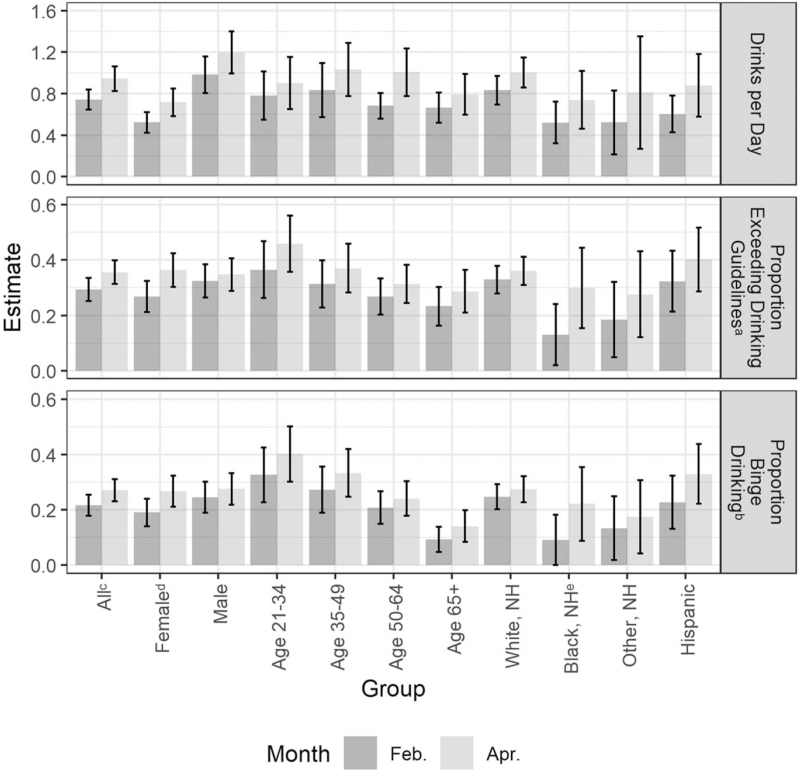
Results: Compared to February, respondents reported consuming more drinks per day in April (+29%, P < 0.001), and a greater proportion reported exceeding recommended drinking limits (+20%, P < 0.001) and binge drinking (+21%, P = 0.001) in April. These differences were found for all sociodemographic subgroups assessed. February to April differences in the proportion exceeding drinking limits were larger for women than men (P = 0.026) and for Black, non-Hispanic people than White, non-Hispanic people (P = 0.028).
Conclusions: There is an association among the COVID-19 pandemic, the public health response to it, changes in alcohol policy, and alcohol consumption. Public health monitoring of alcohol consumption during the pandemic is warranted.
Copyright © 2020 American Society of Addiction Medicine.
Conflict of interest statement
Supported by the authors’ employing organization, RTI International. The funding agreement ensured the authors’ independence in designing the study, interpreting the data, and writing and publishing the article. The content is solely the responsibility of the authors and does not necessarily represent the official views of RTI International. The authors have no conflicts of interest to declare.
Figures
References
-
- National Alcohol Beverage Control Association (NABCA). COVID-19 resources. [Web page]. Published n.d. Available at: https://www.nabca.org/covid-19-resources. Accessed May 29, 2020.
-
- U.S. Census Bureau. Retail Sales: Beer, Wine, and Liquor Stores [MRTSSM4453USN]. Published 2020. Retrieved from FRED, Federal Reserve Bank of St. Louis; https://fred.stlouisfed.org/series/MRTSSM4453USN. Accessed August 14, 2020.
Publication types
MeSH terms
LinkOut - more resources
Full Text Sources
Medical
Miscellaneous
