. 2020 Oct 22;8(11):444.
doi: 10.3390/biomedicines8110444.

Soluble Compounds Released by Hypoxic Stroma Confer Invasive Properties to Pancreatic Ductal Adenocarcinoma

Affiliations

Soluble Compounds Released by Hypoxic Stroma Confer Invasive Properties to Pancreatic Ductal Adenocarcinoma

Dajia Liu et al. Biomedicines. .

Abstract

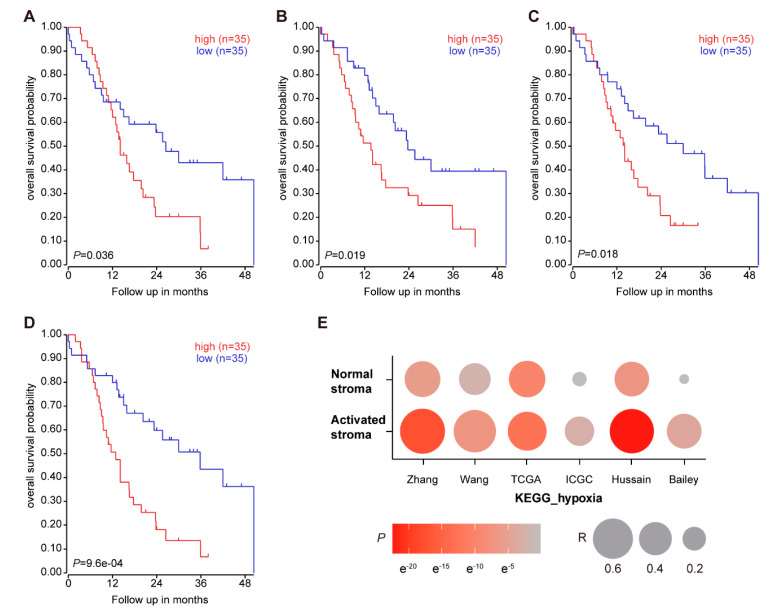
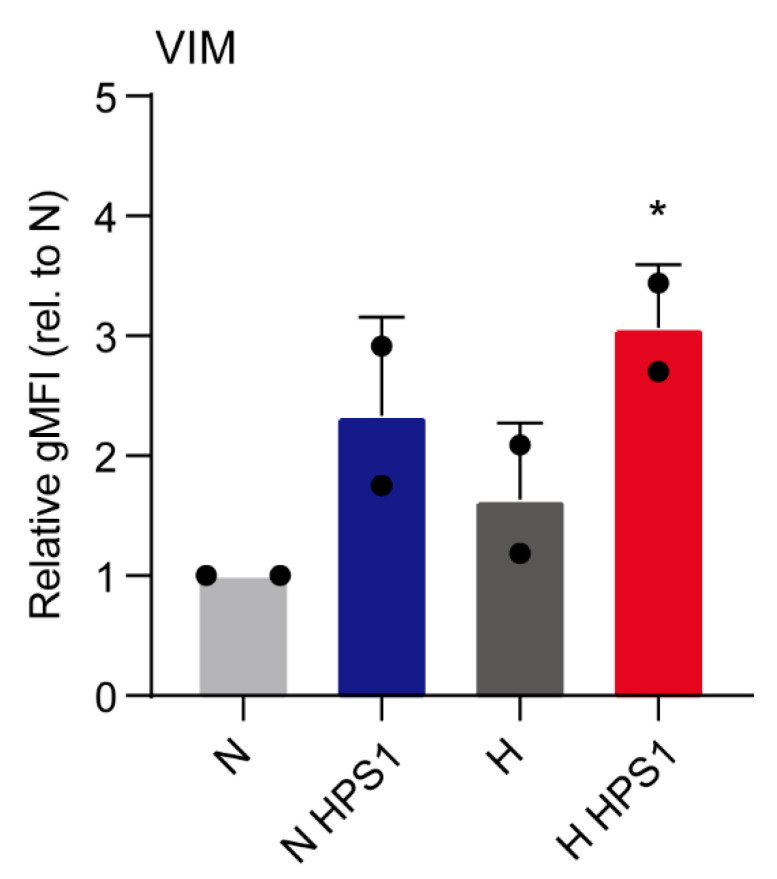
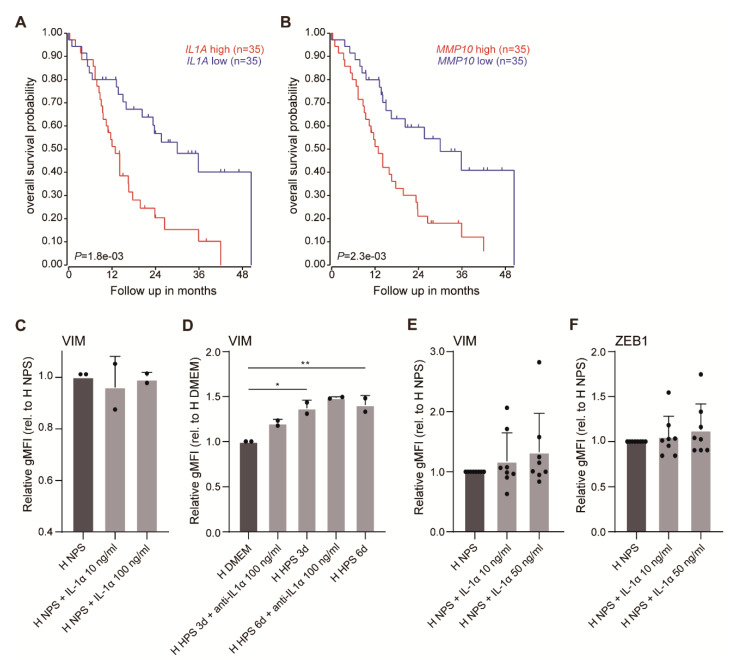
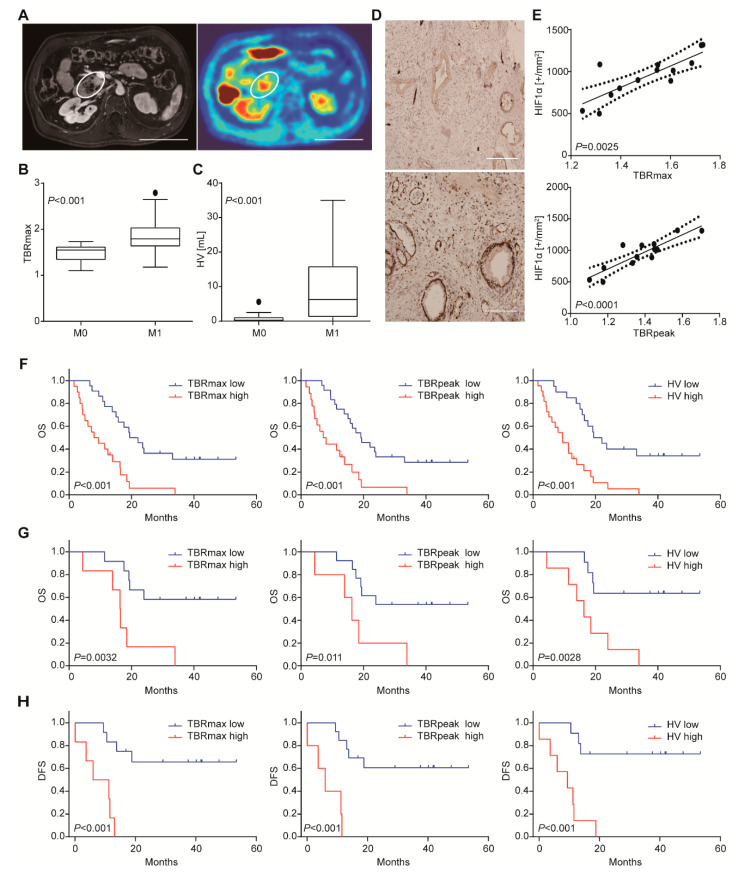
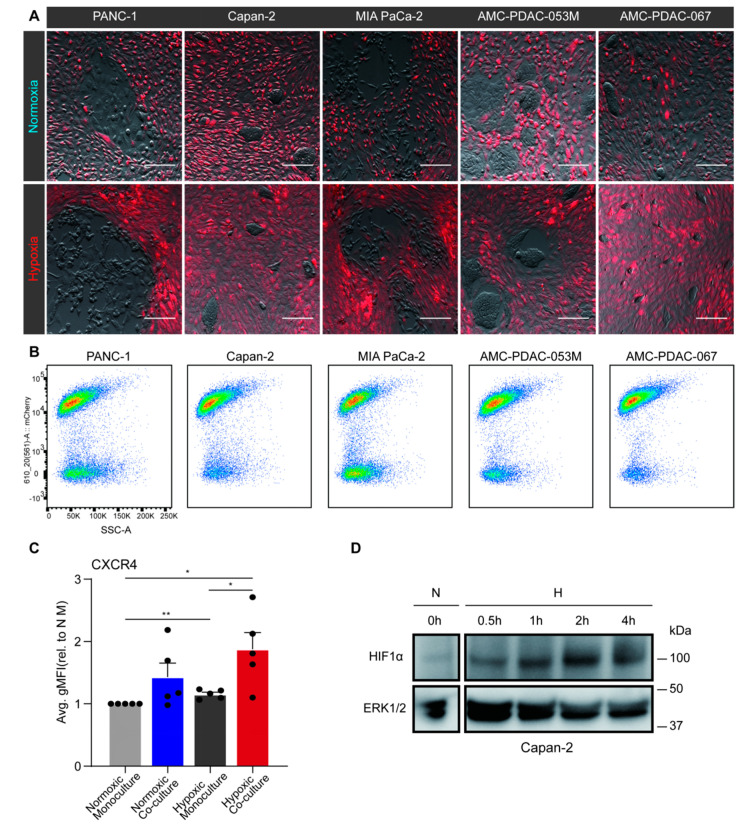
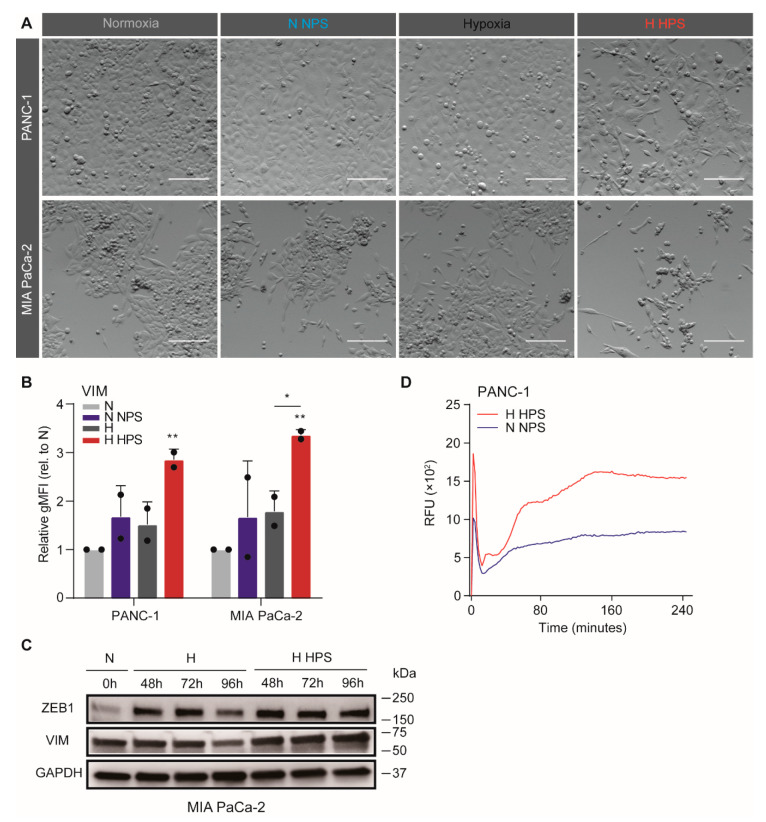
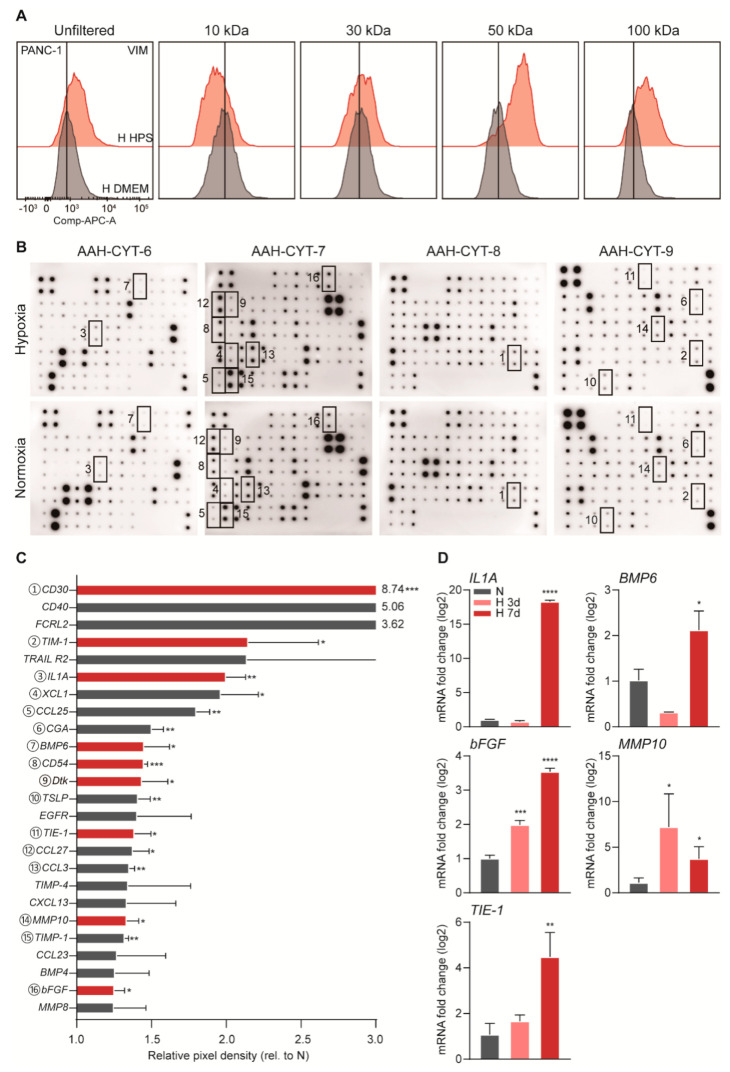
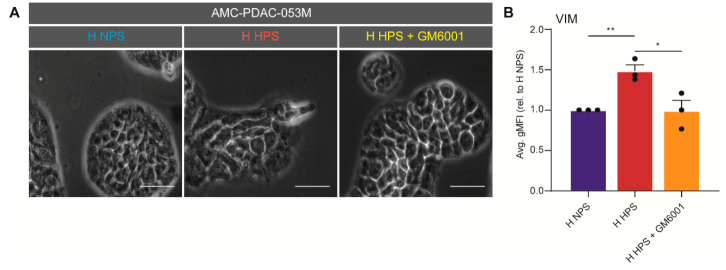
Pancreatic ductal adenocarcinoma (PDAC) is characterized by abundant stroma and a hypoxic microenvironment. Pancreatic stellate cells (PSC) are activated by hypoxia and promote excessive desmoplasia, further contributing to the development of hypoxia. We aimed to explore how hypoxia and stroma interact to contribute to invasive growth in PDAC. [18F]HX4 PET/CT was found to be a feasible non-invasive method to assess tumor hypoxia in 42 patients and correlated with HIF1α immunohistochemistry in matched surgical specimens. [18F]HX4 uptake and HIF1α were strong prognostic markers for overall survival. Co-culture and medium transfer experiments demonstrated that hypoxic PSCs and their supernatant induce upregulation of mesenchymal markers in tumor cells, and that hypoxia-induced stromal factors drive invasive growth in hypoxic PDACs. Through stepwise selection, stromal MMP10 was identified as the most likely candidate responsible for this. In conclusion, hypoxia-activated PSCs promote the invasiveness of PDAC through paracrine signaling. The identification of PSC-derived MMP10 may provide a lead to develop novel stroma-targeting therapies.

Keywords: epithelial-to-mesenchymal transition; hypoxia; pancreatic ductal adenocarcinoma; pancreatic stellate cells; stroma.


Conflict of interest statement

HWML has acted as a consultant for BMS, Eli Lilly and Company, MSD, Nordic Pharma Group/Taiho, and Servier, and has received unrestricted research grants from Amgen, Bayer Schering Pharma AG, BMS, Celgene, Eli Lilly and Company, GlaxoSmithKline Pharmaceuticals, MSD, Nordic Pharma Group, Philips, and Roche Pharmaceuticals. MFB has received research funding from Celgene and acted as a consultant to Servier. MGB has received research funding form Ethicon, Medtronic, and Mylan. None of these companies were involved in the design, conduct, or analysis of this study or drafting of the manuscript and decision to publish.

Figures

Figure A1
Figure A1
Hypoxia signatures associate with poor outcome and stroma activation in PDAC. (A) PDAC samples from the Bailey dataset were used. Kaplan–Meier survival analysis was performed by a hypoxia geneset expression and dichotomized by median. The curves are shown using genesets response to hypoxia, reactome regulation of hypoxia inducible factor hif by oxygen (B), reactome regulation of gene expression by hypoxia inducible factor (C), and semenza hif1 targets (D). (E) The correlation between normal/activated stroma genesets and hypoxia KEGG signaling pathway geneset was analyzed in six datasets as indicated. p value is indicated by color, correlation coefficient (R) by size of dot.
Figure A2
Figure A2
Hypoxic PS1 supernatant induces EMT only in hypoxic PDAC cells. Expression of VIM in PDAC cells was measured by flow cytometry and values were normalized to normoxic unconditioned medium group. Data show the average gMFI ± S.E.M. (* p < 0.05). Each dot refers to a cell line (PANC-1 and MIA PaCa-2).
Figure A3
Figure A3
Upregulation of IL1A or MMP10 correlates with poor prognosis. (A) Survival analysis on PDAC samples dichotomized by median IL1A and MMP10 (B) are shown. (C) PANC-1 and MIA PaCa-2 were cultured in NPS, NPS + IL1α 10 ng/mL and NPS + IL1α 100 ng/mL under hypoxia for 3 days before flow cytometry was performed for VIM expression. Levels of average gMFI ± S.E.M. were normalized to NPS group (* p < 0.05, ** p < 0.01). A dot refers to a cell line. (D) Both cell lines were also incubated in unconditioned medium, HPS, and HPS + anti-IL1α 100 ng/mL under hypoxia for 3 or 6 days. Values were normalized to unconditioned medium group. (E,F) Expression of VIM and ZEB1 in AMC-PDAC-053M, AMC-PDAC-067, AMC-PDAC-099, AsPC-1, Hs 766T, PSN-1, PANC-89, Capan-1 were assessed by flow cytometry following treatment of NPS, NPS + IL1α 10 ng/mL and NPS + IL1α 50 ng/mL under hypoxia for 3 days. Data were normalized to NPS group.
Figure 1
Figure 1
[18F]HX4 uptake correlates with metastatic disease, cellular hypoxia, and poor outcome. (A) An example of contrast MRI (left) of tumor and corresponding PET/CT scan (right) demonstrating the high [18F]HX4 intake area within the tumor. Scale bar: 10 cm. (B) Difference in [18F]HX4 TBRmax and HV (panel C) between patients with M0 and M1 stage disease. Significance was tested by two-tailed Mann–Whitney test. (D) Example of a patient with low (top) and high (bottom) [18F]HX4 uptake and the corresponding HIF1α stained slides of the tumor showing different degrees of cellular hypoxia. Scale bar: 200 µm. (E) Correlation between TBRmax (top), TBRpeak (bottom) and HIF1α positively stained nuclei in the tumor. Kaplan–Meier survival curves discriminating patients based on TBRmax > 1.64, TBRpeak > 1.55 and HV > 1mL. (F) Overall survival for the entire population. (G) Overall survival for patients where the tumor was surgically resected. (H) As for panel G, showing disease-free survival.
Figure 2
Figure 2
Hypoxia-activated pancreatic stellate cells (PSCs) promote epithelial-to-mesenchymal transition (EMT) in pancreatic ductal adenocarcinoma (PDAC) cells. (A) PS1 stellate cells were transduced with an mCherry fluorescent construct (red). Next, untransduced PANC-1, Capan-2, MIA PaCa-2, AMC-PDAC-053M, AMC-PDAC-067 PDAC cells were either co-cultured with mCherry-labeled PS1 or monocultured for 96 h under normoxia or hypoxia. Images are shown of co-cultured cells after 96-h normoxia (upper row) or hypoxia (lower row; brightness and contrast of the images were adjusted). Scale bar: 50 µm. (B) Flow cytometry cytoplot examples of the co-cultures as shown in panel A. Populations in the cytoplots indicate mCherry-positive PS1 cells and negative PDAC cells (mCherry signal is on Y-axis). Cells were dissociated from the coculture prior to fluorescence-activated cell sorting, separating the PS1 cells and PDAC cells. (C) CXCR4 expression of PDAC cells was determined by flow cytometry. Values represent the average gMFI ± S.E.M. of all PDAC cell lines and were normalized to normoxic monoculture group (* p < 0.05, ** p < 0.01). Each dot refers to a cell line (PANC-1, Capan-2, MIA PaCa-2, AMC-PDAC-053M, AMC-PDAC-067). (D) Capan-2 cells were incubated under hypoxic conditions for indicated times with normoxic incubation as a control. Cells were processed for Western blotting, using antibodies against HIF1α. ERK1/2 was used as loading control.
Figure 3
Figure 3
Soluble compounds released by hypoxia-activated stellate cells confer invasive phenotypes in tumor cells. (A) PS1 supernatant was harvested after 72-h hypoxia (or normoxia control) to generate hypoxic PS1 supernatant (HPS) and normoxic PS1 supernatant (NPS). Example images of PANC-1 (upper row) and MIA PaCa-2 (lower row) cells exposed to 3 days of NPS/DMEM under normoxia, or with HPS/DMEM under hypoxia (brightness and contrast of the photos were adjusted). Scale bar: 50 µm. (B) Expression of VIM in PDAC cells was measured by flow cytometry and values were normalized to normoxic unconditioned medium group. Data show the average gMFI ± S.E.M. (* p < 0.05, ** p < 0.01). (C) MIA PaCa-2 cells were incubated under conditions of H or H HPS for indicated times with normoxic incubation as a control. Cells were processed for Western blotting, using antibodies against ZEB1 and vimentin (VIM). GAPDH was used as loading control. (D) Transwell migration assays were performed on PANC-1 cells following treatments with NPS and normoxia, or HPS and hypoxia. 1% FCS was used as a chemoattractant. Migration curves are plotted with S.E.M. and corrected for no attractant controls (medium without FCS).
Figure 4
Figure 4
Candidate stromal cytokines upregulated in response to hypoxia. (A) PANC-1 cells were exposed to 3 days of unfiltered, 10, 30, 50, 100 kDa filtered HPS (upper row peaks) or unconditioned medium (lower row peaks). Flow cytometry was performed for VIM. (B) An AAH-CYT-4000 (RayBiotech, Norcross, GA, USA) cytokine array of four membranes was used to analyze HPS, with NPS as control. Pixel density was determined by measuring spot chemiluminescent signals in ImageJ, and calculated after correction for the negative and positive controls on the membranes and dividing by the NPS control. Coded boxes on membranes scans correspond to matching significantly upregulated cytokines listed in descending order in panel C. (C) All highly induced cytokines are plotted. Statistically significant upregulated cytokines within the size range determined (between 30–100 kD) are shown in red bars (* p < 0.05, ** p < 0.01, *** p < 0.001). (D) PS1 cells were incubated under hypoxia for 3 days or 7 days, with untreated as control. Candidate cytokine levels were determined by qPCR and normalized to control. Candidates of statistically significant upregulation are plotted (* p < 0.05, ** p < 0.01, *** p < 0.001).
Figure 5
Figure 5
Tumor cell EMT is driven by MMP10. (A) AMC-PDAC-053M cells were treated with NPS, HPS, and HPS + GM6001 under hypoxia. Scale bar: 20 µm. (B) Expression of VIM in cells were assessed by flow cytometry on PANC-1, AMC-PDAC-053M and AMC-PDAC-067. Data were normalized to NPS group and is shown by average gMFI ± S.E.M. (* p < 0.05, ** p < 0.01). A dot refers to a cell line.

Similar articles

Cited by

References

    1. Siegel R.L., Miller K.D., Jemal A. Cancer statistics, 2019. CA Cancer J. Clin. 2019;69:7–34. doi: 10.3322/caac.21551. - DOI - PubMed
    1. Xu Z., Pothula S.P., Wilson J.S., Apte M.V. Pancreatic cancer and its stroma: A conspiracy theory. World J. Gastroenterol. 2014;20:11216–11229. doi: 10.3748/wjg.v20.i32.11216. - DOI - PMC - PubMed
    1. Cohen R., Neuzillet C., Tijeras-Raballand A., Faivre S., de Gramont A., Raymond E. Targeting cancer cell metabolism in pancreatic adenocarcinoma. Oncotarget. 2015;6:16832–16847. doi: 10.18632/oncotarget.4160. - DOI - PMC - PubMed
    1. Viale A., Pettazzoni P., Lyssiotis C.A., Ying H., Sanchez N., Marchesini M., Carugo A., Green T., Seth S., Giuliani V., et al. Oncogene ablation-resistant pancreatic cancer cells depend on mitochondrial function. Nature. 2014;514:628–632. doi: 10.1038/nature13611. - DOI - PMC - PubMed
    1. Erkan M., Hausmann S., Michalski C.W., Fingerle A.A., Dobritz M., Kleeff J., Friess H. The role of stroma in pancreatic cancer: Diagnostic and therapeutic implications. Nat. Rev. Gastroenterol. Hepatol. 2012;9:454–467. doi: 10.1038/nrgastro.2012.115. - DOI - PubMed

LinkOut - more resources