. 2020 Oct 22;12(11):3225.
doi: 10.3390/nu12113225.

Prebiotic Xylo-Oligosaccharides Ameliorate High-Fat-Diet-Induced Hepatic Steatosis in Rats

Affiliations

Prebiotic Xylo-Oligosaccharides Ameliorate High-Fat-Diet-Induced Hepatic Steatosis in Rats

Sanna Lensu et al. Nutrients. .

Abstract

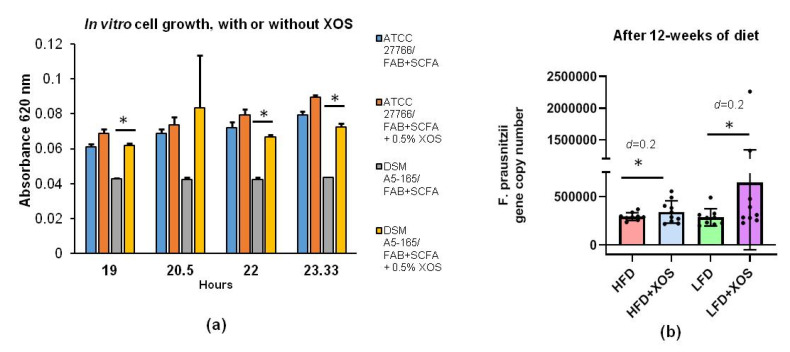
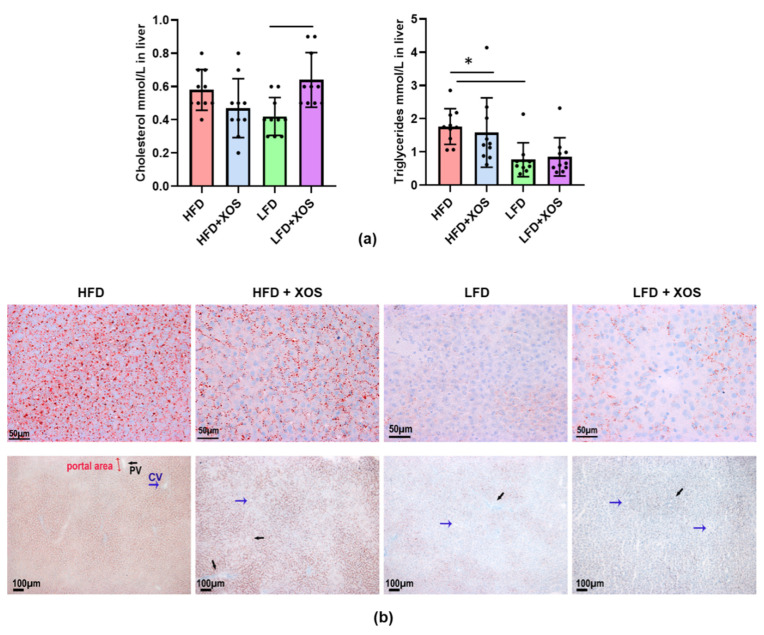
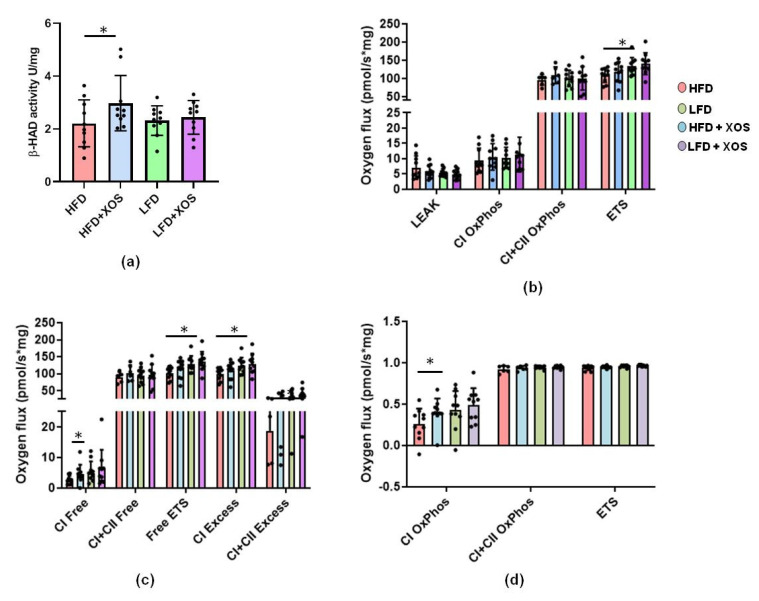
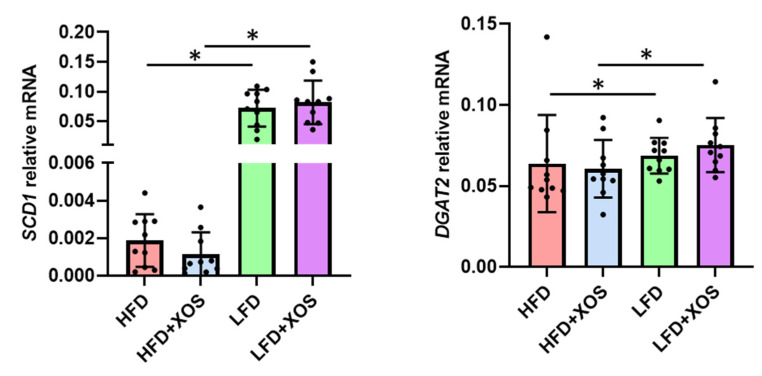
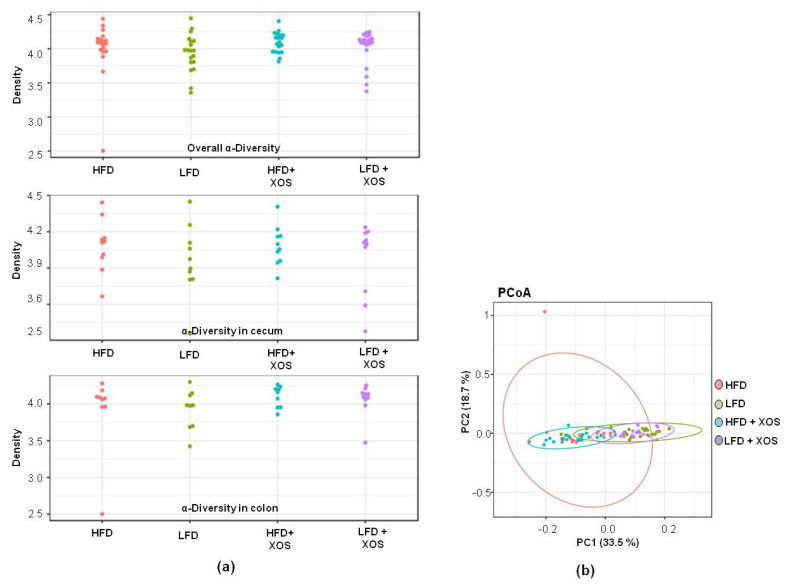
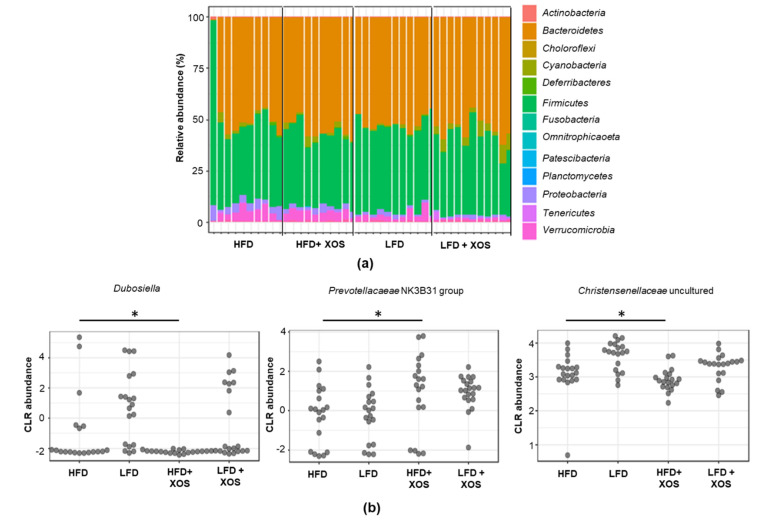
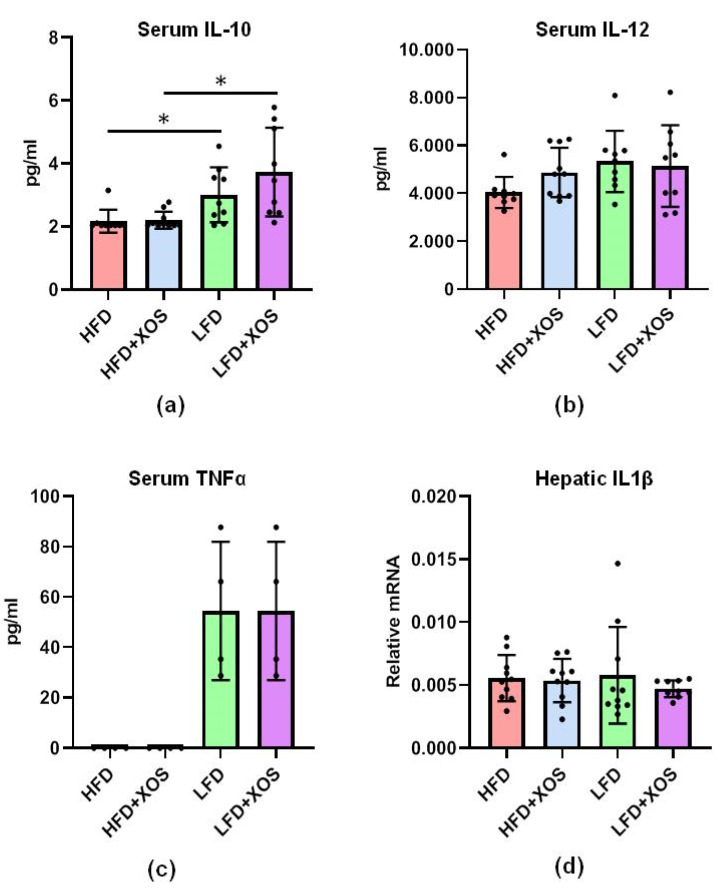
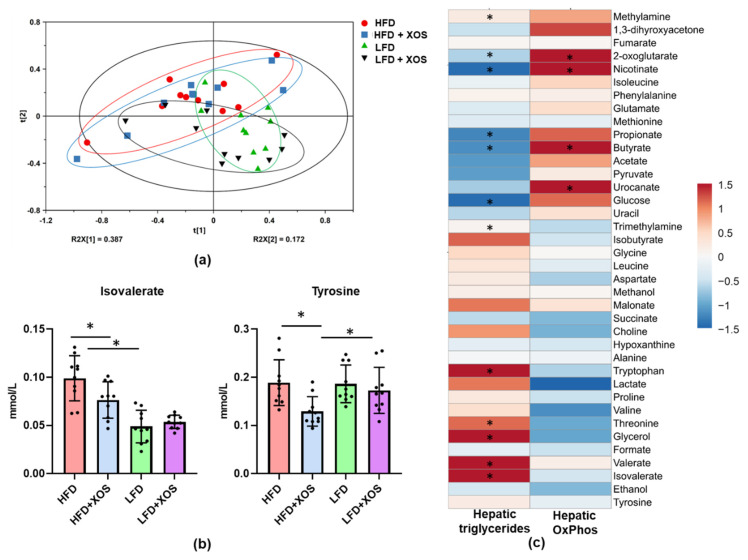
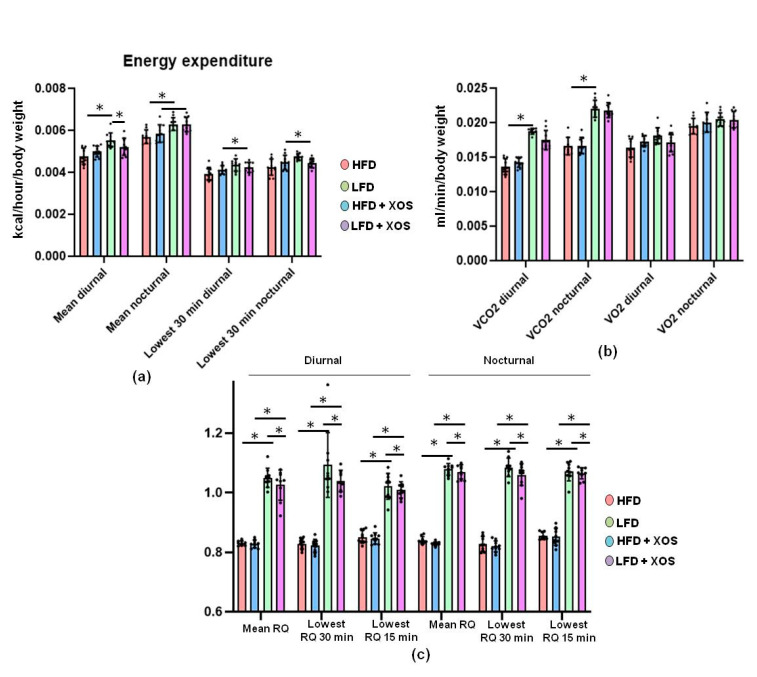
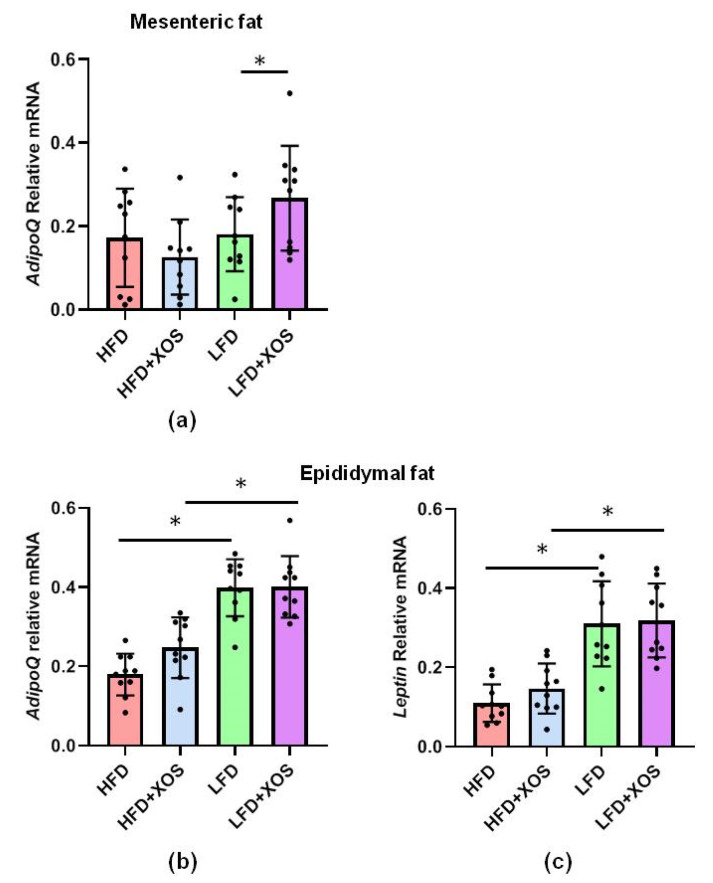
Understanding the importance of the gut microbiota (GM) in non-alcoholic fatty liver disease (NAFLD) has raised the hope for therapeutic microbes. We have shown that high hepatic fat content associated with low abundance of Faecalibacterium prausnitzii in humans and, further, the administration of F. prausnitzii prevented NAFLD in mice. Here, we aimed at targeting F. prausnitzii by prebiotic xylo-oligosaccharides (XOS) to treat NAFLD. First, the effect of XOS on F. prausnitzii growth was assessed in vitro. Then, XOS was supplemented or not with high (HFD, 60% of energy from fat) or low (LFD) fat diet for 12 weeks in Wistar rats (n = 10/group). XOS increased F. prausnitzii growth, having only a minor impact on the GM composition. When supplemented with HFD, XOS ameliorated hepatic steatosis. The underlying mechanisms involved enhanced hepatic β-oxidation and mitochondrial respiration. Nuclear magnetic resonance (1H-NMR) analysis of cecal metabolites showed that, compared to the HFD, the LFD group had a healthier cecal short-chain fatty acid profile and on the HFD, XOS reduced cecal isovalerate and tyrosine, metabolites previously linked to NAFLD. Cecal branched-chain fatty acids associated positively and butyrate negatively with hepatic triglycerides. In conclusion, XOS supplementation can ameliorate NAFLD by improving hepatic oxidative metabolism and affecting GM.

Keywords: fatty liver; gut microbiota; metabolism; mitochondria; oligosaccharides; prebiotic.


Conflict of interest statement

The authors declare no conflict of interest. The funders had no role in the design of the study; in the collection, analyses, or interpretation of data; in the writing of the manuscript, or in the decision to publish the results.

Figures

Figure 1
Figure 1
Xylo-oligosaccharides (XOS) increased the growth of F. prausnitzii in vitro and in vivo. (a) In vitro stimulation of F. prausnitzii growth with XOS. Cultivations of F. prausnitzii were done in fastidious anaerobe broth (FAB) supplemented with short-chain fatty acids (SCFA) in an anaerobic workstation. Ten mL cultures of commercially available F. prausnitzii strains American type of culture collections (ATCC)®-27766™ and Deutsche Sammlung von Mikroorganismen und Zellkulturen GmbH (DSM) A2-165 were supplemented or not with XOS as 0.5% (w/v%). The growth of F. prausnitzii was determined by following changes in the optical density at 620 nm. n = 4 replicates/treatments. * indicates statistically significant difference between the groups; (b) Quantitative real-time PCR of F. prausnitzii using DNA extracted from the rat cecum after 12 weeks of diet. The results are shown as gene copy number divided per gram of cecum content used to extract the total bacterial DNA. Cohen’s d was used to estimate the differences between the groups. n = 8–10/diet group. The different data points are shown with black dots. HFD = high-fat diet. LFD = low-fat diet. * indicates statistically significant difference between the groups.
Figure 2
Figure 2
XOS decreased hepatic fat content in rats fed with HFD. (a) The biochemical analyses of the total hepatic cholesterol and triglyceride content. n = 8–10/diet group. The different data points are shown with black dots. * indicates statistically significant difference between the groups; (b) The frozen liver sections of the rats stained with Oil Red O. The scale bar in the upper images is 50 µM and in the lower images 100 µM. The histological images were taken with Olympus BX50 microscope and Colorview III camera using 40× (Olympus UPlanFI, NA 0.75) and 10× (Olympus UPlanFI NA 0.3) objectives. Blue arrows indicate central vein, which is abbreviated as CV in the lower image of the HFD. Black arrows indicate portal vein, which is abbreviated as PV in the lower image of the HFD.
Figure 3
Figure 3
XOS enhanced the hepatic activity of fatty acid-oxidating beta-hydroxydeacetylase dehydrogenase (β-HAD) on the HFD and also increased mitochondrial respiration, reflecting increased glucose metabolism. (a) The biochemically measured activities of β-HAD in rat livers. n = 8–10/diet group; (b) HFD lowered maximal electron transport (ETS) in liver mitochondria. n = 8–10/diet group; (c) HFD lowered maximal electron transport capacity available for oxidative phosphorylation (Free ETS), reserve electron transport capacity beyond oxidative phosphorylation through complex I (CI Excess) as well as through complexes I and II (C+CII Excess). On the HFD, XOS increased the respiratory capacity available for the production of ATP through the electron flow from complex I (CI Free). n = 8–10/diet group; (d) On the HFD, XOS improved coupling of electron transport through the complex I and oxidative phosphorylation (CI OxPhos, coupling efficiency). n = 8–10/diet group. In all graphs, the different data points are shown with black dots. * indicates statistically significant difference between the groups in all graphs.
Figure 4
Figure 4
XOS did not affect the hepatic mRNA expression of stearoyl coenzyme desaturase 1 (SCD1) or Diacylglycerol O-acyltransferase 2 (DGAT2). n = 8–10/diet group. The different data points are shown with black dots. * indicates statistically significant difference between the groups.
Figure 5
Figure 5
No significant associations were observed between the diets and the diversity of the gut microbiota. (a) The overall alpha-diversity (on top), alpha-diversity in colon (at the middle) and cecum (on bottom) of the gut microbiota. n = 10/diet group. The alpha-diversity of the gut microbiota was quantified with Shannon index using microbiome R/Bioconductor package; (b) The beta-diversity of the gut microbiota according to the principal component analysis (PCoA). PC1 indicates principal component 1 and PC2 principal component 2. n = 10/diet group. The analysis of beta-diversity was based on Bray–Curtis distance, and PERMANOVA was used for significance testing (adonis function in the vegan R package).
Figure 6
Figure 6
Differences were found in the abundance of three gut microbiota genera between the diet groups. (a) The gut microbiota composition of the rats at phylum level did not differ between the groups. n = 10/diet group. The taxonomic groups were compared based on DESeq2 using phyloseq R/Bioconductor package including Benjamini–Hochberg correction for multiple testing. (b) Differences between the groups were found in the relative abundance of Dubosiella, Prevotellaceae NK3B31 and uncultured genus of Christensenellaceae family. n = 10/diet group. The taxonomic groups were compared based on DESeq2 using phyloseq R/Bioconductor package including Benjamini–Hochberg correction for multiple testing. CLR abundance = centered log-ratio transformed abundance. * indicates statistically significant difference between the groups.
Figure 7
Figure 7
XOS improved the HFD-induced injury and inflammatory markers in the proximal colon. The histopathological examination detected an interactive effect of diet and XOS on the (a) surface epithelial injury; (b) Goblet cell hyperplasia; (c) crypt length distortion and; (d) injury score; (e) On the LFD, XOS increased monocyte aggregates; (f) The diets did not affect the lymphocyte aggregates. n = 8–10/diet group. The different data points are shown with black dots in all graphs. * denotes statistically significant difference between the groups in all graphs.
Figure 8
Figure 8
The intestinal Tjp1 did not differ between the diet groups. (a) The histological images were taken with Zeiss laser scanning microscopy (LSM) 700 and 20 x Plan-Apochromat 20 x/0.8 M27 objective. Tjp1 is shown with red label and 4′,6-diamidino-2-phenylindole (DAPI) in blue. The scale bar is 100 µM; (b) The bars in the graph represent the expression of Tjp1 counted as its intensity using Image J adjusted to the intensity of DAPI. n = 9–10/diet group. The different data points are shown with black dots.
Figure 9
Figure 9
XOS supplementation did not affect the serum levels of (a) IL-10; (b) IL-12 or; (c) TNFα or; (d) the hepatic IL1β mRNA but the LFD groups had higher levels of anti-inflammatory IL-10. The serum cytokines were analyzed after 12 weeks of diet intervention using 9-plex ELISA, Quansys and Q-View software. Out of nine cytokines, only the levels of IL-10, IL-12 and TNFα were detectable in rats. IL1β mRNA was analyzed from hepatic cDNA with qPCR. n = 8–10/diet group. The different data points are shown with black dots in all graphs. * indicates statistically significant difference between the groups in all graphs.
Figure 10
Figure 10
XOS decreased the levels of cecal tyrosine and isovalerate on the HFD. (a) The score scatter plot of the Principal Component Analysis (PCA) of the cecal metabolites showed no major differences between the diet groups. n = 10/diet group; (b) The levels of cecal tyrosine and isovalerate differed between the diet groups. n = 10/diet group. The different data points are shown with black dots. * indicates significant difference between the groups; (c) The associations of the metabolites with the hepatic triglyceride content and oxidative phosphorylation. n = 10/diet group. The heatmap was drawn using Clustvis, which is a web tool used to visualize clustering of multivariate data (https://biit.cs.ut.ee/clustvis/). However, the clustering is not shown here. * indicates significant association between the variables. The colored scale bar for the associations is shown on the right, and the color corresponds to the value of Spearman’s correlation coefficient.
Figure 11
Figure 11
The LFD increased the energy expenditure in rats, while XOS and diet had an interactive effect on the respiratory quotient. (a) The average hourly energy expenditure was highest at nighttime in the LFD and the lowest measured energy expenditure was highest in the LFD at daytime; (b) The HFD diminished the production of CO2 at daytime, whereas in O2 consumption, no differences between the groups were found; (c) The respiratory quotient (RQ) values were calculated as VCO2/VO2. The different data points are shown with black dots. * indicates statistically significant difference between the groups.
Figure 12
Figure 12
On the HFD, XOS did not affect the expression of leptin or adiponectin mRNA. The diet or XOS had no main effects on the expression of (a) adiponectin (AdipoQ) mRNA in the mesenteric adipose tissue, but on the LFD, XOS had an increasing effect on its expression. In the epididymal adipose tissue the diet but not XOS had an effect the expression of (b) leptin and; (c) AdipoQ mRNA. n = 8–10/diet group. The different data points are shown with black dots in all graphs. * indicates statistically significant difference between the groups in all graphs.

Similar articles

Cited by

References

    1. Araujo A.R., Rosso N., Bedogni G., Tiribelli C., Bellentani S. Global epidemiology of non-alcoholic fatty liver disease/non-alcoholic steatohepatitis: What we need in the future. Liver Int. 2018;38(Suppl. S1):47–51. doi: 10.1111/liv.13643. - DOI - PubMed
    1. Wong V.W., Wong G.L., Choi P.C., Chan A.W., Li M.K., Chan H.Y., Chim A.M., Yu J., Sung J.J., Chan H.L. Disease progression of non-alcoholic fatty liver disease: A prospective study with paired liver biopsies at 3 years. Gut. 2010;59:969–974. doi: 10.1136/gut.2009.205088. - DOI - PubMed
    1. McPherson S., Hardy T., Henderson E., Burt A.D., Day C.P., Anstee Q.M. Evidence of NAFLD progression from steatosis to fibrosing-steatohepatitis using paired biopsies: Implications for prognosis and clinical management. J. Hepatol. 2015;62:1148–1155. doi: 10.1016/j.jhep.2014.11.034. - DOI - PubMed
    1. Tilg H., Moschen A.R. Evolution of inflammation in nonalcoholic fatty liver disease: The multiple parallel hits hypothesis. Hepatology. 2010;52:1836–1846. doi: 10.1002/hep.24001. - DOI - PubMed
    1. Ozcan L., Ergin A.S., Lu A., Chung J., Sarkar S., Nie D., Myers M.G., Jr., Ozcan U. Endoplasmic reticulum stress plays a central role in development of leptin resistance. Cell Metab. 2009;9:35–51. doi: 10.1016/j.cmet.2008.12.004. - DOI - PubMed

MeSH terms