. 2020 Oct 22;21(21):7814.
doi: 10.3390/ijms21217814.

Investigation of the Impact from IL-2, IL-7, and IL-15 on the Growth and Signaling of Activated CD4+ T Cells

Affiliations

Investigation of the Impact from IL-2, IL-7, and IL-15 on the Growth and Signaling of Activated CD4+ T Cells

Canaan Coppola et al. Int J Mol Sci. .

Abstract

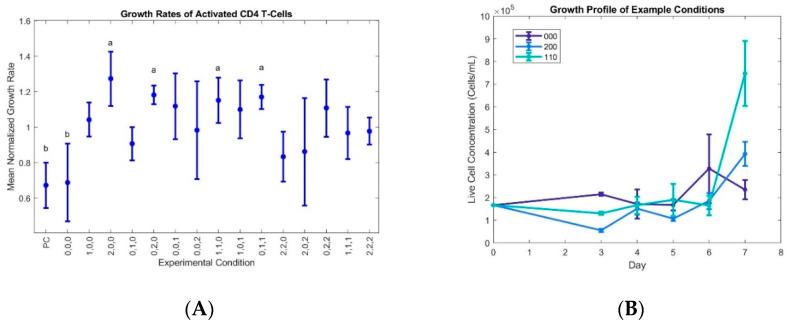
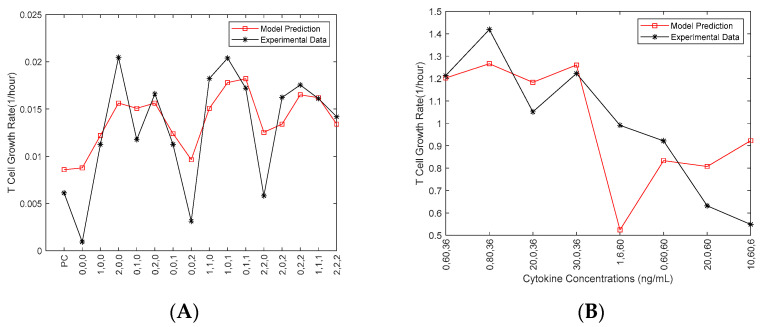
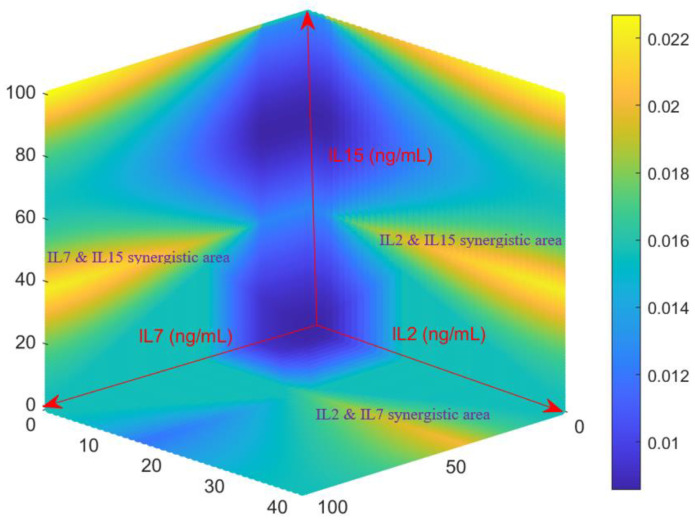
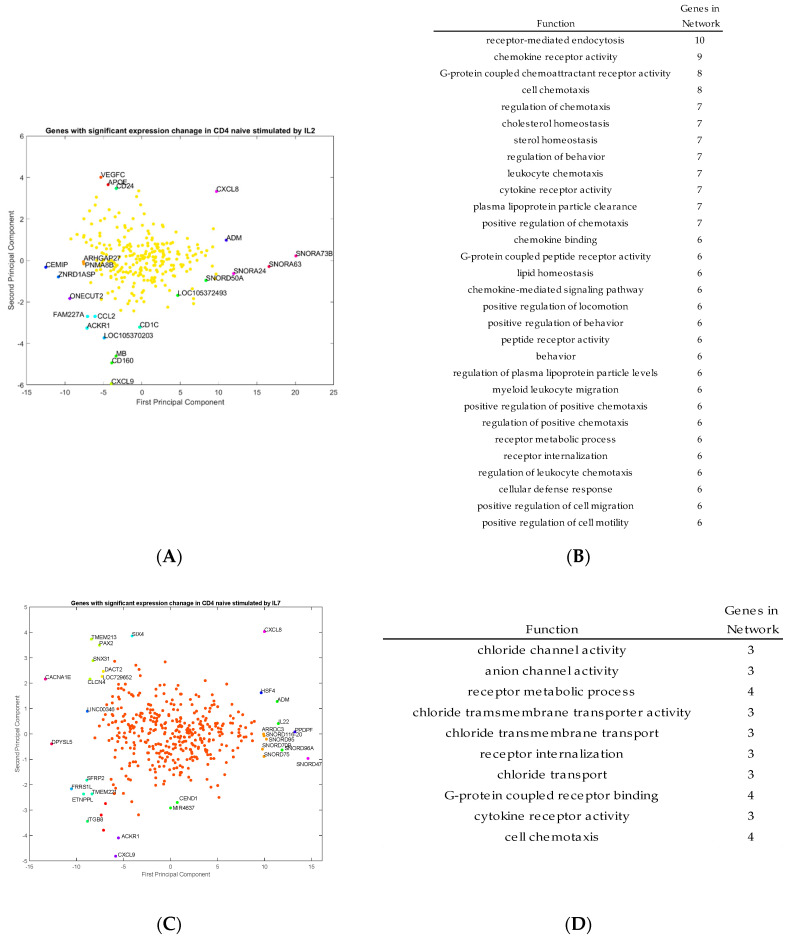
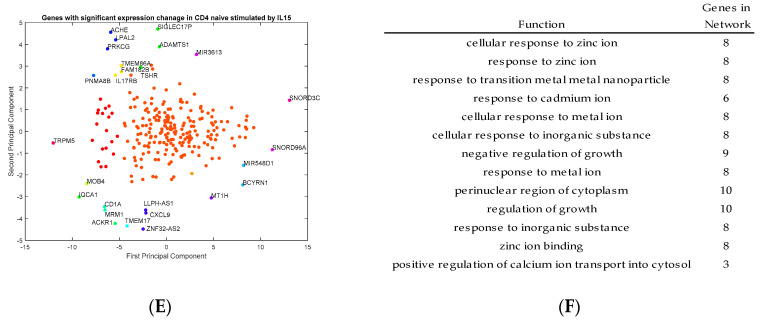
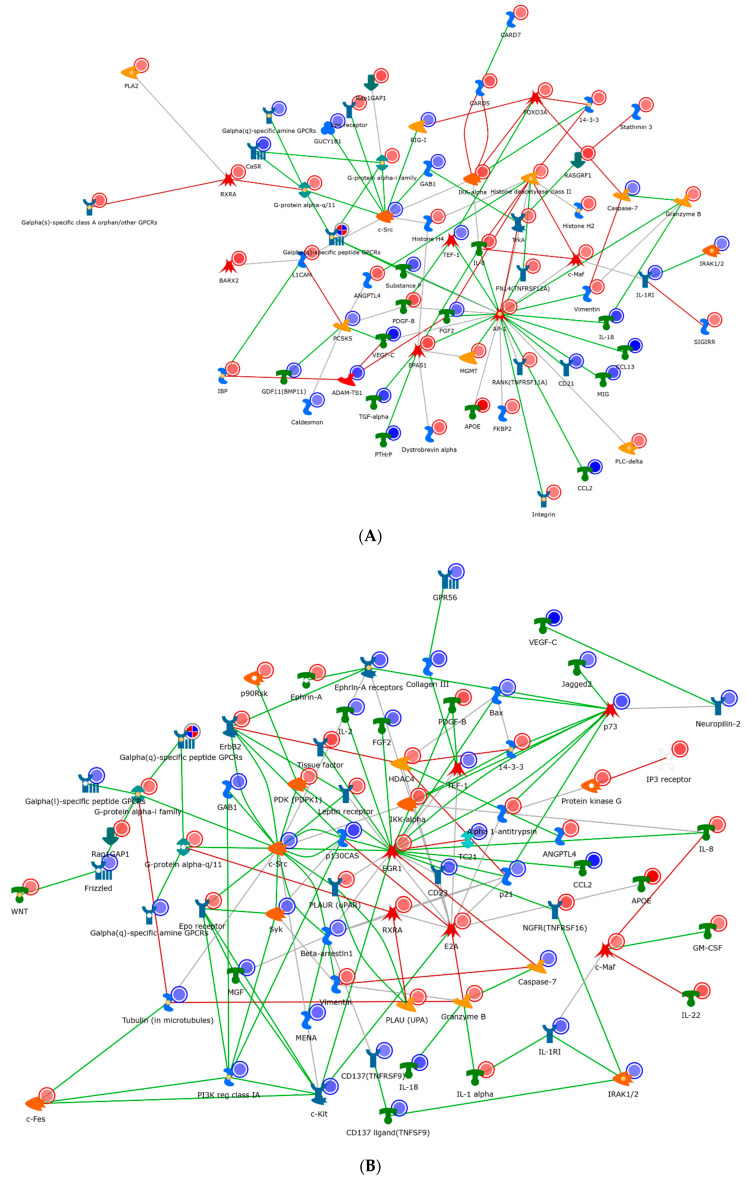
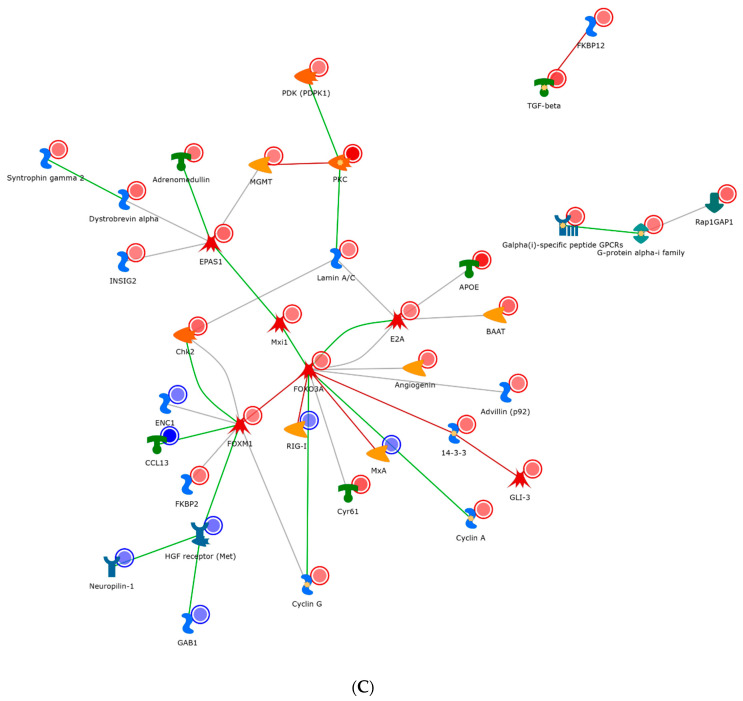
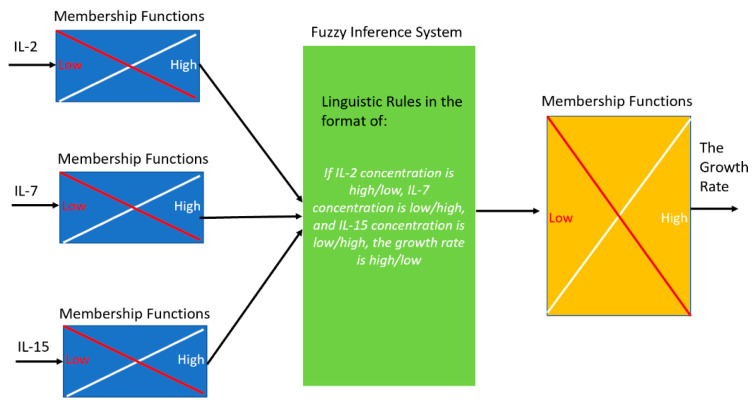
While CAR-T therapy is a growing and promising area of cancer research, it is limited by high cost and the difficulty of consistently culturing T-cells to therapeutically relevant concentrations ex-vivo. Cytokines IL-2, IL-7 and IL-15 have been found to stimulate the growth of T cells, however, the optimized combination of these three cytokines for T cell proliferation is unknown. In this study, we designed an integrated experimental and modeling approach to optimize cytokine supplementation for rapid expansion in clinical applications. We assessed the growth data for statistical improvements over no cytokine supplementation and used a systems biology approach to identify genes with the highest magnitude of expression change from control at several time points. Further, we developed a predictive mathematical model to project the growth rate for various cytokine combinations, and investigate genes and reactions regulated by cytokines in activated CD4+ T cells. The most favorable conditions from the T cell growth study and from the predictive model align to include the full range of IL-2 and IL-7 studied, and at lower levels of IL-15 (6 ng/mL or 36 ng/mL). The highest growth rates were observed where either IL-2 or IL-7 was at the highest concentration tested (15 ng/mL for IL-2 and 80 ng/mL for IL-7) while the other was at the lowest (1 ng/mL for IL-2 and 6 ng/mL for IL-7), or where both IL-2 and IL-7 concentrations are moderate-corresponding to condition keys 200, 020, and 110 respectively. This suggests a synergistic interaction of IL-2 and IL-7 with regards to promoting optimal proliferation and survival of the activated CD4+ T cells. Transcriptomic data analysis identified the genes and transcriptional regulators up/down-regulated by each of the cytokines IL-2, IL-7, and IL-15. It was found that the genes with persistent expressing changes were associated with major pathways involved in cell growth and proliferation. In addition to influencing T cell metabolism, the three cytokines were found to regulate specific genes involved in TCR, JAK/STAT, MAPK, AKT and PI3K-AKT signaling. The developed Fuzzy model that can predict the growth rate of activated CD4+ T cells for various combinations of cytokines, along with identified optimal cytokine cocktails and important genes found in transcriptomic data, can pave the way for optimizing activated CD4 T cells by regulating cytokines in the clinical setting.

Keywords: RNA sequencing; activated CD4+ T cell; interleukin-15; interleukin-2; interleukin-7.


Conflict of interest statement

The authors declare no conflict of interest.

Figures

Figure 1
Figure 1
Various combinations of the IL-2, IL-7, and IL-15 cytokines differentially regulate activated CD4+ lymphocyte proliferation: (A) Mean growth rate data were obtained in four data sets, with growth rates calculated for a four-day period after post-thaw acclimation, and each set normalized to its respective average growth rate. Error bars represent ± 1 SE, and grouping letters show statistically significant differences (α < 0.05) as measured by pairwise t-tests. p-values are shown in Table 1. Note: “a” in the figure indicates conditions with growth rates significantly higher than the negative control and the baseline 000 conditions; and “b” represents the negative control and 000 conditions (see Table 5 for experimental concentrations). (B) Example growth profile of selected conditions, where cytokines were added on day 3 and growths rates calculated between days 3 and 7. Error bars represent ± 1 SD. Full data sets are available upon request.
Figure 2
Figure 2
Fuzzy model prediction with experimental data from September (A); Fuzzy Model prediction with experimental data from October (B). Experimental data in (A) is from a single dataset used to estimate parameters for the fuzzy model, and model predictions in (B) were tested in a second experimental run to validate the model predictions and analyze the choice of cytokine concentrations for future experiments. MATLAB was used for these modeling studies.
Figure 3
Figure 3
The growth rates of activated CD4+ T-cells (hr−1) predicted by the model for different combinations of cytokines. The model was assessed over the entire concentration space investigated by the growth studies to generate this map, with all possible combinations of IL-2   [0–40 ng/mL], IL-7 [0–100 ng/mL], and IL-15 [0–100 ng/mL]. The growth rate scale in (hr−1) are shown on the right, with yellow representing fastest proliferation and dark blue the lowest.
Figure 4
Figure 4
Principal component analysis (PCA) projections of genes with significant expression change by IL-2 (A), IL-7(C) and IL-15 (E) stimulation, with corresponding and respective gene function of IL-2 (B), IL-7 (D), and IL-15 (F) in activated CD4+ T cells. IL2 mainly regulated genes related to cell and leukocyte chemotaxis, chemokine receptor activity, cellular defense response and cell motility, while IL7 regulated genes involved in chloride transport, cell chemotaxis, chloride transmembrane activity, and cytokine receptor activity. The genes regulated by IL15 were involved in cell growth, zinc ion responses, cellular response to metal ions, and regulation of calcium ion transport into the cell.
Figure 4
Figure 4
Principal component analysis (PCA) projections of genes with significant expression change by IL-2 (A), IL-7(C) and IL-15 (E) stimulation, with corresponding and respective gene function of IL-2 (B), IL-7 (D), and IL-15 (F) in activated CD4+ T cells. IL2 mainly regulated genes related to cell and leukocyte chemotaxis, chemokine receptor activity, cellular defense response and cell motility, while IL7 regulated genes involved in chloride transport, cell chemotaxis, chloride transmembrane activity, and cytokine receptor activity. The genes regulated by IL15 were involved in cell growth, zinc ion responses, cellular response to metal ions, and regulation of calcium ion transport into the cell.
Figure 5
Figure 5
Gene regulatory networks stimulated by IL-2 (A), IL-7 (B), and IL-15 (C) in activated CD4+ T cells. The meaning of the icons/modules shown in this figure can be found in the software MetaCore. The IL-2 network was clustered through the oncogene Src, general GPCR signaling, and the transcription factor AP-1. The IL-7 network shared many similar factors as the IL2 one, but it included and expanded repertoire of nodes, specifically around the transcriptional regulators (EGR1, P73, and E2A). The IL-15 network appeared the most dissimilar to IL-2/7 and radiated through a hub of the transcription factors FOXM1 and EPAS1 and cellular morphogenesis.
Figure 5
Figure 5
Gene regulatory networks stimulated by IL-2 (A), IL-7 (B), and IL-15 (C) in activated CD4+ T cells. The meaning of the icons/modules shown in this figure can be found in the software MetaCore. The IL-2 network was clustered through the oncogene Src, general GPCR signaling, and the transcription factor AP-1. The IL-7 network shared many similar factors as the IL2 one, but it included and expanded repertoire of nodes, specifically around the transcriptional regulators (EGR1, P73, and E2A). The IL-15 network appeared the most dissimilar to IL-2/7 and radiated through a hub of the transcription factors FOXM1 and EPAS1 and cellular morphogenesis.
Figure 6
Figure 6
An illustrative diagram of the fuzzy model to link the cytokine concentrations to the T cell growth rate. Membership functions were used to evaluate the possibility of each cytokine to be low or high (i.e., fuzzification), which is followed by the linguistic rules (i.e., inference) to determine the growth rate (i.e., defuzzification).

References

    1. Das K.R., Vernau L., Grupp S.A., Barrett D.M. Naive T-cell Deficits at Diagnosis and after Chemotherapy Impair Cell Therapy Potential in Pediatric Cancers. Cancer Discov. 2019;9:492–499. doi: 10.1158/2159-8290.CD-18-1314. - DOI - PMC - PubMed
    1. Read K.A., Powell M.D., McDonald P.W., Oestreich K.J. IL-2, IL-7 and IL-15: Multistage regulators of CD4+ T helper cell differentiation. Exp. Hematol. 2016;44:799–808. doi: 10.1016/j.exphem.2016.06.003. - DOI - PubMed
    1. Geginat J., Sallusto F., Lanzavecchia A. Cytokine-driven Proliferation and Differentiation of Human Naive, Central Memory, and Effector Memory CD4+ T Cells. J. Exp. Med. 2001;194:1711–1720. doi: 10.1084/jem.194.12.1711. - DOI - PMC - PubMed
    1. Jaleco S., Swainson L., Dardalhon V., Burjanadze M., Kinet S., Taylor N. Homeostasis of Naive and Memory CD4+ T Cells: IL-2 and IL-7 Differentially Regulate the Balance Between Proliferation and Fas-Mediated Apoptosis. J. Immunol. 2003;171:61–68. doi: 10.4049/jimmunol.171.1.61. - DOI - PubMed
    1. Alves L.N., Hooibrink B., Arosa F.A., van Lier R.A.W. IL-15 induces antigen-independent expansion and differentiation of human naive CD8+ T cells in vitro. Blood. 2003;102:2541–2546. doi: 10.1182/blood-2003-01-0183. - DOI - PubMed

MeSH terms