. 2020 Oct 22;12(11):1003.
doi: 10.3390/pharmaceutics12111003.

Recombinant Myxoma Virus-Derived Immune Modulator M-T7 Accelerates Cutaneous Wound Healing and Improves Tissue Remodeling

Affiliations

Recombinant Myxoma Virus-Derived Immune Modulator M-T7 Accelerates Cutaneous Wound Healing and Improves Tissue Remodeling

Jordan R Yaron et al. Pharmaceutics. .

Abstract

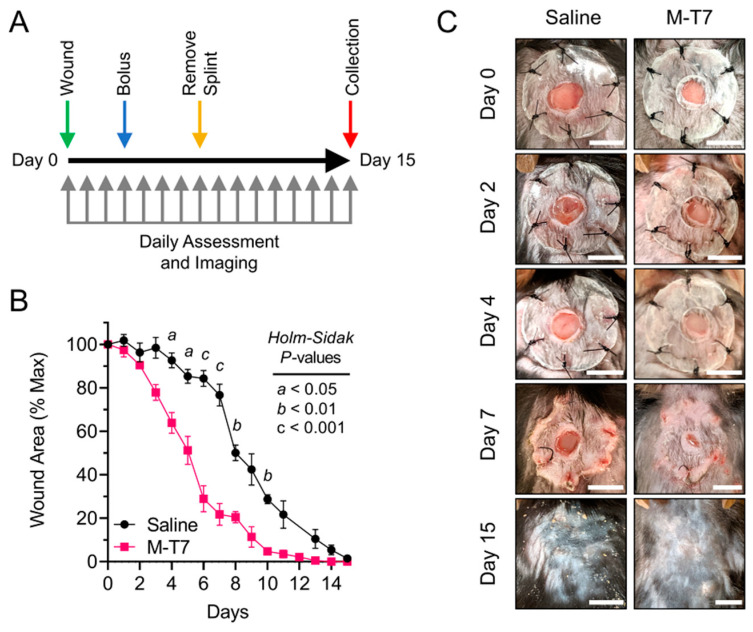
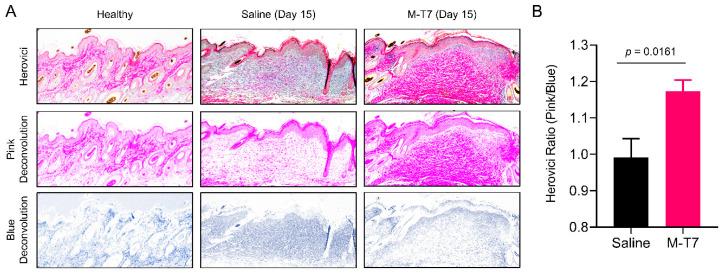
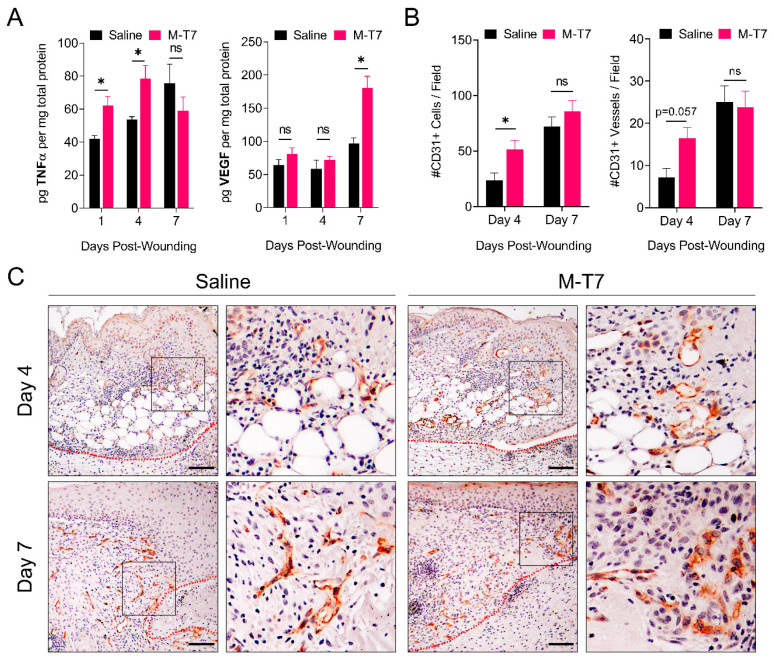
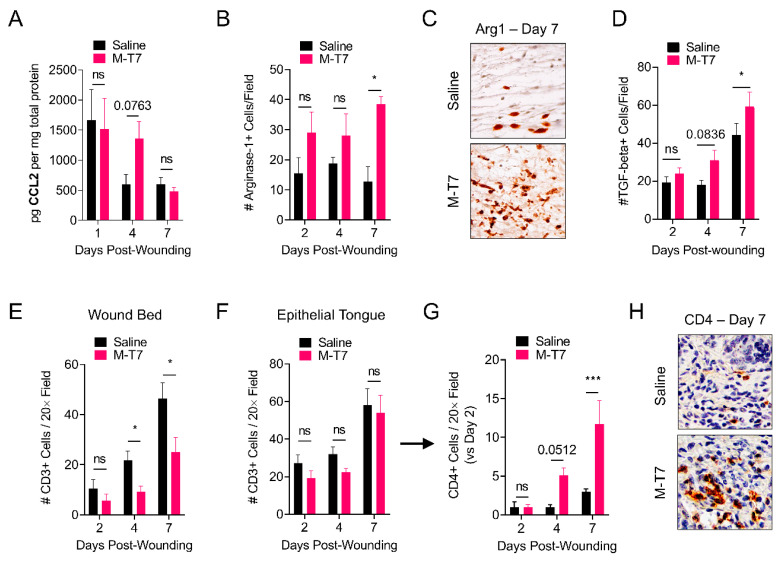
Complex dermal wounds represent major medical and financial burdens, especially in the context of comorbidities such as diabetes, infection and advanced age. New approaches to accelerate and improve, or "fine tune" the healing process, so as to improve the quality of cutaneous wound healing and management, are the focus of intense investigation. Here, we investigate the topical application of a recombinant immune modulating protein which inhibits the interactions of chemokines with glycosaminoglycans, reducing damaging or excess inflammation responses in a splinted full-thickness excisional wound model in mice. M-T7 is a 37 kDa-secreted, virus-derived glycoprotein that has demonstrated therapeutic efficacy in numerous animal models of inflammatory immunopathology. Topical treatment with recombinant M-T7 significantly accelerated wound healing when compared to saline treatment alone. Healed wounds exhibited properties of improved tissue remodeling, as determined by collagen maturation. M-T7 treatment accelerated the rate of peri-wound angiogenesis in the healing wounds with increased levels of TNF, VEGF and CD31. The immune cell response after M-T7 treatment was associated with a retention of CCL2 levels, and increased abundances of arginase-1-expressing M2 macrophages and CD4 T cells. Thus, topical treatment with recombinant M-T7 promotes a pro-resolution environment in healing wounds, and has potential as a novel treatment approach for cutaneous tissue repair.

Keywords: chemokine; immune modulator; recombinant protein therapeutic; tissue remodeling; wound healing.


Conflict of interest statement

The authors declare no conflict of interest.

Figures

Figure 1
Figure 1
M-T7 accelerates full-thickness wound healing in mice. (A) Experimental design overview. Mice were wounded on day 0 (green arrow) and followed to day 15 post-wounding (red arrow), at which time mice were euthanized and tissue was collected. Mice were treated with saline or M-T7 on day 0 with a second bolus give on day 3 post-wounding (blue arrow). Mice were anesthetized and splints were removed on day 7 post-wounding (yellow arrow). Mice were assessed daily and images were collected for planimetric measurement of wound closure (gray arrows). N = 5 in each group. (B) Planimetric measurements of wound closure normalized to day 0 for each mouse. Mean and standard error are shown. Statistics were calculated by T-test per-day with correction for multiple comparisons by the Holm–Sidak method. For significance, a equates to p < 0.05, b equates to p < 0.01 and c equates to p < 0.001. (C) Representative wound images for saline and M-T7-treated mice on the day of wounding (day 0) and on days 2, 4, 7 and 15 post-wounding. The same mouse is shown in each image per condition. Scale bars are 5 mm.
Figure 2
Figure 2
Quantitative assessment of collagen maturation in wounds treated with M-T7. (A) Representative micrographs of Herovici’s polychrome-stained normal skin and wounds at 15 days post-wounding. Top panels show brightfield data, while middle and bottom panels show color-deconvoluted fields for the pink and blue chromophores. (B) Quantification of collagen maturation in saline and M-T7 treated wounds by the Herovici Ratio, calculated by the densitometric ratio of the pink and blue chromophores in Herovici’s polychrome. Mean and standard error are shown. Statistics were calculated by T-test. N = 4 saline, N = 5 M-T7.
Figure 3
Figure 3
Assessment of peri-wound angiogenesis in wounds treated with M-T7. (A) ELISA quantification of TNFα and VEGF in wound tissues treated with saline or M-T7 collected on days 1, 4 and 7 post-wounding normalized to total protein. Bars are mean and standard error. Statistics were calculated by two-way ANOVA with Fisher’s LSD post-hoc analysis. (B) Quantification of CD31+ cells and vessels per 20× field in the peri-wound area of wounds treated with saline or M-T7 collected on days 4 and 7 post-wounding. Bars are mean and standard error. Two non-overlapping fields were quantified per mouse and statistics were performed on the average per mouse with the N = 4 per group. Statistics were calculated by two-way ANOVA with Fisher’s LSD post-hoc analysis. (C) Representative peri-wound CD31 IHC fields (10×) collected on days 4 and 7 post-wounding. Scale bars are 50 µm. Zoom areas indicated by boxes. N = 3–4 in each group and time point.
Figure 4
Figure 4
M-T7 modulates the immune response in the healing wound. (A) ELISA quantification of CCL2 in wounds treated with saline or M-T7 at days 1, 4 and 7 post-wounding, normalized to total protein. (B) Quantification of Arginase-1+ cells per 20× field of wounds treated with saline or M-T7 at days 2, 4 and 7 post-wounding. (C) Representative Arginase-1 IHC fields at day 7. (D) Quantification of TGF-beta+ cells per 20× field on days 2, 4 and 7 post-wounding. (E,F) Quantification of CD3+ cells per 20× field of wounds treated with saline or M-T7 at days 2, 4 and 7 post-wounding, specifically in the (E) wound bed or (F) epithelial tongue. (G) Quantification of CD4+ cells per 20× field of wounds treated with saline or M-T7 at days 2, 4 and 7 post-wounding normalized to the numbers on day 2. (H) Representative CD4 IHC fields in the epithelial tongue at day 7. Full 20× field is given in Figure S2. All bars are mean and standard error. Statistics are calculated by two-way ANOVA with Fisher’s LSD post-hoc analysis. N = 3–4 in each group and time point.

References

    1. Niu Y., Li Q., Ding Y., Dong L., Wang C. Engineered delivery strategies for enhanced control of growth factor activities in wound healing. Adv. Drug Deliv. Rev. 2019;146:190–208. doi: 10.1016/j.addr.2018.06.002. - DOI - PubMed
    1. Gurtner G.C., Werner S., Barrandon Y., Longaker M.T. Wound repair and regeneration. Nature. 2008;453:314–321. doi: 10.1038/nature07039. - DOI - PubMed
    1. Ellis S., Lin E.J., Tartar D. Immunology of wound healing. Curr. Dermatol. Rep. 2018;7:350–358. doi: 10.1007/s13671-018-0234-9. - DOI - PMC - PubMed
    1. Larouche J., Sheoran S., Maruyama K., Martino M.M. Immune regulation of skin wound healing: Mechanisms and novel therapeutic targets. Adv. Wound Care. 2018;7:209–231. doi: 10.1089/wound.2017.0761. - DOI - PMC - PubMed
    1. Martins-Green M., Petreaca M., Wang L. Chemokines and their receptors are key players in the orchestra that regulates wound healing. Adv. Wound Care. 2013;2:327–347. doi: 10.1089/wound.2012.0380. - DOI - PMC - PubMed