. 2020 Oct 22;21(21):7848.
doi: 10.3390/ijms21217848.

Heterogeneous Presynaptic Distribution of Munc13 Isoforms at Retinal Synapses and Identification of an Unconventional Bipolar Cell Type with Dual Expression of Munc13 Isoforms: A Study Using Munc13-EXFP Knock-in Mice

Affiliations

Heterogeneous Presynaptic Distribution of Munc13 Isoforms at Retinal Synapses and Identification of an Unconventional Bipolar Cell Type with Dual Expression of Munc13 Isoforms: A Study Using Munc13-EXFP Knock-in Mice

Kaspar Gierke et al. Int J Mol Sci. .

Abstract

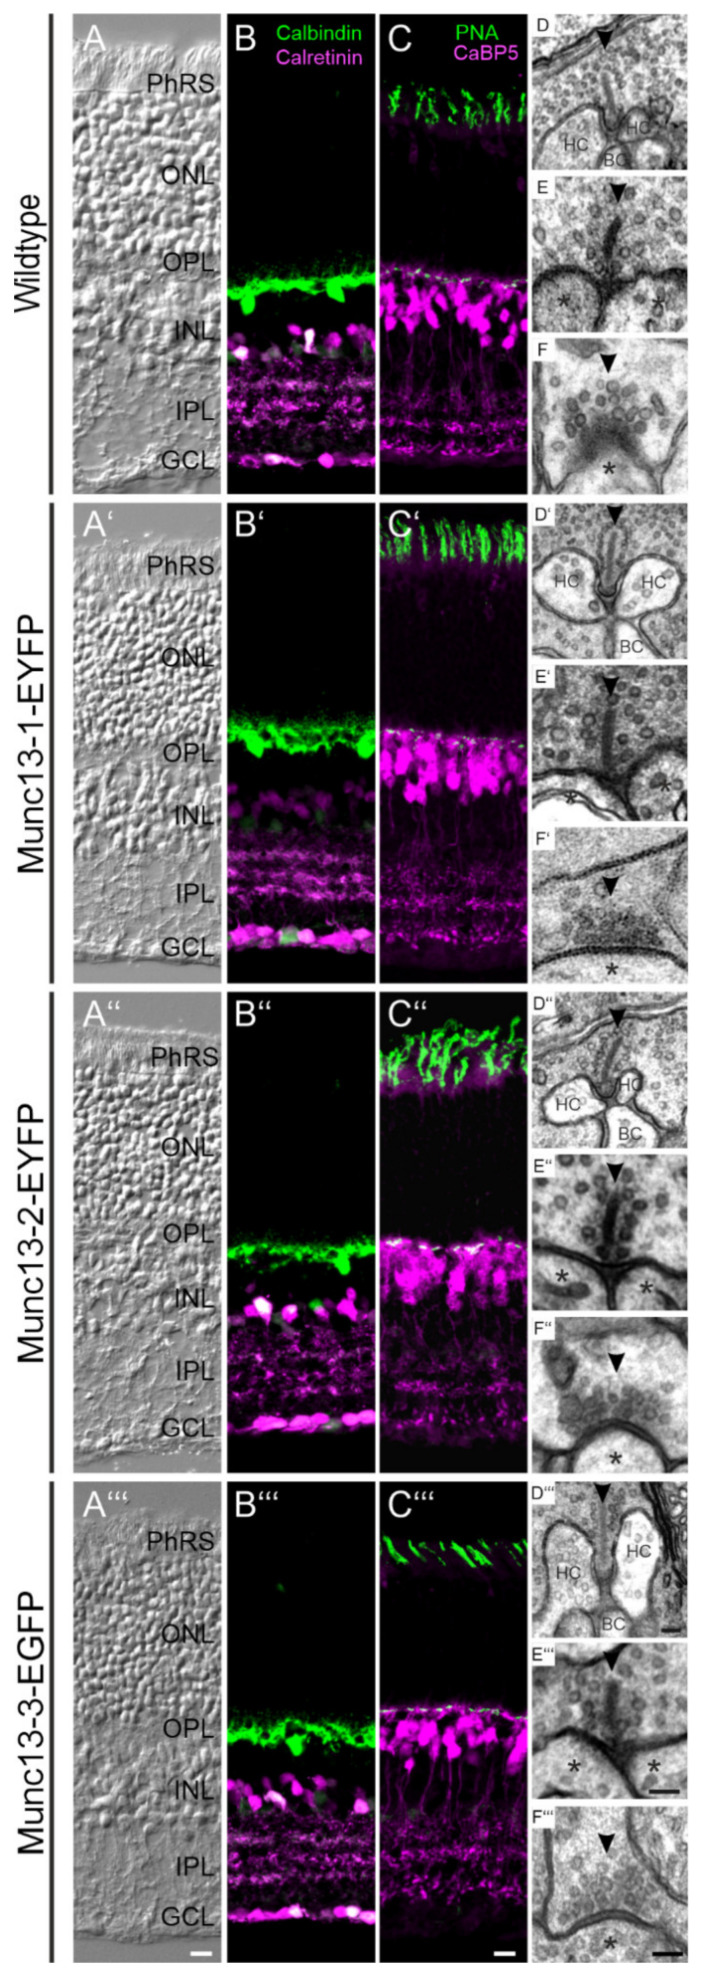
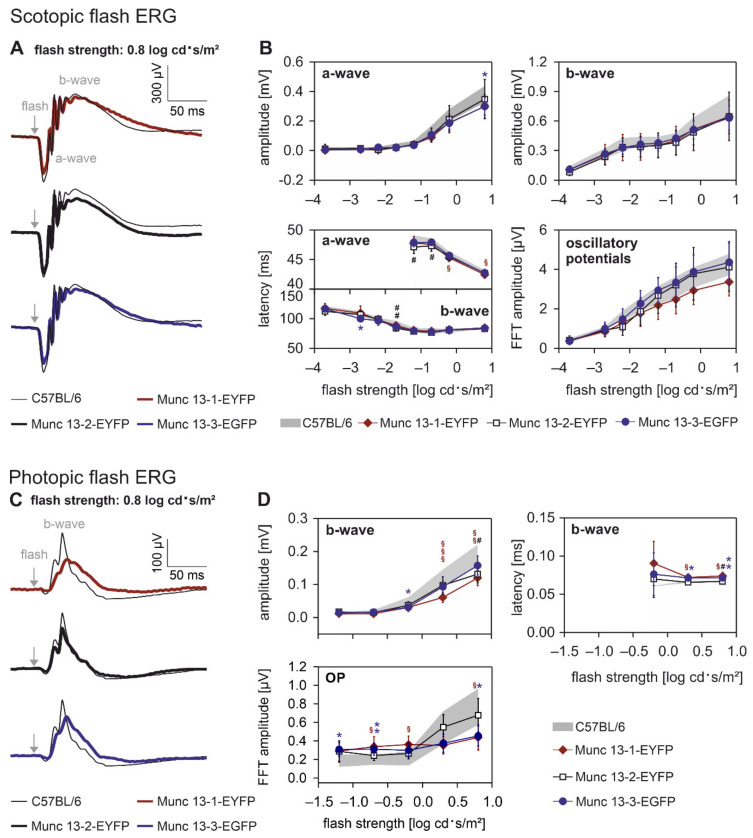
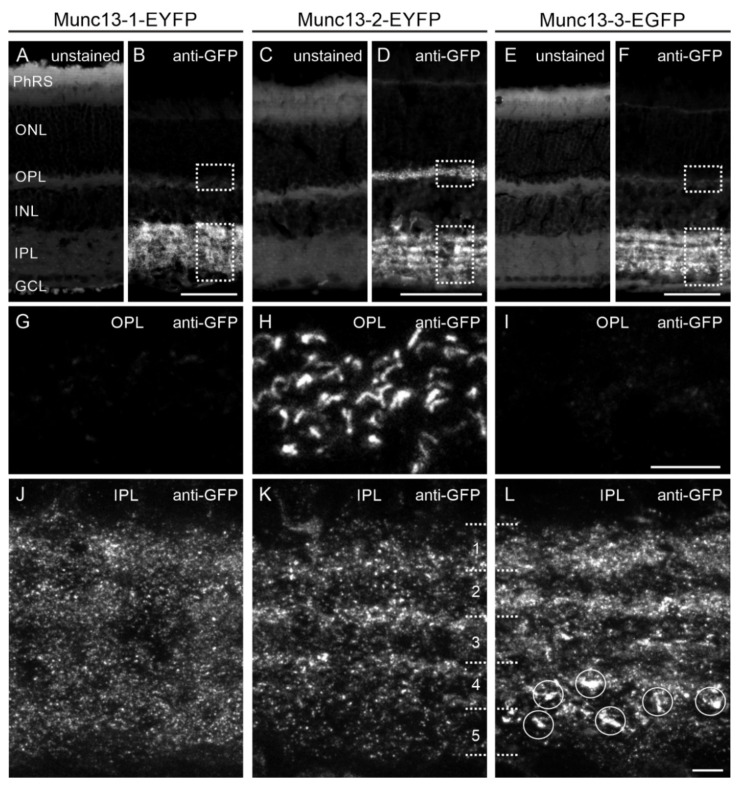
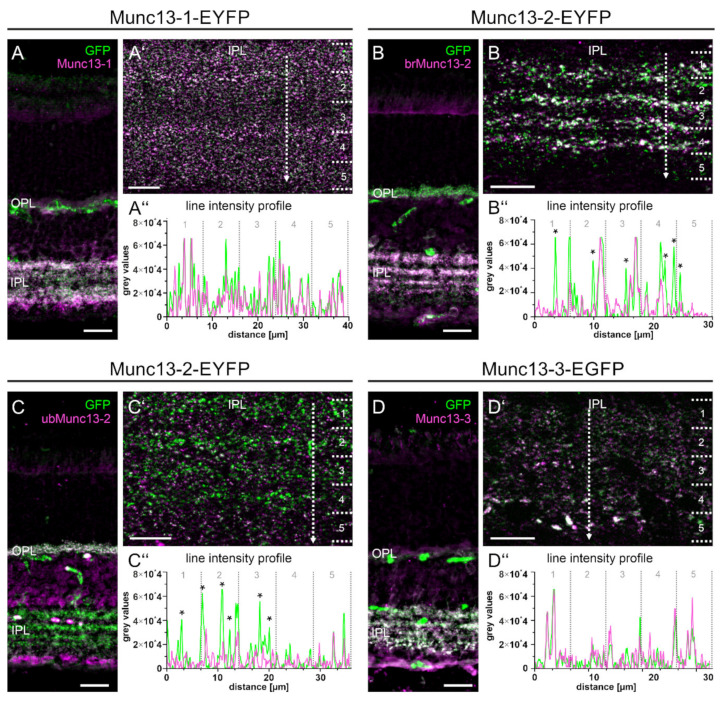
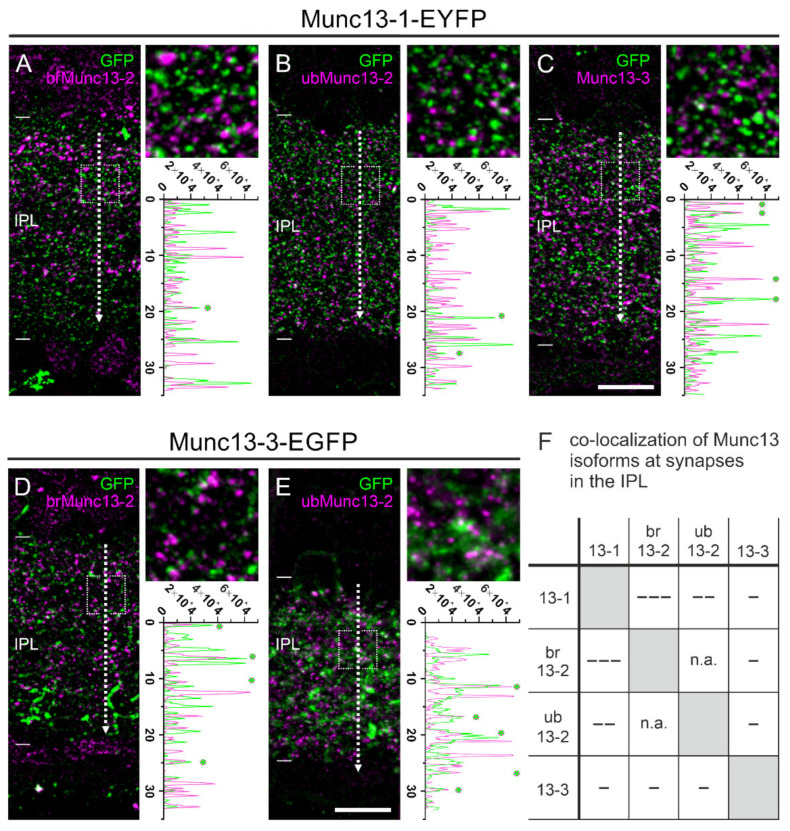
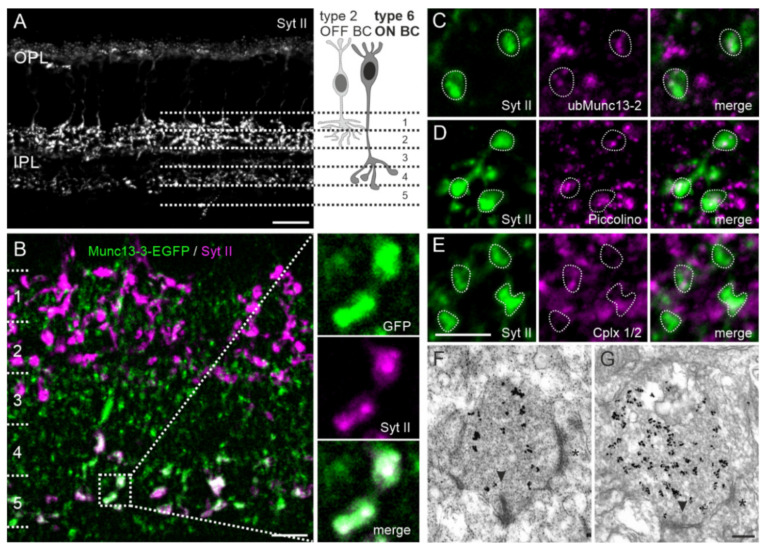
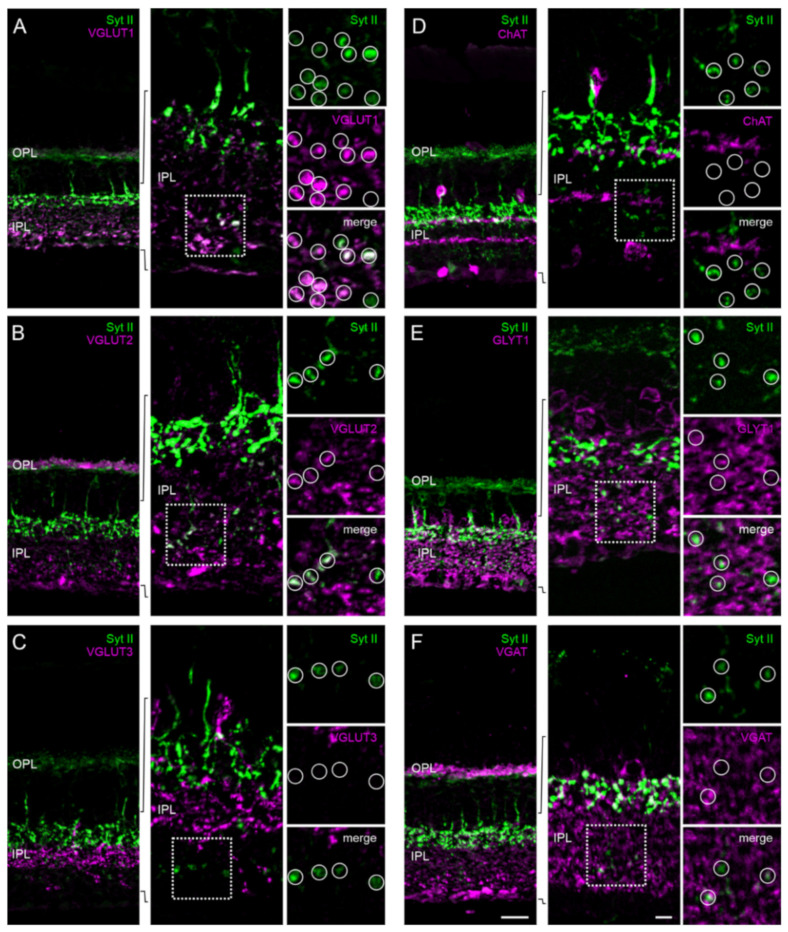
Munc13 isoforms are constituents of the presynaptic compartment of chemical synapses, where they govern important steps in preparing synaptic vesicles for exocytosis. The role of Munc13-1, -2 and -3 is well documented in brain neurons, but less is known about their function and distribution among the neurons of the retina and their conventional and ribbon-type chemical synapses. Here, we examined the retinae of Munc13-1-, -2-, and -3-EXFP knock-in (KI) mice with a combination of immunocytochemistry, physiology, and electron microscopy. We show that knock-in of Munc13-EXFP fusion proteins did not affect overall retinal anatomy or synapse structure, but slightly affected synaptic transmission. By labeling Munc13-EXFP KI retinae with specific antibodies against Munc13-1, -2 and -3, we found that unlike in the brain, most retinal synapses seem to operate with a single Munc13 isoform. A surprising exception to this rule was type 6 ON bipolar cells, which expressed two Munc13 isoforms in their synaptic terminals, ubMunc13-2 and Munc13-3. The results of this study provide an important basis for future studies on the contribution of Munc13 isoforms in visual signal processing in the mammalian retina.

Keywords: Munc13-1; Munc13-3; brMunc13-2; conventional synapse; retina; ribbon synapse; type 6 ON bipolar cell; ubMunc13-2.


Conflict of interest statement

The authors declare no conflict of interest.

Figures

Figure 1
Figure 1
Comparison of retinal anatomy and synaptic morphology between wildtype (WT) and Munc13-EXFP KI mice. (AA‴) Nomarski micrographs of vertical cryostat sections through the retinae of WT and Munc13-EXFP KI mouse lines. (BC‴) Fluorescence micrographs of vertical cryostat sections through the retinae of WT and the three Munc13-EXFP KI mouse lines double labeled for horizontal cells (anti-Calbindin; green) and amacrine cells (anti-Calretinin; magenta) (BB‴) and for cone photoreceptors (PNA; green) and bipolar, amacrine, and ganglion cells (anti CaBP5; magenta) (CC‴). (DF‴) Electron micrographs of retinal synapses from WT and the three Munc13-EXFP KI mouse lines: rod photoreceptor ribbon synapses (DD‴), rod bipolar cell ribbon synapses (EE‴), and conventional synapses (FF‴). Arrowheads (➤) point to synaptic ribbons (DE‴) or active zones (FF‴). Asterisks (*) mark postsynaptic processes. PhRS, photoreceptor segments; ONL, outer nuclear layer; OPL, outer plexiform layer; INL, inner nuclear layer; IPL, inner plexiform layer; GCL, ganglion cell layer; HC, horizontal cell; BC, bipolar cell. Scale bar = 20 µm in A‴ for AA‴ and in C‴ for BC‴ and 0.1 µm in D‴ for DD‴, in E‴ for EE‴, and in F‴ for FF‴.
Figure 2
Figure 2
Electroretinographic recordings (ERG) of wildtype (WT) and Munc13-EXFP KI mice. (A) Comparison of mean ERG responses to a scotopic flash of 0.8 log cd·s/m2 strength between WT (thin black line), Munc13-1-EYFP (red line), Munc13-2-EYFP (thick black line), and Munc13-3-EGFP (blue line) mice. Grey arrows indicate flash onset. Traces show a-wave trough and b-wave peak with oscillatory potentials on its rising part. (B) Amplitude and latency of the scotopic a- and b-wave and amplitude of the oscillatory potentials (defined as the maximal amplitude of the Fourier transformed ERG signal between approximately 50 and 100 Hz). WT range is indicated by the gray area. (C) Comparison of mean ERG responses to a photopic flash of 0.8 log cd·s/m2 strength upon a 1.4 log cd/m2 white background measured in WT (thin black line), Munc13-1 (red line), Munc13-2 (thick black line), and Munc13-3 (blue line) mice. Grey arrows indicate flash onset. Traces show only a prominent b-wave peak. (D) Averaged amplitude and latency of the photopic b-wave and averaged amplitude of oscillatory potentials as a function of flash strength. n = 6 animals per mouse line. All values are presented as mean ± SD. Symbols above lines indicate statistical significances between WT and Munc13-1-EYFP (*), Munc13-2-EYFP (#) or Munc13-3-EGFP (§) mice. Significance levels apply to all of the symbols (*,#,§). * p < 0.05; ** p < 0.005; *** p < 0.001. p-values were corrected after Bonferroni for multiple testing.
Figure 3
Figure 3
Visualization of Munc13-EXFP fusion proteins in Munc13 KI retinae. (AF) Fluorescence micrographs of vertical cryostat sections of unfixed and unstained (A,C,E) and PFA-fixed and anti-GFP antibody-enhanced (B,D,F) retinae of the three Munc13-EXFP mouse lines. (GL) High power views of the antibody-enhanced Munc13-EXFP signals in the outer plexiform layer (OPL; (GI)) and inner plexiform layer (IPL; (JL)). Dotted boxes in (B,D,F) demarcate the respective regions shown in (GL). Dashed lines in (K,L) subdivide the IPL into five strata. Circles in (L) highlight large Munc13-3-EGFP clusters. PhRS, photoreceptor segments; ONL, outer nuclear layer; OPL, outer plexiform layer; INL, inner nuclear layer; IPL, inner plexiform layer; GCL, ganglion cell layer. Scale bar = 20 µm in (B) for (A,B), in (D) for (C,D), and in (F) for (E,F). and 5 µm in (I) for (GI) and in (L) for (JL).
Figure 4
Figure 4
Munc13-EXFP fusion proteins match Munc13 antibody labelings. (AD) Fluorescence micrographs of vertical cryostat sections through retinae of Munc13-EXFP mouse lines, double labeled with antibodies against GFP and the respective Munc13 isoform. (A’D’) High power views of the inner plexiform layer (IPL). Dotted lines indicate the location of extracted line intensity profiles. Numbers 1–5 indicate the five strata of the IPL. (A’’D’’) Analysis of the fluorescence line intensity profiles. Asterisks (*) in (B’,C’) highlight non-overlapping EXFP-/Munc13 antibody-positive signals. OPL, outer plexiform layer. Scale bar = 20 µm in (AD) and 10 µm in (A’D’).
Figure 5
Figure 5
Distribution of Munc13-1, ubMunc13-2, brMunc13-2, and Munc13-3 at synapses in the inner plexiform layer (IPL) of mouse retina. (AC) Fluorescence micrographs of the IPL of Munc13-1-EYFP KI retinae double labeled with antibodies against GFP/ubMunc13-2 (A), GFP/brMunc13-2 (B), and GFP/Munc13-3 (C). (DE) Fluorescence micrographs of the IPL of Munc13-3-EGFP KI retinae double labeled for GFP/ubMunc13-2 and GFP/brMunc13-2 (E). Dotted lines in (AE) indicate the location of extracted line intensity profiles. Dotted boxes in (AE) demarcate the regions shown in the respective higher power views. (F) Table summarizing the degree of co-localization between the different retinal Munc13 isoforms. [- - -] lack of co-localization, [- -] rare co-localization, [-] occasional co-localization. n.a. = not analyzed. Asterisks (*) in line intensity profiles indicate overlap between fluorescence signals. Scale bar = 10 µm in C for (AE).
Figure 6
Figure 6
Type 6 ON bipolar cells express Munc13-3. (A) Fluorescence micrograph of a vertical cryostat section through wildtype retina labeled with an antibody against Synaptotagmin II (Syt II). Type 2 OFF bipolar cells (BC) are strongly stained in strata 1/2, and type 6 ON BCs are weakly labeled in strata 4/5 of the inner plexiform layer (IPL). (B) IPL of a Munc13-3-EGFP KI retina double labeled for GFP (green) and Syt II (magenta) showing co-localization of the large Munc13-3-EGFP positive clusters with Syt II in strata 4/5. Dotted box demarcates the region of the IPL shown in the high power views. (CE) High power view of the type 6 ON bipolar cell terminals in strata 4/5 double labeled with antibodies against ubMunc13-2 (C), Piccolino (D), and Cplx 1/2 (E). (F,G) Representative electron micrographs of preembedding immunolabeled Syt II positive terminals of type 6 ON BCs close to the ganglion cell layer. Terminals of Syt II positive type 6 ON BCs harbor ribbon-containing ((F); arrowhead (➤)) and ribbon-free ((G); arrowhead (➤)) synaptic contacts. Asterisks (*) in (F,G) label reciprocal amacrine cell synapses. OPL, outer plexiform layer; Cplx1/2, complexin 1/2. Scale bar = 20 µm in (A), 10 µm in (B), 5 µm in (E) for (CE), and 0.2 µm in (G) for (F,G).
Figure 7
Figure 7
Neurotransmitter phenotype of type 6 ON bipolar cells (BCs). (AF) Vertical cryostat sections through wildtype mouse retinae double labeled with an antibody against Syt II to label type 6 ON BCs in combination with markers for glutamatergic synapses VGLUT1 (A), VGLUT2 (B), and VGLUT3 (C), cholinergic synapses ChAT (D), glycinergic synapses GLYT1 (E), and GABAergic synapses VGAT (F). Dotted boxes demarcate the regions in the IPL shown in the high power views. Circles highlight synaptic terminals of type 6 BCs together with the respective synapse markers. OPL, outer plexiform layer; IPL, inner plexiform layer; VGLUT, vesicular glutamate transporter; ChAT, choline acetyltransferase; GLYT1, glycine transporter1; VGAT, vesicular GABA transporter. Scale bars = 20 µm in (F) for (AF) and 5 µm for the higher power views of the IPL.

Similar articles

Cited by

References

    1. Day R.N., Davidson M.W. The fluorescent protein palette: Tools for cellular imaging. Chem. Soc. Rev. 2009;38:2887–2921. doi: 10.1039/b901966a. - DOI - PMC - PubMed
    1. Kalla S., Stern M., Basu J., Varoqueaux F., Reim K., Rosenmund C., Ziv N.E., Brose N. Molecular dynamics of a presynaptic active zone protein studied in Munc13-1-enhanced yellow fluorescent protein knock-in mutant mice. J. Neurosci. 2006;26:13054–13066. doi: 10.1523/JNEUROSCI.4330-06.2006. - DOI - PMC - PubMed
    1. Brose N., Hofmann K., Hata Y., Sudhof T.C. Mammalian homologues of Caenorhabditis elegans unc-13 gene define novel family of C2-domain proteins. J. Biol. Chem. 1995;270:25273–25280. doi: 10.1074/jbc.270.42.25273. - DOI - PubMed
    1. Koch H., Hofmann K., Brose N. Definition of Munc13-homology-domains and characterization of a novel ubiquitously expressed Munc13 isoform. Biochem. J. 2000;349:247–253. doi: 10.1042/bj3490247. - DOI - PMC - PubMed
    1. Sudhof T.C. The presynaptic active zone. Neuron. 2012;75:11–25. doi: 10.1016/j.neuron.2012.06.012. - DOI - PMC - PubMed

MeSH terms

Substances

LinkOut - more resources