. 2020 Nov 16;9(11):bio053884.
doi: 10.1242/bio.053884.

Antibiotics in hives and their effects on honey bee physiology and behavioral development

Affiliations

Antibiotics in hives and their effects on honey bee physiology and behavioral development

Yarira Ortiz-Alvarado et al. Biol Open. .

Abstract

Recurrent honeybee losses make it critical to understand the impact of human interventions, such as antibiotic use in apiculture. Antibiotics are used to prevent or treat bacterial infections in colonies. However, little is known about their effects on honeybee development. We studied the effect of two commercial beekeeping antibiotics on the bee physiology and behavior throughout development. Our results show that antibiotic treatments have an effect on amount of lipids and rate of behavioral development. Lipid amount in treated bees was higher than those not treated. Also, the timing of antibiotic treatment had distinct effects for the age of onset of behaviors, starting with cleaning, then nursing and lastly foraging. Bees treated during larva-pupa stages demonstrated an accelerated behavioral development and loss of lipids, while bees treated from larva to adulthood had a delay in behavioral development and loss of lipids. The effects were shared across the two antibiotics tested, TerramycinR (oxytetracycline) and TylanR (tylosin tartrate). These effects of antibiotic treatments suggest a role of microbiota in the interaction between the fat body and brain that is important for honeybee behavioral development.This paper has an associated First Person interview with the first author of the article.

Keywords: Antibiotics; Behavioral development; Honeybee; Oxytetracycline; Physiology; Tylosin.


Conflict of interest statement

Competing interestsThe authors declare no competing or financial interests.

Figures

Fig. 1.
Fig. 1.
Cross-fostering design. Graphic description of cross-fostered bees and resulting treatment groups. Two trials with two different antibiotics consisting of six paired colonies each. Colonies were treated with antibiotics 3 weeks prior to cross fostering. After bee emergence, approximately 500 bees were number tagged in the thorax; half of the emerged bees remained in parental colonies, while the other half of emerged bees were placed in a paired colony. Treatment continued after cross fostering. The cross-fostering method results in four different treatment groups: no exposure −/−, developmental exposure +/−, adult exposure −/+ and developmental adult exposure +/+. Ntotal=5786; NOxytetracycline=2900; NTylosin tartrate=2886.
Fig. 2.
Fig. 2.
Effect of treatment on lipid content on different ages. Type of treatment shows an interaction with lipid content (F-value28.07, d.f.=5, P<0.001), as well as age (F-value49.94, d.f.=1, P<0.001). At day 1, bees in antibiotic treatment showed a higher lipid content than those with no antibiotic (F-value31.63, d.f.=3, P<0.0001). Days 7 and 14 of age, show similar pattern as day 1, bees in antibiotic have a higher lipid content [(day 7) F-value14.41, d.f.=3, P<0.001; (day 14) F-value24.67, d.f.=3, P<0.0001). There is no statistical difference between Oxytetracycline or Tylosin tartrate treatments (F-value0.03, d.f.=2, P>0.05). For day 1 of age in both antibiotics, data for +/− (dashed green bar) and −/+ (dashed grey bar) are the same as +/+ and −/−, respectively. Capital Arabic letters show differences between treatments groups at day 1 of age, non-capitalized Arabic letters show differences between treatments groups at day 7 of age and Greek letters show differences between treatments groups at day 14 of age from the three-way ANOVA results. Samples: day 1 n=20, day 7 n=40, day 14 n=40, total N=100. Samples sizes are the same for both antibiotics. Data reported by mean±s.e.m. of lipid content.
Fig. 3.
Fig. 3.
Relative probability of tasks by treatments. Results demonstrate the effects of antibiotics treatment on task performance; bees off +/− treatment tend to change tasks faster compared to the control (−/−) whereas the +/+ group delays changes of tasks. There was no statistical difference between oxytetracycline or tylosin tartrate (cleaning z-value-0.05, d.f.=282, P=0.480; nursing z-value-0.35, d.f.=282, P=1.00; foraging z-value-0.87, d.f.=282, P=0.92). Cleaning behavior of workers: −/− decrease performance of cleaning behavior earlier than the −/+ and +/+ groups. In overall counts the +/− group had fewer cleaner counts (z-value-27.75, d.f.=282, P≤0.0001), +/+ had higher counts of cleaners (z-value21.88, d.f.=282, P≤0.0001) and −/+ showed no difference from −/− (z-value1.49, d.f.=282, P=0.15). Nursing behavior of workers: similar to the cleaning behavior analysis, −/− groups changes tasks more rapidly that the other two groups. In overall counts, +/− had fewer nurses counts (z-value4.98, d.f.=282, P≤0.05), +/+ and −/+ had higher counts of nurses (z-value-15.08, d.f.=282, P≤0.0001, z-value5.60, d.f.=282, P≤0.05; respectively). Foraging behavior of workers: as nursing behavior decreases, foraging behavior increases faster in the +/− group when compared to the other three groups, +/− had higher forager counts (z-value31.67, d.f.=282, P≤0.0001), +/+ and −/+ had lower forager counts (z-value-15.05, d.f.=282, P≤0.0001, z-value-83.46, d.f.=282, P≤0.0001; respectively). Non-capitalized Arabic letters show differences between treatment groups. Data reported by mean of proportions of tasks by treatment and age groups. The numbers inside the bars are the mean of individuals observed performing a task by treatment and age groups.
Fig. 4.
Fig. 4.
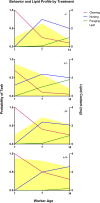
Summarized model of behavioral development and lipid profile related to antibiotic treatment. Timing of antibiotic treatments induces differences in the behavioral development rate. Bees treated with antibiotics during immature development (+/−) switch tasks sooner than the other groups. Bees treated after immature development (−/+), show delayed behavior development, where the rate is intermediate between the (−/−) group and (+/+) group. Treating bees through their whole development (+/+) induced a delayed phenotype where most of the bees were observed performing in-hive jobs only. Behaviors match lipid profile, where high lipids are related to nursing behavior and loss of lipid with age relates to foraging behavior. The left y-axis shows the mean probability of each task, cleaning (red), nursing (blue) and foraging (green) being performed at a certain age. The yellow area shows the mean lipid content (right y-axis).

References

    1. Alippi A. M., Albo G. N., Reynaldi F. J. and De Giusti M. R. (2005). In vitro and in vivo susceptibility of the honeybee bacterial pathogen Paenibacillus larvae subsp. larvae to the antibiotic tylosin. Vet. Microbiol. 109, 47-55. 10.1016/j.vetmic.2005.03.008 - DOI - PubMed
    1. Allen H. K., Levine U. Y., Looft T., Bandrick M. and Casey T. A. (2013). Treatment, promotion, commotion: antibiotic alternatives in food-producing animals. Trends in Microbial. 21, 114-119. 10.1016/j.tim.2012.11.001 - DOI - PubMed
    1. Ament S. A., Corona M., Pollock H. S. and Robinson G. E. (2008). Insulin signaling is involved in the regulation of worker division of labor in honey bee colonies. Proc. Nat. Acad. Sci. USA 105, 4226-4231. 10.1073/pnas.0800630105 - DOI - PMC - PubMed
    1. Ament S. A., Chan Q. W., Wheeler M. M., Nixon S. E., Johnson S. P., Rodriguez-Zas S. L., Foster L. J. and Robinson G. E. (2011). Mechanisms of stable lipid loss in a social insect. J. Exp. Biol. 214, 3808-3821. 10.1242/jeb.060244 - DOI - PMC - PubMed
    1. Blaauw B. R. and Isaacs R. (2014). Larger patches of diverse floral resources increase insect pollinator density, diversity, and their pollination of native wildflowers. Basic App. Ecol. 15, 701-711. 10.1016/j.baae.2014.10.001 - DOI

Publication types