. 2020 Oct 26;3(12):e202000911.
doi: 10.26508/lsa.202000911. Print 2020 Dec.

Chromosome instability induced by a single defined sister chromatid fusion

Affiliations

Chromosome instability induced by a single defined sister chromatid fusion

Katsushi Kagaya et al. Life Sci Alliance. .

Abstract

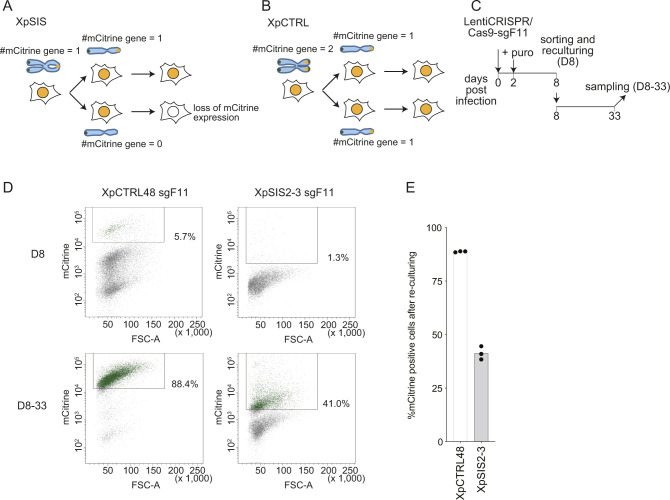
Chromosome fusion is a frequent intermediate in oncogenic chromosome rearrangements and has been proposed to cause multiple tumor-driving abnormalities. In conventional experimental systems, however, these abnormalities were often induced by randomly induced chromosome fusions involving multiple different chromosomes. It was therefore not well understood whether a single defined type of chromosome fusion, which is reminiscent of a sporadic fusion in tumor cells, has the potential to cause chromosome instabilities. Here, we developed a human cell-based sister chromatid fusion visualization system (FuVis), in which a single defined sister chromatid fusion is induced by CRISPR/Cas9 concomitantly with mCitrine expression. The fused chromosome subsequently developed extra-acentric chromosomes, including chromosome scattering, indicative of chromothripsis. Live-cell imaging and statistical modeling indicated that sister chromatid fusion generated micronuclei (MN) in the first few cell cycles and that cells with MN tend to display cell cycle abnormalities. The powerful FuVis system thus demonstrates that even a single sporadic sister chromatid fusion can induce chromosome instability and destabilize the cell cycle through MN formation.


Conflict of interest statement

The authors declare that they have no conflict of interest.

Figures

Figure 1.
Figure 1.. Validation of CRISPR/Cas9-mediated sister chromatid fusion (SCF) visualization system.
(A) Schematic overview of the development of the FuVis-XpSIS system. Targeting the spacer region between the N-terminus of mCitrine and the neoR gene by CRISPR/Cas9 results in either repair with indels (left) or sporadic SCF and full-length mCitrine expression (right). (B) FISH image of mitotic chromosomes of XpSIS2-3 cells showing the sister cassette (red), the X centromere (green), and DAPI (blue). Colors were adjusted on individual and merged images. Arrowheads indicate sister cassette signals. Scale bar: 10 μm. (C) Phase-contrast and fluorescence images of XpSIS2-3 cells 10 d postinfection with lentivirus carrying CRISPR/Cas9 and indicated sgRNA. Scale bar: 50 μm. (B, D) FISH image of mitotic chromosomes of XpSIS2-3 sgF11 cells, shown as in (B). mCitrine-positive cells were sorted 10 d postinfection with lentivirus carrying CRISPR/Cas9 and sgF11. Arrowhead indicates the sister cassette signal (red) and SCF (DAPI). Scale bar: 10 μm. (E) FISH images of XpSIS2-3 sgF11 cells at 10 d postinfection. Chromosome bridges of the X chromosome were visualized by the whole X chromosome (red) and the X centromere (green) probes and DAPI-stained chromosomes (blue). Colors were adjusted on individual and merged images. Scale bar: 10 μm. (F) Bar graph represents percentage of indicated junction features for SCF and repair with indels in mCitrine-positive and whole population of XpSIS2-3 sgF11 cells, respectively, at 10 d postinfection. Source data are available for this figure.
Figure S1.
Figure S1.. Validation of XpSIS clones.
(A) Schematic of the PCR-based assay to screen for the sister cassette integration at the Xp subtelomere. MTH632, MTH653, and MTH698 are primers used for genomic PCR. The shorter fragment (1,188 bp) was used as a positive control. (B) Results of PCR-based validation of FuVis-XpSIS clones from two independent integrations (1 and 2), where 24 and 48 G418-positive clones were analyzed, respectively, and only validated clones are shown. P, parental genome. (C, D, E) Genomic DNA from indicated XpSIS clones were analyzed by qPCR. (C) Position of primers used for qPCR (C). (D) The pBS-sister-AAVS1 plasmid was used as a standard template to estimate the copy number of the sister cassette (D). (E) Genomic DNA from HCT116 was used as a standard template to estimate the copy number of Xist and Hdac6 gene locus on the X chromosome (E). Bars represent mean from two experimental replicates. (F) Mitotic chromosome spreads of XpSIS2-3 cells were analyzed by FISH with the whole X chromosome (red) and the X centromere (green) probes. n = 90 from three independent experiments (n = 30 per experiment). (G) Schematics of Southern hybridization to confirm the sister cassette integration at the targeted Xp subtelomeric locus. (H) Southern hybridization result using the mCit-C probe in XpSIS2-3 cells. EtBr indicates total genomic DNA digested with EcoRI. (I) Percentage of translocation involving the X chromosome in XpSIS2-3 cells were analyzed by FISH. FISH image of mitotic chromosome of XpSIS2-3 cells showing the whole X chromosome (red), the X centromere (green), and DAPI (blue). Colors were adjusted on individual and merged images. Scale bar: 10 μm. (I, J) Quantification of (I). Bar represents mean from three independent experiments (n = 30 per experiment). (K) FISH image of mitotic chromosomes of XpSIS2-3 cells showing the sister cassette (red), the X centromere (green), and DAPI (blue). Colors were adjusted on individual and merged images. Scale bar: 10 μm.
Figure S2.
Figure S2.. Sister chromatid fusion (SCF) induction in XpSIS2-3 clone.
(A) Percentage of mCitrine-positive XpSIS2-3 cells at 8 d postinfection with 19 different CRISPR/Cas9-sgFUSIONs that target distinct loci across the spacer and the neoR gene. The map under the graph represents the corresponding location on the sister cassette. Magenta numbers denote the top four sgFUSIONs that induced mCitrine expression. (B) FISH image of mitotic chromosomes of XpSIS2-3 sgF11 cells, shown as in Fig 1D. mCitrine-positive cells were sorted 10 d postinfection with lentivirus carrying CRISPR/Cas9 and sgF11. Arrowheads indicate the sister cassette signal (red) and SCF (DAPI). Scale bar: 10 μm. (C, D, E) Analysis of junctions of SCF and repair with indels in mCitrine-positive and whole population of XpSIS2-3 sgF11 cells, respectively, at 10 d postinfection. (C) Schematics representing the PCR product used for junction analysis of SCF and repair with indels (C). Result of PCR with the fusion primer set using the indicated genomic DNA. (D) Fragments less than 1 kb were cloned and sequenced (D). (E) Each dot represents the distribution of deletion length on both sides of the individual fusion and repair junctions (E).
Figure 2.
Figure 2.. Validation of FuVis-Xp control system.
(A) Schematic overview of the FuVis-XpCTRL system. CRISPR/Cas9-mediated removal of the neoR results in mCitrine expression. (B) FISH images of mitotic chromosomes of XpCTRL48 cells, shown as in Fig 1B. Scale bar: 10 μm. (C) Flow cytometry analysis of XpCTRL48 cells expressing CRISPR/Cas9 and sgF11 at 10 d post lentivirus infection. +: background level of mCitrine expression. +++: mCitrine expression induced by CRISPR/Cas9 and sgF11. (D) Phase-contrast and mCitrine fluorescence images of XpCTRL48 cells at 10 d postinfection with lentivirus carrying CRISPR/Cas9 and indicated sgRNA. Scale bar: 50 μm. (E) Time course of mCitrine expression in indicated cells expressing Cas9 and sgF11. The results were reproducible in two independent experiments.
Figure S3.
Figure S3.. Validation of XpCTRL clones.
(A) Schematic of the PCR-based assay to screen for the control cassette integration at the Xp subtelomere. MTH442, MTH653, and MTH698 are primers used for genomic PCR. The shorter fragment (1,188 bp) was used as a positive control. (B) Result of PCR-based validation of XpCTRL clones. 48 G418-positive clones were analyzed and only validated clones are shown. Sequencing of the PCR products revealed that Clone33 has lost one of two copies of cHS4 sequence at the telomere-distal side, and that Clone48 has a duplication of a homology arm at the telomere-distal side. P, parental genome. (C) Genomic DNA from indicated XpCTRL clones was analyzed by qPCR, as described in Fig S1C–E. Bars represent mean from two experimental replicates. (D) Schematics of Southern hybridization of XpCTRL48 clone to confirm the control cassette integration at the single Xp subtelomeric locus. (E) Southern hybridization result using the mCit-C probe in XpCTRL48 cells. EtBr indicates total genomic DNA digested with EcoRI. (F) FISH images of XpCTRL48 cells showing the control cassette (red), the X chromosome centromere (green) and DAPI-stained chromosomes (blue). Colors were adjusted on individual and merged images. Scale bar: 10 μm. (G) Schematic representing the PCR product used for repair junction analysis in XpCTRL48 sgF11 cells. (G, H) Result of PCR using indicated genomic DNA, as shown in (G). Fragments around 1.0 kb were cloned and sequenced. (I) Schematics for two types of repair junction. Type I possesses complete removal of the neoR sequence between Cas9 target sites; type II shows its partial removal and suggests sequential repair of each junction. (H, J) Distribution of deletion length across repair junctions in type I and II obtained from (H). Each dot represents the distribution of deletion length on both sides of the individual repair junctions. (K) Percentage of junction features in type I and II. n = 39 (Type I), and n = 59 (Type II). Source data are available for this figure.
Figure S4.
Figure S4.. Half of mCiitrine-positive XpSIS2-3, but not XpCTRL48 cells, lose mCitrine expression.
(A, B) Schematics showing the fate of the mCitrine gene and its expression after SCF in FuVis-XpSIS (A) and neoR deletion in FuVis-XpCTRL (B). (C) Schematics of flow cytometry analysis. (D) Representative flow cytometry results. Boxes indicate the mCitrine-positive population in each condition. (D, E) Bars represent mean percentage of mCitrine-positive cells after re-culturing from three biologically independent experiments as analyzed in (D).
Figure 3.
Figure 3.. A single SCF generates extra-acentric X chromosome fragments.
(A) Schematic of FISH analysis. XpCTRL48 and XpSIS2-3 cells infected with lentivirus carrying CRISPR/Cas9 and sgF11 were selected with puromycin. XpSIS2-3 cells were independently infected with a retrovirus carrying the full-length mCitrine gene. mCitrine-positive cells were sorted at 10 d postinfection and harvested (D10), or re-cultured for 7 d and harvested (D10-17). (B, C, D) FISH images of fragment (B), scattering (C), and ring (D) phenotypes of abnormal extra-acentric X chromosomes in XpSIS2-3 sgF11 cells at 10 d postinfection. The images show the whole X chromosome (red), the X centromere (green), and DAPI (blue). Colors were adjusted on individual and merged images. Scale bar: 10 μm. (E) Percentage of cells carrying extra-acentric X chromosomes in indicated conditions. Bars represent mean from three independent experiments (n = 30 in each experiment). P-values were calculated by RM one-way ANOVA. Source data are available for this figure.
Figure S5.
Figure S5.. The X chromosome structure analysis upon a single SCF.
(A) Percentage of near-tetraploid mitoses in the indicated cells (Fig 3A). Cells were analyzed as in Fig 3. Bars represent mean of three independent experiments (n = 30 in each experiment). P-values were calculated by RM one-way ANOVA. (B) Ratio of X chromosome per total chromosomes (mean and range) in the indicated cells (Fig 3A). Line represents mean ± SD from three independent experiments (n = 30 mitotic spreads per each experiment). All data (n = 90) is shown as gray plots. P-values were calculated by RM one-way ANOVA. (C) FISH images of intra-X (ring), X with non-X, and inter-X fusions in XpSIS2-3 sgF11 cells at 10 d postinfection, shown as in Fig 3B–D. Arrowheads denote presumed centromeres. Scale bar: 10 μm. (D) FISH images of scattering and extra-X translocation phenotypes of abnormal extra-acentric X chromosomes in XpSIS2-3 sgF11 cells at 10 d postinfection, shown as in Fig 3B–D. Scale bar: 10 μm. (E) Percentage of cells carrying indicated types of chromosome fusion involving the X chromosome. Bars represent mean of three independent experiments (n = 30 mitotic spreads in each experiment). P-values were calculated by RM one-way ANOVA.
Figure S6.
Figure S6.. A single SCF causes extra-acentric X chromosomes.
(A, B) Percentage of cells carrying translocations on the X chromosome (A) and chromosome fusions involving the X chromosome (B), shown as in Fig 3E. Bar represents mean from three independent experiments (n = 30 in each experiment). P-values were calculated by RM one-way ANOVA. (C, D, E, F) Percentage of cells carrying extra-X translocation (C), fragment (D), scattering (E), and ring (F) phenotypes of extra-acentric X chromosomes shown as in Fig 3E. Bars represent mean of three independent experiments (n = 30 mitotic spreads in each experiment). P-values were calculated by the RM one-way ANOVA.
Figure 4.
Figure 4.. Live-cell analysis of the fate of a single SCF.
(A) A Summary of the live-cell imaging analysis. Indicated FuVis cell lines were infected with either retrovirus carrying pMX-mCitrine or lentivirus carrying CRISPR/Cas9-sgF11. (B) The cell cycle indicates the number of cell cycles after mCitrine expression, as shown in (B). (B) Schematic of the live-cell imaging analysis. N is an integer greater than 0, and x is an integer greater than or equal to 0. (C) Symbols representing cell cycle progression and cellular abnormalities in lineage trees. (D, E, F) Live-cell images of the fate of mCitrine-positive XpSIS2-3 sgF11 cells (left) and corresponding lineage trees (right): cell division during the (1+x)th cell cycle with MN formation (white arrowhead) (D), fading of mCitrine in one of two sister cell lineages (yellow arrowheads) during the (1+x)th cell cycle (E), and sister cell fusion followed by tripolar mitosis during the (N+x)th cell cycle (F). Yellow arrowheads with alphabetical labels (a, b, aa, ab, aa^ab) denote lineage orders, where aa^ab indicates a fused cell. White arrowheads denote MN. Scale bar: 50 μm. Source data are available for this figure.
Figure S7.
Figure S7.. Lineage trees of XpCTRL48 mCit N+x cell cycle.
Live-cell data of indicated mCitrine-positive cells is shown as lineage trees. Symbols represent cell cycle progression and cellular abnormalities in lineage trees.
Figure S8.
Figure S8.. Lineage trees of XpCTRL48 sgF11 1+x cell cycle.
Live-cell data of indicated mCitrine-positive cells is shown as lineage trees. Symbols represent cell cycle progression and cellular abnormalities in lineage trees.
Figure S9.
Figure S9.. Lineage trees of XpCTRL48 sgF11 N + x cell cycle.
Live-cell data of indicated mCitrine-positive cells is shown as lineage trees. Symbols represent cell cycle progression and cellular abnormalities in lineage trees.
Figure S10.
Figure S10.. Lineage trees of XpSIS2-3 mCit N+x cell cycle.
Live-cell data of indicated mCitrine-positive cells is shown as lineage trees. Symbols represent cell cycle progression and cellular abnormalities in lineage trees.
Figure S11.
Figure S11.. Lineage trees of XpSIS2-3 sgF11 1+x cell cycle.
Live-cell data of indicated mCitrine-positive cells is shown as lineage trees. Symbols represent cell cycle progression and cellular abnormalities in lineage trees.
Figure S12.
Figure S12.. Lineage trees of XpSIS2-3 sgF11 N + x cell cycle.
Live-cell data of indicated mCitrine-positive cells is shown as lineage trees. Symbols represent cell cycle progression and cellular abnormalities in lineage trees.
Figure 5.
Figure 5.. A single SCF leads to micronuclei formation.
(A) A heat map representing percentages of lineages that possess the indicated abnormalities. No mitosis indicates a lineage that did not enter mitosis during the movie. Mitotic delay represents a lineage that engaged in at least one mitosis longer than 2 h. (B) Lineages that show MN formation during the (1+x)th cell cycle in XpSIS2-3 sgF11. Red cross, purple square, and curved arrows represent MN, death, and regression, respectively. The numbers denote lineage ID. (C) FISH images of MN in mCitrine-positive XpSIS2-3 sgF11 cells sorted at 8 d postinfection and re-cultured for 2 d. The images show the whole X chromosome (red), the X centromere (green), and DAPI (blue). Colors were adjusted on individual and merged images. Scale bar: 10 μm. (D) Percentage of cells carrying indicated MN. Bars represent mean from three independent experiments (n = 133, 161, 207 and 291, 292, 284 for mock and sorted, respectively). P-values were calculated by a two-tailed t test. (E) Six model structures constructed to explain a random variable micronuclei (MN) from the Bernoulli distribution (top). Small and large capitals on the right side indicate parameters and variables (dummy variables) obtained from data (0 or 1 in source data for Figs 4–6), respectively. Widely Applicable Information Criterion per sample values on the right. See the Materials and Methods section and Supplemental Data 4 for details. (F) The posterior distribution of the parameter scf inferred from the most predictable model (model 1_4) with median (black circle) and 50% (red bar) and 95% (black bar) credible intervals. (G) Distribution of posterior predicted probabilities of MN formation on the model 1_4. Source data are available for this figure.
Figure S13.
Figure S13.. Micronuclei destabilize the cell cycle.
(A) The numbers of lineages that possess the indicated abnormalities in the indicated conditions. The same lineage was counted more than twice if multiple abnormalities were observed in the lineage. (B) FISH image of a chromosome bridge in mCitrine-positive XpSIS2-3 sgF11 cells sorted at 8 d postinfection and re-cultured for 2 d. The images show the whole X chromosome (red), the X centromere (green), and DAPI (blue). Colors were adjusted on individual and merged images. Scale bar: 10 μm. The graph shows the percentage of cells carrying a chromosome bridge franked by the X chromosome signals. Bars represent mean from three independent experiments (n = 133, 161, and 207 and 291, 292, and 284 for mock and sorted, respectively). P-values were calculated by the two-tailed t test. (C) Posterior distribution of the parameters inferred from the second predictable model 1_2 (Fig 5E) with median (black circle), and 50% (red bar) and 95% (black bar) credible intervals. (D) Average posterior predicted probabilities of MN formation calculated by using the parameters inferred on the model 1_2. (E) Model structures constructed to explain interphase duration (Int_durationn). The Int_durationn is modeled as a random variable from three distributions: the log normal function (LogNormal), the exponential function, and the gamma function. Small and large capitals on the right side indicate parameters and variables (dummy variables) obtained from data (0 or 1 in source data for Figs 4–6), respectively. Widely Applicable Information Criterion per sample values on the right. See the Materials and Methods section and Supplemental Data 4 for details. (F) Causal diagram that we assume for the inference of the impact of MN on interphase duration. Experimentally controlled variables, SCF, SIS, RNF, and STG (Stage_N), are given upstream variables (confounding factors); thereby, they are added to the linear predictor to fix them and infer the causality between MN and interphase duration. (G) Posterior distribution of the indicated parameters inferred from the most predictable model 2_2 with median (black circle), and 50% (red bar) and 95% (black bar) credible intervals.
Figure 6.
Figure 6.. Modeling of the effect of MN on interphase duration.
(A) The inferred probability of increased abnormalities compared with the sister lineage. Cell cycle abnormalities were compared between 43 matched sister pairs, one of which possesses MN, selected from all lineage trees of mCitrine-positive XpSIS2-3 (167 trees) and XpCTRL48 cells (138 trees). MN+ descendants showed increased abnormalities in 12 lineages, whereas none of MN descendants did. P-value was calculated by the Chi-square test. (B) Predictive distribution of interphase duration with the model 2_2 shown in Fig S13E. The values of parameters and ς inferred from the most predictable model 2_2 were used to build the distribution of interphase duration in the indicated conditions. The three vertical lines in each distribution indicate 25, 50, and 75 percentiles from left to right. P-values were calculated by the Kolmogorov-Smirnov statistic. (C) The interquartile range (IQR) of predicted interphase duration with the most predictable model 2_2. (B) IQR was calculated by subtracting 25 percentile from 75 percentile in each condition in (B). (D) A model for the cellular fate of a single SCF. Please refer to the main text for the detailed explanation. All phenotypes other than bridge resolution were directly observed in FuVis system. Source data are available for this figure.

Similar articles

Cited by

References

    1. Akaike H. (1974) A new look at the statistical model identification. IEEE Trans Automat Contr 19: 716–723. 10.1109/tac.1974.1100705 - DOI
    1. Bae S, Park J, Kim J-S (2014) Cas-OFFinder: A fast and versatile algorithm that searches for potential off-target sites of Cas9 RNA-guided endonucleases. Bioinformatics 30: 1473–1475. 10.1093/bioinformatics/btu048 - DOI - PMC - PubMed
    1. Blasco MA, Lee HW, Hande MP, Samper E, Lansdorp PM, DePinho RA, Greider CW (1997) Telomere shortening and tumor formation by mouse cells lacking telomerase RNA. Cell 91: 25–34. 10.1016/s0092-8674(01)80006-4 - DOI - PubMed
    1. Capper R, Britt-Compton B, Tankimanova M, Rowson J, Letsolo B, Man S, Haughton M, Baird DM (2007) The nature of telomere fusion and a definition of the critical telomere length in human cells. Genes Dev 21: 2495–2508. 10.1101/gad.439107 - DOI - PMC - PubMed
    1. Carpenter B, Gelman A, Hoffman MD, Lee D, Goodrich B, Betancourt M, Brubaker M, Guo J, Li P, Riddell A (2017) Stan: A probabilistic programming language. J Stat Softw 76: 32 10.18637/jss.v076.i01 - DOI - PMC - PubMed

Publication types

MeSH terms

LinkOut - more resources