Randomized Controlled Trial
. 2021 Jan;70(1):92-105.
doi: 10.1136/gutjnl-2020-322630. Epub 2020 Oct 26.

Faecal microbiota transplantation halts progression of human new-onset type 1 diabetes in a randomised controlled trial

Affiliations
Randomized Controlled Trial

Faecal microbiota transplantation halts progression of human new-onset type 1 diabetes in a randomised controlled trial

Pieter de Groot et al. Gut. 2021 Jan.

Abstract

Objective: Type 1 diabetes (T1D) is characterised by islet autoimmunity and beta cell destruction. A gut microbiota-immunological interplay is involved in the pathophysiology of T1D. We studied microbiota-mediated effects on disease progression in patients with type 1 diabetes using faecal microbiota transplantation (FMT).

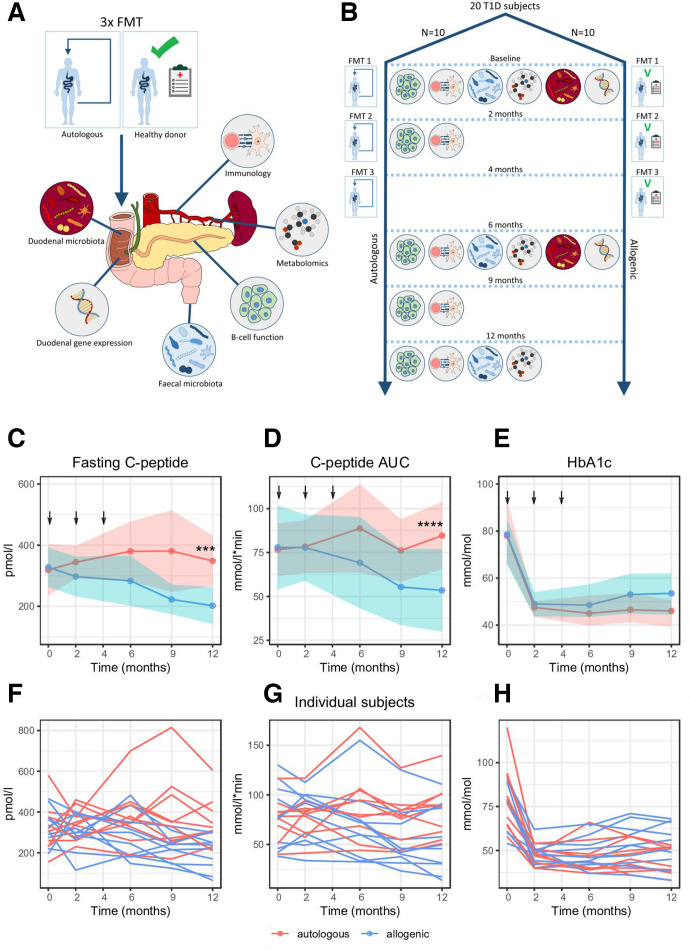
Design: Patients with recent-onset (<6 weeks) T1D (18-30 years of age) were randomised into two groups to receive three autologous or allogenic (healthy donor) FMTs over a period of 4 months. Our primary endpoint was preservation of stimulated C peptide release assessed by mixed-meal tests during 12 months. Secondary outcome parameters were changes in glycaemic control, fasting plasma metabolites, T cell autoimmunity, small intestinal gene expression profile and intestinal microbiota composition.

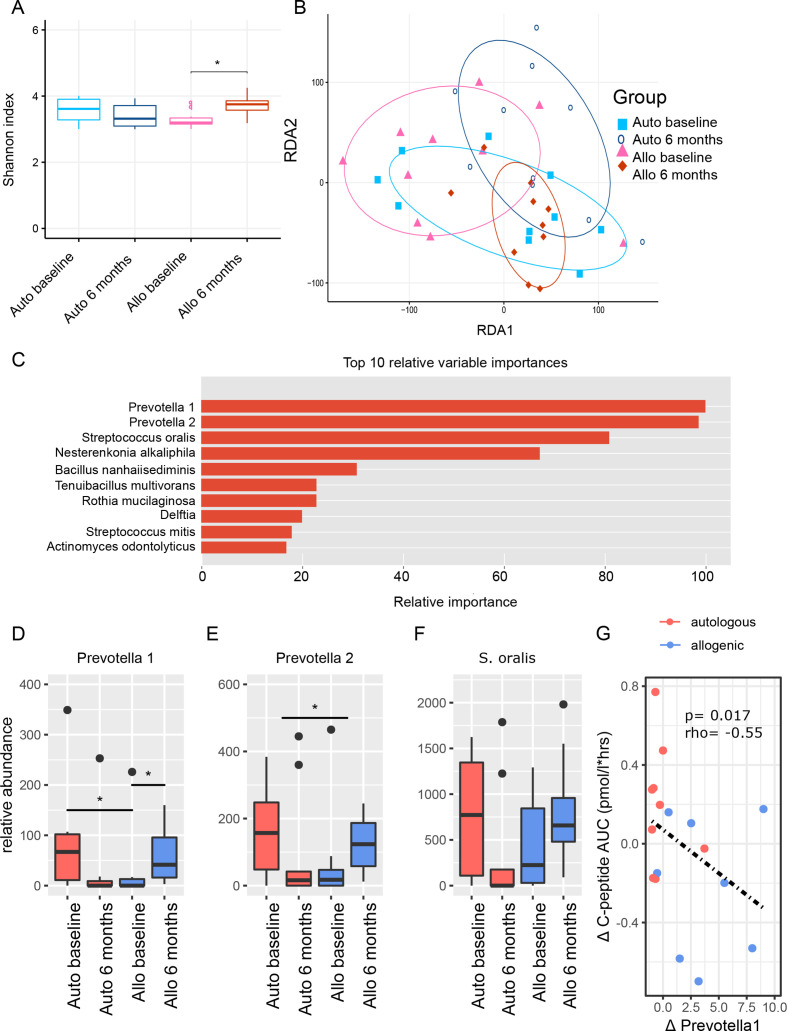
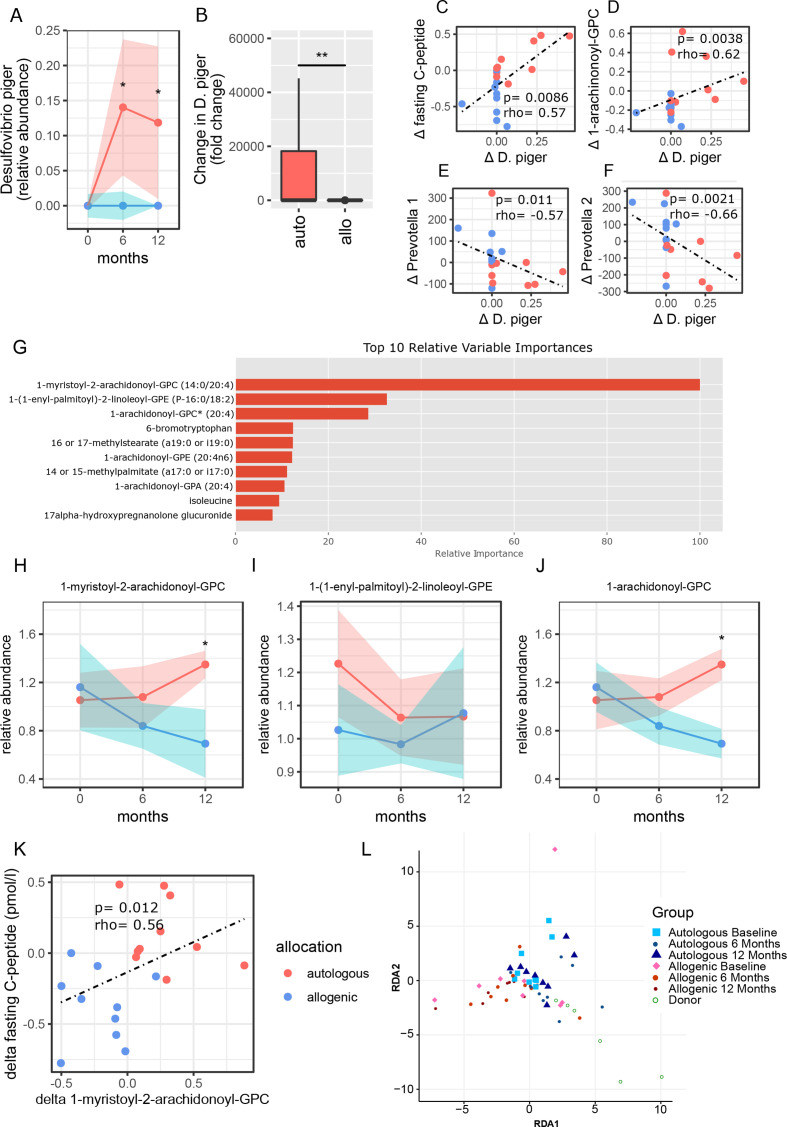
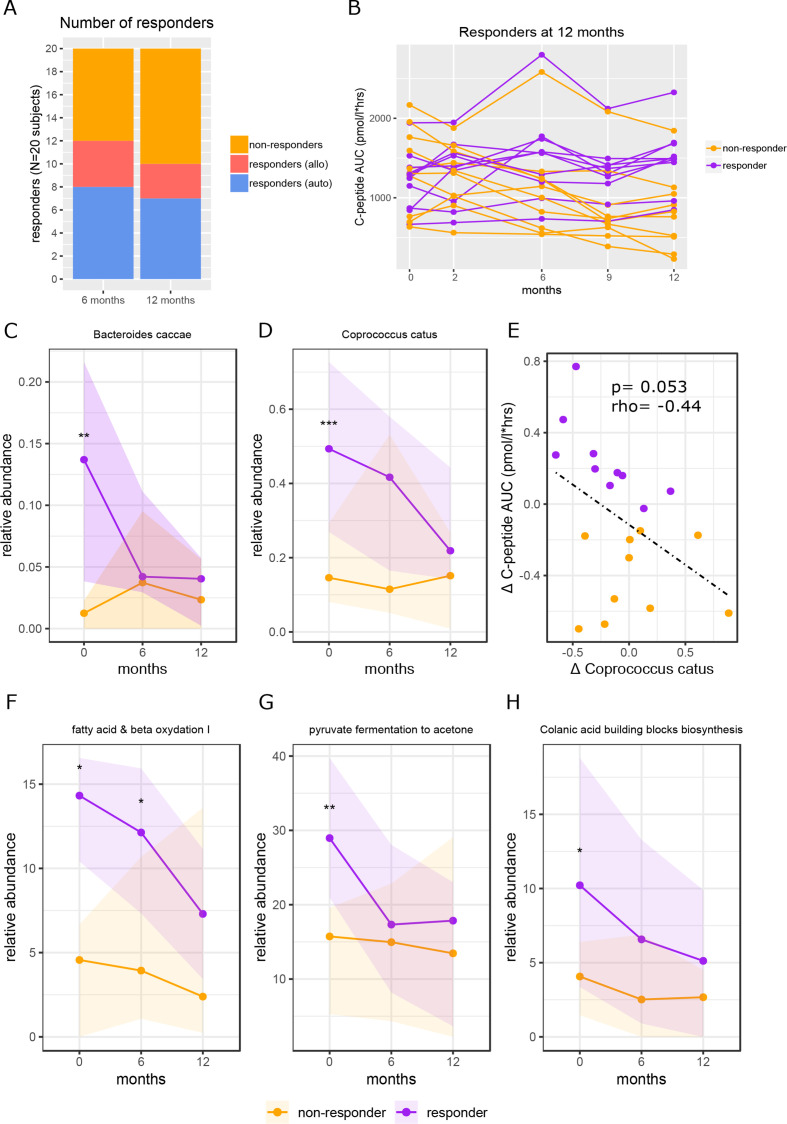
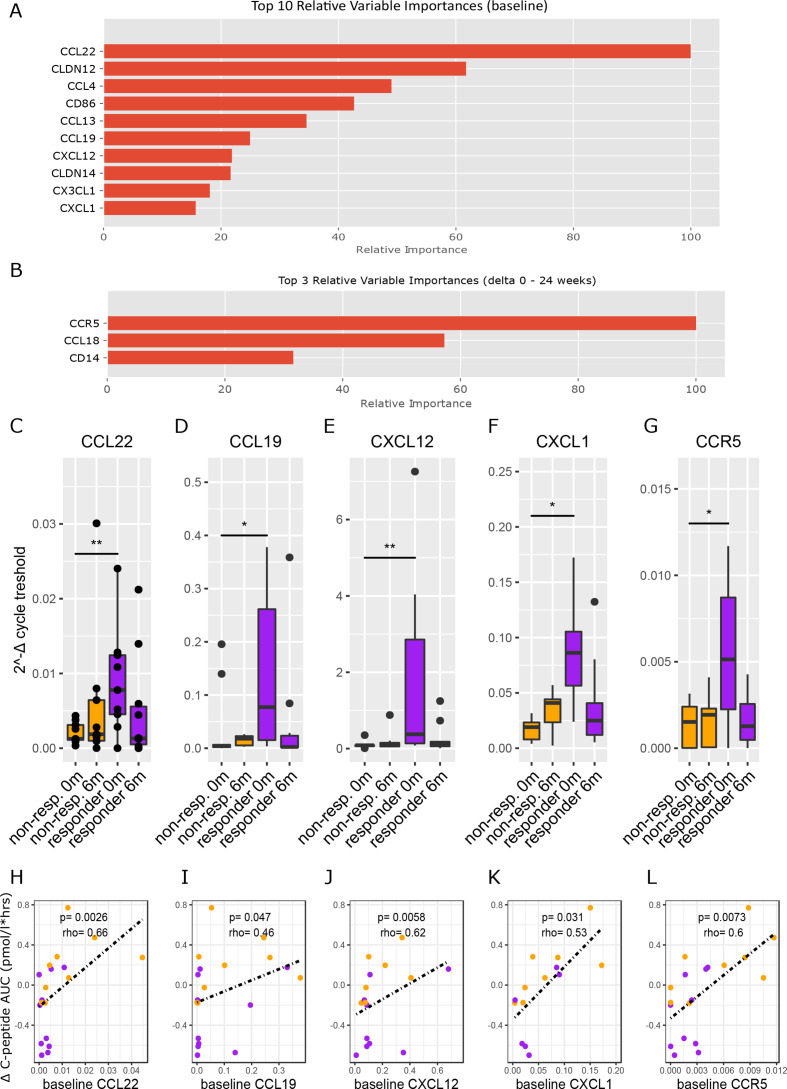
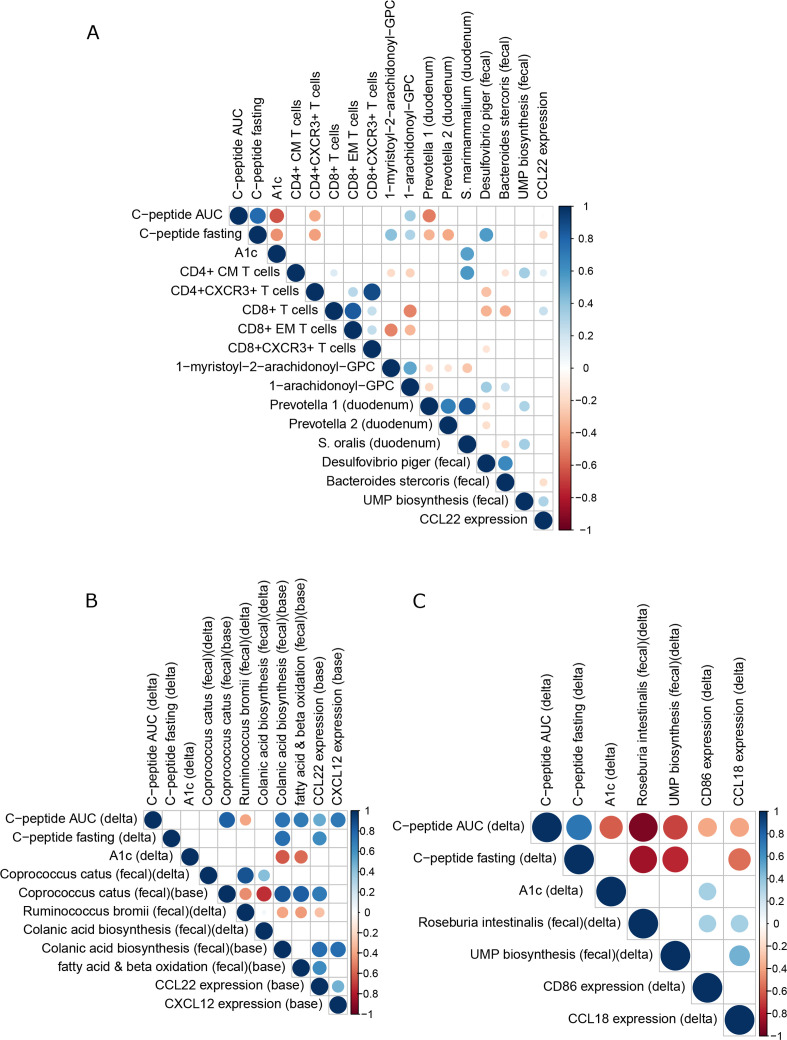
Results: Stimulated C peptide levels were significantly preserved in the autologous FMT group (n=10 subjects) compared with healthy donor FMT group (n=10 subjects) at 12 months. Small intestinal Prevotella was inversely related to residual beta cell function (r=-0.55, p=0.02), whereas plasma metabolites 1-arachidonoyl-GPC and 1-myristoyl-2-arachidonoyl-GPC levels linearly correlated with residual beta cell preservation (rho=0.56, p=0.01 and rho=0.46, p=0.042, respectively). Finally, baseline CD4 +CXCR3+T cell counts, levels of small intestinal Desulfovibrio piger and CCL22 and CCL5 gene expression in duodenal biopsies predicted preserved beta cell function following FMT irrespective of donor characteristics.

Conclusion: FMT halts decline in endogenous insulin production in recently diagnosed patients with T1D in 12 months after disease onset. Several microbiota-derived plasma metabolites and bacterial strains were linked to preserved residual beta cell function. This study provides insight into the role of the intestinal gut microbiome in T1D.

Trial registration number: NTR3697.

Keywords: diabetes mellitus.


Conflict of interest statement

Competing interests: MN and WMDV are founders and in the Scientific Advisory Board of Caelus Health, the Netherlands. WMDV is Founder and in the Scientific Advisory Board of A-Mansia, Belgium. MN is in the Scientific Advisory Board of Kaleido Biosciences, USA.

Figures

Figure 1
Figure 1
Schematic overview of study. (A) Study schematic showing which analyses were performed. (B) Study timeline showing FMTs were performed at 0, 2 and 4 months and which analyses where performed at each follow-up time point. (C) Change in fasting C peptide over time. Arrows indicate when FMT (allogenic: blue and autologous: pink with width of colour band indicating SD) was performed. Ribbons indicate CIs. Significance was calculated using LMM (see methods), *** p=0.00019. P values calculated using a Student’s t-test between groups at each time point were p=0.028 at 9 months and p=0.0049 at 12 months. (D) Change in C peptide AUC over time. Significance was calculated using LMM, **** p=0.000067. P value calculated using a Student’s t-test between groups at 12 months was p=0.033. (E) Change in A1c over time. Significance was calculated using LMM, p=0.12. P value calculated using a Mann-Whitney U test between groups at 12 months was p=0.19. SDs are depicted by the coloured width in the respective figures. (F, G and H) Individual trend lines for fasting C peptide, C peptide AUC and A1c respectively. AUC, area under the curve; FMT, faecal microbiota transplantation; LMM, linear mixed model; T1D, type 1 diabetes.
Figure 2
Figure 2
Small intestinal microbiota. (A) Boxplots of Shannon diversity between treatment groups at baseline and 6 months, which is the moment at which follow-up duodenal biopsies were taken. (B) RDA-plot showing clustering of treatment groups at baseline and at 6 months follow-up. (C) Top 10 small intestinal microbiota with relative importance that best predicted treatment group allocation allocation (XGBoost predictive modelling algorithm). Percentages are scaled towards the largest which is set at 100%. The top four microbiota stand out with higher relative importance. (D–F) Boxplots of top three small intestinal microbiota before and 6 months after FMT. P values were calculated using Mann-Whitney U test. The upper p value ‘(delta)’ was calculated by doing Mann-Whitney U test between the relative delta’s ((value after – value before)/value before) between treatment groups. Panel D: Prevotella 1 auto baseline versus allo baseline p value=0.033, Prevotella 1 allo baseline versus allo 6 months p value=0.049, Prevotella 2 delta auto versus delta allo p value=0.048, Streptococcus oralis auto baseline versus auto 6 months p value=0.012. Figure part G shows the Spearman correlation between our top microbe Prevotella 1 and our primary endpoint of Mixed Meal Test (MMT) stimulated C peptide release. FMT, faecal microbiota transplantation; RDA, redundancy analysis.
Figure 3
Figure 3
Correlations of clinical outcomes with plasma metabolites and Desulfovibrio piger. (A) Abundance of faecal D. piger over time (allogenic: blue, and autologous: pink with width of colour band indicating SD). P values were calculated using Mann-Whitney U test. At 6 months p value=0.024, at 12 months p value=0.023. (B) Fold change in D. piger between the groups (allogenic: blue and autologous: pink). The delta p value was calculated by doing Mann-Whitney U test on the delta’s between 0 and 12 months of each group, p value=0.006. (C) Spearman correlation plot of delta (0–12 months) faecal D. piger and delta (0–12 months) of fasting C peptide. (D) Correlation plot of faecal D. piger and 1-arachidonoyl-GPC. (E) Correlation plot of faecal D. piger and small intestinal Prevotella 1. (F) Correlation plot of faecal D. piger and small intestinal Prevotella 2. (G) Top 10 metabolites that best predicted treatment group allocation allocation (XGBoost predictive modelling algorithm). Percentages are scaled towards the largest, which is set at 100%. Top three metabolites stand out with higher relative importance in the analysis. (H–J) Relative abundance of top three metabolites plotted against time (allogenic: blue and autologous: pink with width of colour band indicating SD). Medians±IQR (P25–P75) are reported. P values were calculated using Mann-Whitney U test between groups at 12 months. 1-myristoyl-2-arachidonoyl-GPC is different between groups at 12 months, p value=0.020. 1-arachidonoyl-GPC is different between groups at 12 months, p value=0.020. (K) Spearman correlation between change in fasting C peptide and change in 1-myristoyl-2-arachidonoyl-GPC. (G) RDA of fasting plasma metabolites over time in T1D compared with healthy donors. T1D, type 1 diabetes.
Figure 4
Figure 4
Baseline faecal microbiota and functional pathways in FMT clinical responders versus non-responders. Figure part A shows the number of responders at 6 months and at 12 months and how many subjects were in each treatment group. Response was defined as <10% decline in C peptide AUC compared with baseline. The 12 months responders were used for all analyses. Figure part B shows individual subject lines of C peptide AUC over time. Responders in purple and non-responders in yellow. Figure parts C and D show the abundance of Bacteroides caccae and Coprococcus catus over time, respectively. P values were calculated using Mann-Whitney U test between groups at each time point. For B. caccae at baseline the p value=0.0099, for C. catus at baseline the p value=0.00049. Figure part E shows the correlation between delta C. catus (0–12 months) and delta C peptide AUC (0–12 months). Spearman’s rho (r) is shown, and the p value was calculated using Spearman’s rank. Figure part F shows the relative abundance over time of fatty acid and beta oxidation, p value at baseline=0.014, p value at 6 months=0.011; figure part G shows the relative abundance over time of pyruvate fermentation to acetone, p value at baseline=0.0015; figure part H shows the relative abundance of time of the colonic acid building blocks biosynthesis pathways, p value at baseline=0.015. All p values were calculated using Mann-Whitney U test. AUC, area under the curve; FMT, faecal microbiota transplantation.
Figure 5
Figure 5
Duodenal gene expression in FMT clinical responders versus non-responders. Figure part A shows the top 10 genes of which baseline expression best differentiated responders from non-responders. Figure part B shows the top three genes of which change in gene expression (0–6 months) best differentiated responders from non-responders. Figure parts C–G show the genes from figure 5A that were significantly different between responders and non-responders at baseline. P values were calculated using Mann-Whitney U test between groups at each time point. Panel C p value=0.0039, panel D p value=0.011, panel E p value=0.0039, panel F p value=0.021, panel G p value=0.015. Figure parts H–L show the Spearman correlations between baseline expression of the genes from figure 5C–G and change in C peptide AUC. AUC, area under the curve; FMT, faecal microbiota transplantation.
Figure 6
Figure 6
Correlation plots with altered plasma metabolites, bacterial strains and residual beta cell function on FMT. (A) Plot showing Spearman correlations of all subjects pooled (n=20). Only significant (p<0.05) correlations are shown. Red designates a negative correlation and blue a positive correlation. Dot size corresponds to p value (larger is smaller) and dot colour to correlation strength (Spearman’s rho). This plot was derived from a larger plot from which all parameters that did not correlate with our primary endpoint and/or any key parameters were removed. (B) As figure part A, for autologous treatment group. (C)aAs figure part A, for the allogenic treatment group. AUC, area under the curve; FMT, faecal microbiota transplantation.

Comment in

References

    1. Bougnères PF, Landais P, Boisson C, et al. . Limited duration of remission of insulin dependency in children with recent overt type I diabetes treated with low-dose cyclosporin. Diabetes 1990;39:1264–72. 10.2337/diab.39.10.1264 - DOI - PubMed
    1. Herold KC, Gitelman SE, Ehlers MR, et al. . Teplizumab (anti-CD3 mAb) treatment preserves C-peptide responses in patients with new-onset type 1 diabetes in a randomized controlled trial: metabolic and immunologic features at baseline identify a subgroup of responders. Diabetes 2013;62:3766–74. 10.2337/db13-0345 - DOI - PMC - PubMed
    1. Haller MJ, Long SA, Blanchfield JL, et al. . Low-Dose anti-thymocyte globulin preserves C-peptide and reduces A1c in new onset type 1 diabetes: two year clinical trial data. Diabetes. - PMC - PubMed
    1. Orban T, Bundy B, Becker DJ, et al. . Co-Stimulation modulation with abatacept in patients with recent-onset type 1 diabetes: a randomised, double-blind, placebo-controlled trial. Lancet 2011;378:412–9. 10.1016/S0140-6736(11)60886-6 - DOI - PMC - PubMed
    1. Orban T, Bundy B, Becker DJ, et al. . Costimulation modulation with abatacept in patients with recent-onset type 1 diabetes: follow-up 1 year after cessation of treatment. Diabetes Care 2014;37:1069–75. 10.2337/dc13-0604 - DOI - PMC - PubMed

Publication types

Associated data

LinkOut - more resources