. 2021 Feb;19(2):240-248.
doi: 10.1158/1541-7786.MCR-19-0480. Epub 2020 Oct 26.

Palmitate-Induced IRE1-XBP1-ZEB Signaling Represses Desmoplakin Expression and Promotes Cancer Cell Migration

Affiliations

Palmitate-Induced IRE1-XBP1-ZEB Signaling Represses Desmoplakin Expression and Promotes Cancer Cell Migration

Aritro Nath et al. Mol Cancer Res. 2021 Feb.

Abstract

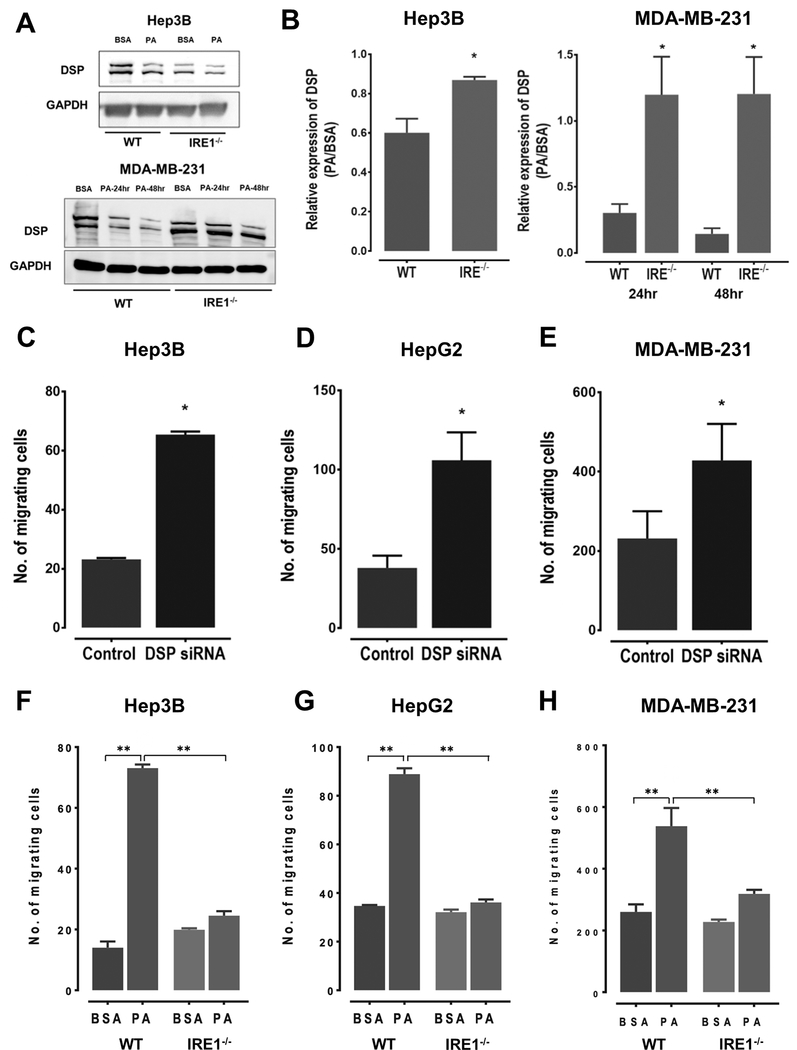
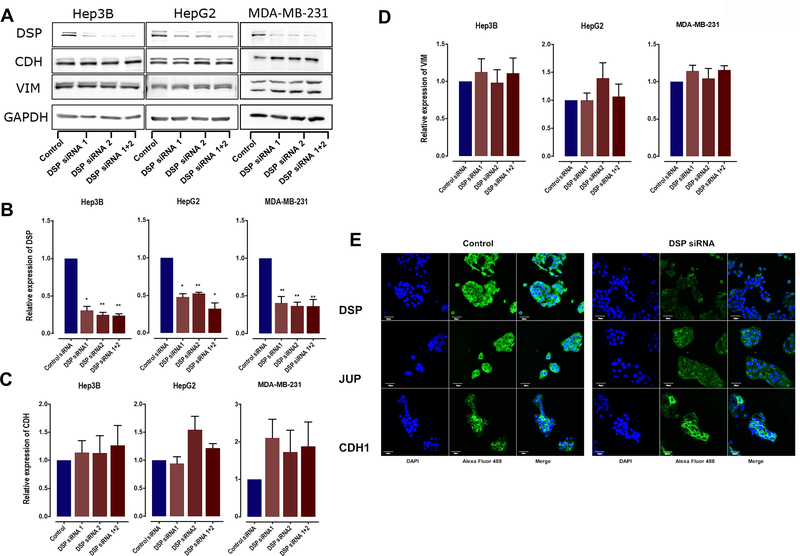
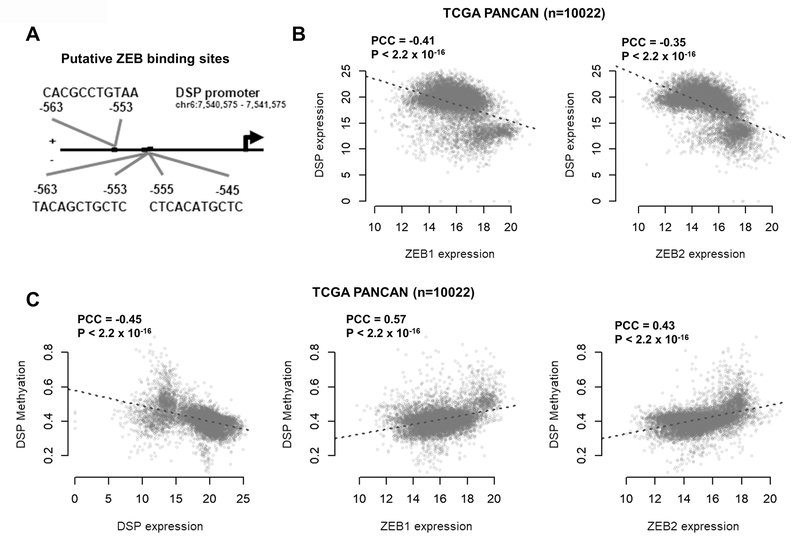
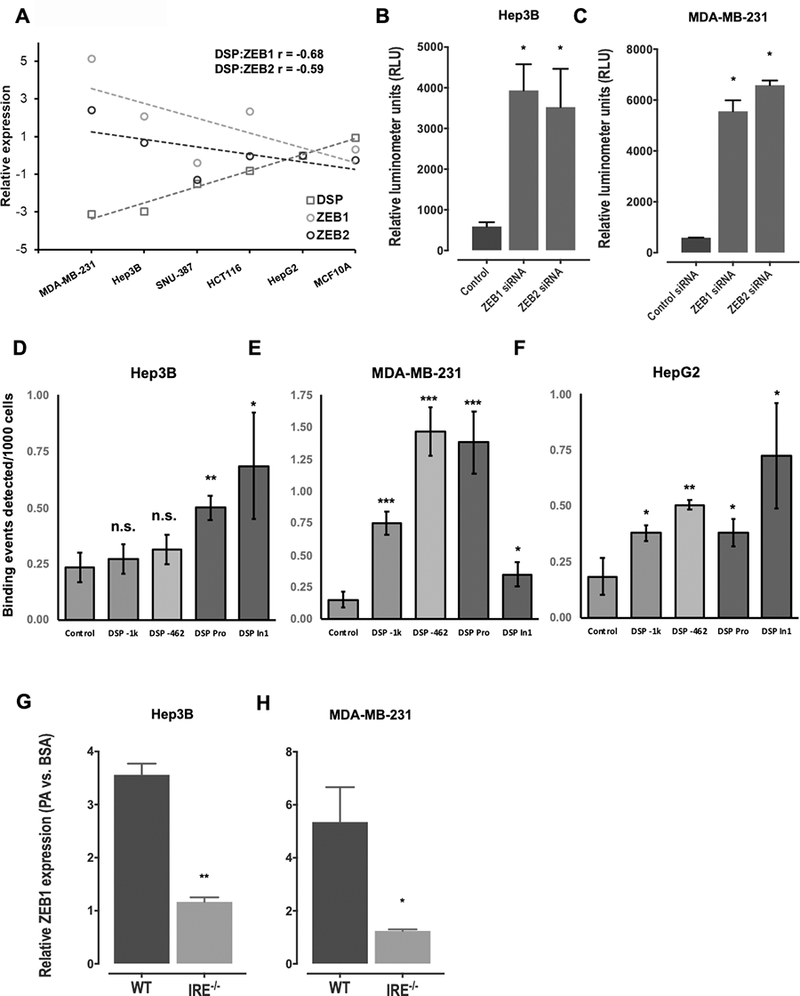
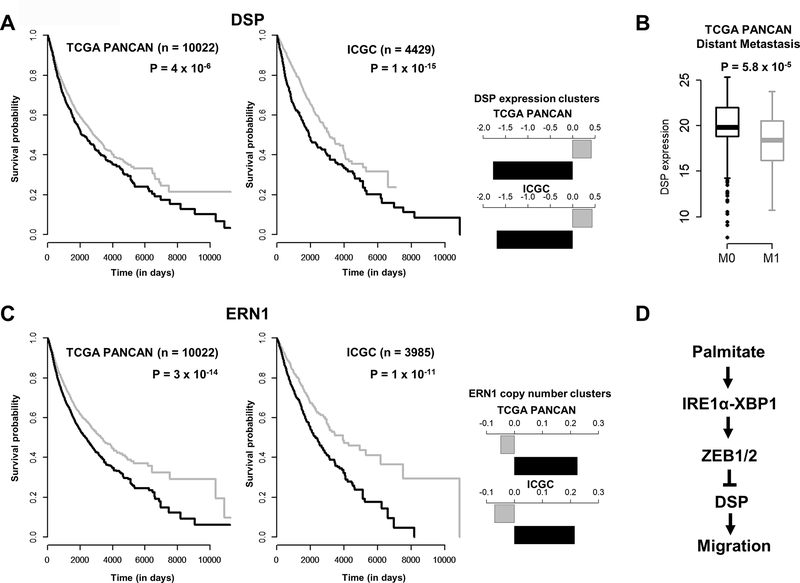
Elevated uptake of saturated fatty acid palmitate is associated with metastatic progression of cancer cells; however, the precise signaling mechanism behind the phenomenon is unclear. The loss of cell adhesion proteins, such as desmoplakin (DSP), is a key driving event in the transformation of cancer cells to more aggressive phenotypes. Here, we investigated the mechanism by which palmitate induces the loss of DSP in liver and breast cancer cells. We propose that palmitate activates the IRE1-XBP1 branch of the endoplasmic reticulum (ER) stress pathway to upregulate the ZEB transcription factor, leading to transcriptional repression of DSP. Using liver and breast cancer cells treated with palmitate, we found loss of DSP leads to increased cell migration independent of E-cadherin. We report that the ZEB family of transcription factors function as direct transcriptional repressors of DSP. CRISPR-mediated knockdown of IRE1 confirmed that the transcription of ZEB, loss of DSP, and enhanced migration in the presence of palmitate is dependent on the IRE1-XBP1 pathway. In addition, by analyzing the somatic expression and copy number variation profiles of over 11,000 tumor samples, we corroborate our hypothesis and establish the clinical relevance of DSP loss via ZEB in human cancers. IMPLICATIONS: Provides mechanistic link on palmitate-induced activation of IRE1α to cancer cell migration.


Conflict of interest statement

Conflict of interest: The authors declare no conflicts of interest

Figures

Figure 1:
Figure 1:
A. Western blots showing expression levels of DSP I + II in WT or IRE1−/− KO Hep3B and MDA-MB-231 cells. The cells were cultured in the presence of either 0.3mM palmitate (PA) or 2% BSA. The Hep3B cell lysates were collected after 48 hours post-treatment, whereas MDA-MB-231 cell lysates were collected at 24 and 48-hour time points B. Quantification of the western blots comparing DSP I + II expression levels in WT and IRE1−/− KO Hep3B and MDA-MB-231 cells. Data shown here is mean ±SE of three independent experiments, with * indicating a Student’s T-test P < 0.05. C-E. Quantification of the number of migrating cells Boyden’s chamber assay in HepG2 (C), Hep3B (D) and MDA-MB-231 (E) cells treated with DSP siRNA or scramble siRNA (control). The bars here represent mean ±SE of three independent experiments, with * indicating a Student’s T-test P < 0.05. F-H. Quantification of the number of migrating cells determined using Boyden’s chamber assay in WT or IRE1−/− KO HepG2 (F), Hep3B (G) and MDA-MB-231 (H) cells. The cells were additionally incubated with either BSA or PA. The bars here represent mean ±SE of three independent experiments, with * indicating two-way ANOVA with P < 0.05 and ** indicating P <0.01. Two-ANOVA analysis shows both PA treatment and IRE1 KO status significantly affected cell migration. PA treatment resulted in an increase (P < 0.05) while IRE1 KO resulted in a decrease in cell migration (P < 0.05) in all three cell lines.
Figure 2
Figure 2
A: Western Blots showing expression of DSP I + II, CDH1, VIM and GAPDH in HepG2, Hep3B, and MDA-MB-231 cells treated with two individual or pooled DSP siRNAs. B-D. Quantification of the western blots for DSP siRNA-treated HepG2, Hep3B, and MDA-MB-231 cells, comparing the expression levels of DSP, CDH1, and VIM. Bars represent mean ±SE across 3 independent replicates with * indicating Student’s T-test P < 0.05 and ** indicating P < 0.01. E. Confocal images showing the expression and localization of the desmosomal component DSP and JUP, along with CDH1, in HepG2 cells treated with DSP siRNA or scramble siRNA (control). Each image was acquired using uniform image acquisition parameters and the scale bar represents a length of 30μm.
Figure 3:
Figure 3:
A. Schematic diagram of the DSP promoter (−1000bp upstream of transcription start site) displaying putative ZEB binding sites B. Scatterplots showing the correlation between DSP, ZEB1 and ZEB2 expression levels across 10,022 samples in the TCGA PANCAN (pan-cancer) dataset C. Scatterplots showing the correlation between DSP methylation levels with DSP, ZEB1 and ZEB2 expression in the TCGA PANCAN dataset. PCC indicates Pearson’s correlation coefficient and the P values indicates significance of correlation
Figure 4
Figure 4
A: Scatterplots showing correlation in basal expression levels between DSP, ZEB1, and ZEB2 across six cancer cell lines. The expression levels (Y-axis) of the three genes were normalized to GAPDH in each cell line and represented relative to the levels in HepG2 cells. B-C. Barplots showing results of the DSP promoter luciferase assay in response to siRNA-mediated knockdown of ZEB1 or ZEB2 in Hep3B (C) or MDA-MB-231 cells (C). D-F. Barplots displaying results of ZEB1 ChIP-qPCR assay in Hep3B (D), MDA-MB-231 (E) or HepG2 (F) cells. The Y-axis represents number of binding events detected per 1000 input cells. The binding events were quantified by qPCR for various segments along the DSP promoter and first DSP intron that contained putative ZEB binding sites, and compared with negative control. G, H. Loss of ZEB1 gene expression in IRE1−/− KO Hep3B (G) or MDA-MB-231 (H) cells. The barplots in each panel represent mean ±SE of three independent replicates with * indicating Student’s T-test P < 0.05, ** indicating P < 0.01 and ns indicating not significant.
Figure 5
Figure 5
A: Kaplan-Meier (survival) curves of TCGA PANCAN (n=10022) or ICGC (n=4429) patients grouped according to expression levels of DSP. The samples in each cohort were clustered using K-means (K=2). Barplots on the right indicate centers of the expression clusters in each study. P values indicate significance of the log-rank (Mantel-Cox) test. B. Boxplots comparing the expression levels of DSP in the TCGA PANCAN cohort based on distant metastasis status. M0 indicates no reported indications of metastasis whereas M1 indicates presence of one or more distant metastases. C. Kaplan-Meier (survival) curves of TCGA PANCAN patients grouped according to copy number variation status of ERN1 (IRE1). Samples were clustered using K-means clustering (K=2) based on mean segment copy number, with P values indicating significance of the log-rank (Mantel-Cox) test. D. A proposed PA-induced pathway driving migration of the cancer cells through the loss of DSP mediated by activation of the IRE1-XBP1 pathway and ZEB transcription factors.

Similar articles

Cited by

References

    1. Hanahan D, Weinberg Robert A. Hallmarks of Cancer: The Next Generation. Cell 2011;144:646–74 - PubMed
    1. Ye X, Weinberg RA. Epithelial–Mesenchymal Plasticity: A Central Regulator of Cancer Progression. Trends in Cell Biology 2015;25:675–86 - PMC - PubMed
    1. Thiery JP, Acloque H, Huang RYJ, Nieto MA. Epithelial-Mesenchymal Transitions in Development and Disease. Cell 2009;139:871–90 - PubMed
    1. Lamouille S, Xu J, Derynck R. Molecular mechanisms of epithelial–mesenchymal transition. Nature Reviews Molecular Cell Biology 2014;15:178–96 - PMC - PubMed
    1. Serrano-Gomez SJ, Maziveyi M, Alahari SK. Regulation of epithelial-mesenchymal transition through epigenetic and post-translational modifications. Molecular Cancer 2016;15 - PMC - PubMed

Publication types

MeSH terms