. 2020 Nov 10;117(45):28221-28231.
doi: 10.1073/pnas.2010303117. Epub 2020 Oct 26.

Characterization of systemic genomic instability in budding yeast

Affiliations

Characterization of systemic genomic instability in budding yeast

Nadia M V Sampaio et al. Proc Natl Acad Sci U S A. .

Abstract

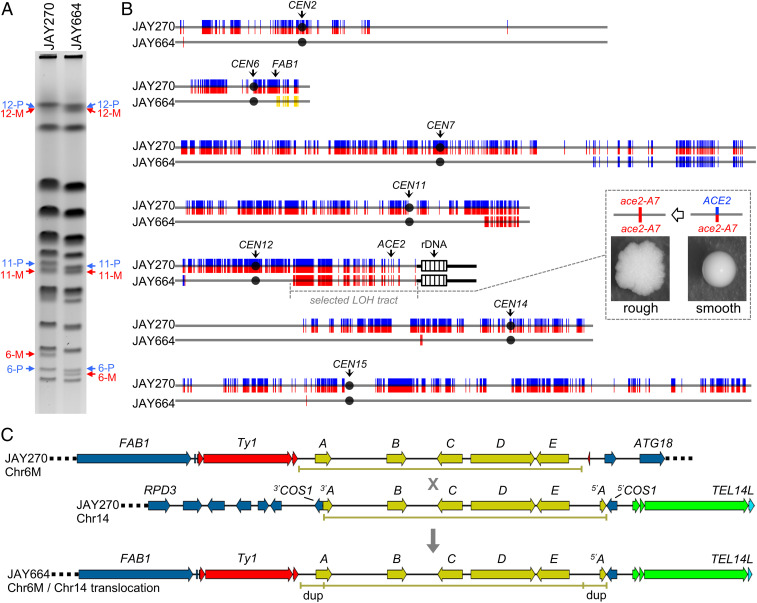
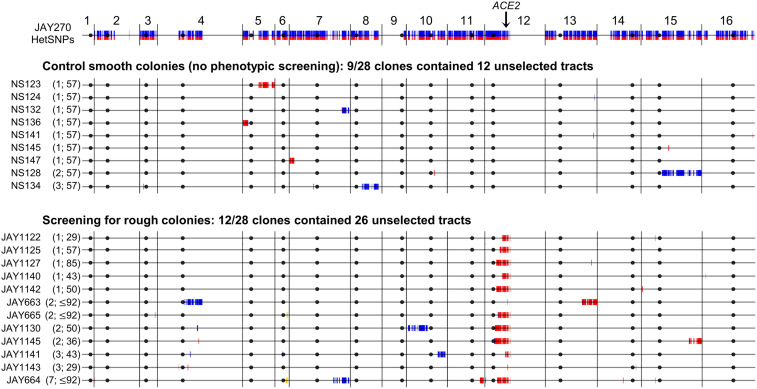
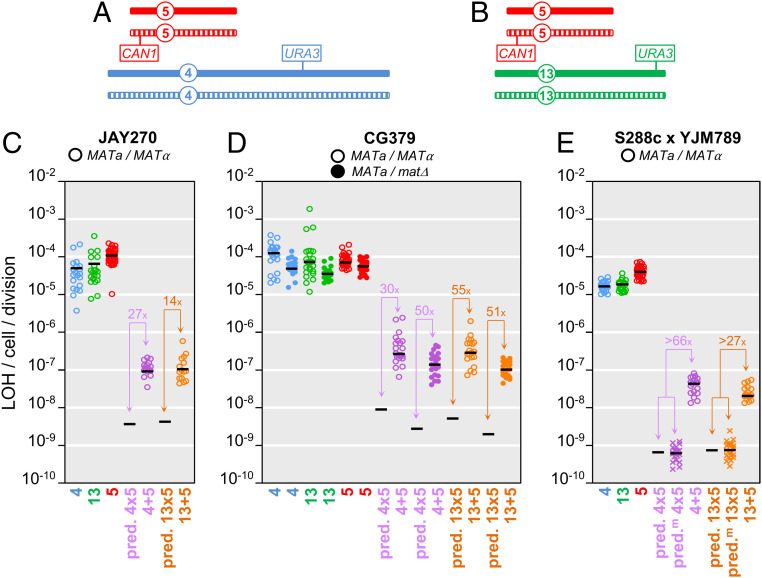
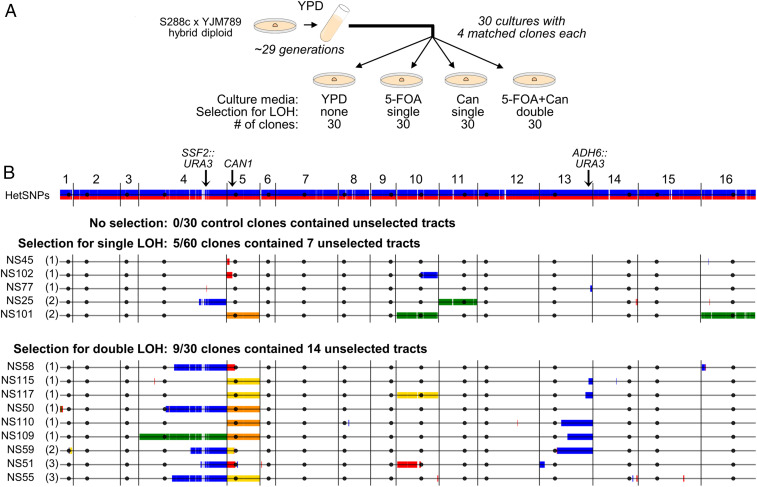
Conventional models of genome evolution are centered around the principle that mutations form independently of each other and build up slowly over time. We characterized the occurrence of bursts of genome-wide loss-of-heterozygosity (LOH) in Saccharomyces cerevisiae, providing support for an additional nonindependent and faster mode of mutation accumulation. We initially characterized a yeast clone isolated for carrying an LOH event at a specific chromosome site, and surprisingly found that it also carried multiple unselected rearrangements elsewhere in its genome. Whole-genome analysis of over 100 additional clones selected for carrying primary LOH tracts revealed that they too contained unselected structural alterations more often than control clones obtained without any selection. We also measured the rates of coincident LOH at two different chromosomes and found that double LOH formed at rates 14- to 150-fold higher than expected if the two underlying single LOH events occurred independently of each other. These results were consistent across different strain backgrounds and in mutants incapable of entering meiosis. Our results indicate that a subset of mitotic cells within a population can experience discrete episodes of systemic genomic instability, when the entire genome becomes vulnerable and multiple chromosomal alterations can form over a narrow time window. They are reminiscent of early reports from the classic yeast genetics literature, as well as recent studies in humans, both in cancer and genomic disorder contexts. The experimental model we describe provides a system to further dissect the fundamental biological processes responsible for punctuated bursts of structural genomic variation.

Keywords: genomic instability; loss-of-heterozygosity; mitotic recombination.


Conflict of interest statement

The authors declare no competing interest.

Figures

Fig. 1.
Fig. 1.
Genomic analysis of the JAY664 rough colony isolate. (A) PFGE of JAY270 and JAY664. Arrows indicate the bands for Chr6, Chr11, and Chr12, with the two homologs identified as paternal (P, blue) or maternal (M, red) according to the phased HetSNP haplotypes described previously (18). (B) Distribution of HetSNPs in JAY270 and tracts of LOH and CNA in JAY664. JAY270 HetSNPs are represented as double colored vertical lines (P/M; blue/red). In the JAY664 maps below, markers that remained heterozygous were omitted to emphasize visualization of tracts of copy-neutral LOH (double red [M/M] and double blue [P/P]), or CNA deletion on Chr6 (double yellow). Interstitial changes are present in Chr2, Chr14, and Chr15; Terminal changes in Chr6, Chr7, Chr11, and Chr12. The LOH tract on the right arm of Chr12 spanning the ACE2 locus was selected based on the rough colony morphology shown in the Inset. The LOH tracts on the left arm of Chr12 and on each of the other chromosomes were unselected. Chromosome numbers are to the left of each map, black circles represent their respective centromeres, and the positions of pertinent loci are indicated. Striped boxes on the right arm of Chr12 represent ∼1.5 Mb of ribosomal DNA repeats (rDNA); regions distal to the rDNA are homozygous in JAY270 so are not represented. Chromosome plots were generated to scale in Python 2.7 using the matplotlib package and a custom script. For size reference, Chr6 is 270 kb. (C) The detailed DNA structures determined by Nanopore single molecule long read WGS present in JAY270 Chr6M, JAY270 Chr14, and at the junction of the JAY664 Chr6M/Chr14 NAHR-mediated nonreciprocal translocation. The sequences in yellow correspond to the Zb circle insertions, with the five ORFs being labeled A through E following the abbreviations described previously (21). The “X” represents the deduced NAHR event and the downward arrow points to the recombination outcome detected in JAY664. Ty1 and δ LTR retrotransposon sequences are shown in red, and telomeric sequences (X and Y′ elements, and the telomeric short repeats) are shown in green. dup indicates the short segment of the Zb circle at the Chr6-M/Chr14 junction that was duplicated by the NAHR event.
Fig. 2.
Fig. 2.
Genome-wide maps of unselected LOH and CNA tracts in smooth and rough colony isolates derived from JAY270. The top horizontal line is the linear end-to-end depiction of the 16 S. cerevisiae chromosomes in the JAY270 strain, with HetSNPs represented as described in Fig. 1B. Chromosome numbers are indicated above, black circles represent their respective centromeres, and the position of the ACE2 locus on Chr12 is shown. The tract maps below are grouped for control smooth and rough colony clones. Each horizontal line corresponds to the genomes of clones that displayed at least one unselected LOH or CNA tract. HetSNPs that were homozygous P/P (blue) or M/M (red) are shown, while markers that remained heterozygous in those clones were omitted. Two CNA deletions are shown in yellow (Chr6 [P/-] in JAY664 and Chr6 [M/-] JAY665). The numbers of unselected tracts and the number of generations used to isolate each clone are shown between parentheses (i.e., no. unselected tracts; no. generations). As expected from selection for the rough colony morphology, all rough clones were homozygous for the maternal ace2-A7 allele on Chr12 (red) (SI Appendix, Fig. S2). Full LOH calls with coordinates are available in Dataset S1. Plots were generated to scale as in Fig. 1B. For size reference, Chr1 is 230 kb.
Fig. 3.
Fig. 3.
Quantitative analyses of single and double LOH rates. (A and B) Schematic representations of the positions of hemizygous counter-selectable markers in the diploid yeast strains used in the LOH assays. The pairs of homologous chromosomes are shown as solid or striped for Chr5 (red), Chr4 (blue), Chr13 (green), with the overall sizes, and positions of markers and centromeres drawn to approximate scale. A shows the genomic configuration of markers in strains used in the Chr4 plus Chr5 double LOH assays, and B shows the configuration used for the Chr13 plus Chr5 assays. Specifically, for the hybrid strain background in E, the solid chromosome corresponds to the S288c homolog and the striped homolog corresponds to the YJM789 homolog. The CAN1 locus was present at its native position on Chr5, and the CORE2 cassettes were inserted near SSF2 in Chr4 and ADH6 in Chr13. C shows the mutation rate data for the JAY270 strain background calculated using the L&C method of the median. Circles indicate the experimentally determined rates in individual cultures, color-coded according to single chromosomes, as in A and B, and double chromosomes using purple for Chr4 plus Chr5 or orange for Chr13 plus Chr5. Black horizontal bars indicate the median rate values for each culture set. The same numerical data are shown in SI Appendix, Table S4, including 95% confidence intervals (not plotted in CE). “pred” in the x axis designates the predicted double LOH rates based on the multiplicative product of the pertinent median single LOH rate pairs. Only the black bar is shown in these “pred” cases. The excess fold-ratio of experimentally observed overcalculated expected double LOH rates are shown in all pairwise comparisons. D shows the LOH rate data in the CG379 strain background similarly to C, with the exception that open circles correspond to MATa/MATα, while solid circles correspond to data collected in the isogenic MATa/matΔ strain. E shows the LOH rate data in the S288c x YJM789 hybrid strain background similarly to C, with addition of an alternative method for the calculation of predicted double LOH rates (predm). For this strain background, aliquots from each individual culture were plated in YPD, 5-FOA, Can, and 5-FOA plus Can (Fig. 4A), producing culture-matched single and double LOH rate results. The “X” symbols in the predm datasets correspond to the expected matched double LOH rates for each culture obtained by multiplying the pertinent two single LOH rates within that same culture. The black bar in those cases corresponds to the median value of matched expected double LOH rates. The conventional (pred) and matched expected (predm) double LOH rate estimates were very close. The most conservative value for the excess ratio observed over experimentally measured or observed over predm is shown in the plot.
Fig. 4.
Fig. 4.
Genome-wide maps of unselected LOH and CNA tracts in clones derived from S288c × YJM789 hybrid diploids. (A) Experimental design: A total of 30 YPD cultures (15 of the Chr4 plus Chr5 strain JAY2357, and 15 of the Chr13 plus Chr5 strain JAY2358) were started from single cells, grown into colonies, and then transferred to 5-mL tubes until saturation (∼3 × 10⁸ cells per culture; ∼29 cell generations). Four appropriate aliquot dilutions from each culture were plated, one each: Nonselectively to YPD, selectively for single LOH on 5-FOA, selectively for single LOH on canavanine, and selectively for double LOH on 5-FOA plus canavanine. One colony per plate was isolated and whole-genome–sequenced, for a total of 30 sets of 4 culture-matched clones. (B) The results of the WGS analysis. The top horizontal line is the linear end-to-end depiction of the 16 chromosomes in the S288c × YJM789 hybrid diploid strain background, with HetSNPs represented as red S288c alleles and blue YJM789 alleles. Chromosome numbers are indicated above, and black circles represent their respective centromere positions. Each horizontal line corresponds to the genomes of clones that displayed at least one unselected LOH or CNA tract, grouped according to their selection category (no selection; single selection on 5-FOA or Can; double selection on 5-FOA plus Can). None of the no-selection control clones contained any LOH or CNA tracts, thus none of those clones are displayed. For the single- and double-selection groups, the number of unselected tracts in each clone is shown between parentheses. Identical LOH tracts that were detected in all four clones in a matched set (preculture) are displayed in the plots, but were not counted toward the total of unselected tracts that arose during each culture. Markers that remained heterozygous were omitted to emphasize visualization of tracts. HetSNPs that were homozygous YJM789/YJM789 (blue) or S288c/S288c (red) are shown as double vertical lines above and below the black chromosome line. No segmental CNAs were found, but multiple whole-chromosome CNAs were. Chromosome losses (monosomy) are shown in yellow; chromosome gains (trisomy) are shown in green. Cases of copy-neutral LOH spanning whole chromosomes (UPD) are shown in orange. Details of all selected and unselected tracts are also available in SI Appendix, Figs. S4–S6, and Table S5 and Dataset S2. Plots were generated to scale as in Fig. 1B. For size reference, Chr1 is 230 kb.

References

    1. Cross W. Ch., Graham T. A., Wright N. A., New paradigms in clonal evolution: Punctuated equilibrium in cancer. J. Pathol. 240, 126–136 (2016). - PubMed
    1. Turajlic S., Sottoriva A., Graham T., Swanton C., Resolving genetic heterogeneity in cancer. Nat. Rev. Genet. 20, 404–416 (2019). - PubMed
    1. Gao R., et al. , Punctuated copy number evolution and clonal stasis in triple-negative breast cancer. Nat. Genet. 48, 1119–1130 (2016). - PMC - PubMed
    1. Cross W. et al. .; S:CORT Consortium , The evolutionary landscape of colorectal tumorigenesis. Nat. Ecol. Evol. 2, 1661–1672 (2018). - PMC - PubMed
    1. Field M. G., et al. , Punctuated evolution of canonical genomic aberrations in uveal melanoma. Nat. Commun. 9, 116 (2018). - PMC - PubMed

Publication types

MeSH terms

LinkOut - more resources