. 2020 Nov 10;117(45):28201-28211.
doi: 10.1073/pnas.2002660117. Epub 2020 Oct 26.

Comprehensive characterization of amino acid positions in protein structures reveals molecular effect of missense variants

Affiliations

Comprehensive characterization of amino acid positions in protein structures reveals molecular effect of missense variants

Sumaiya Iqbal et al. Proc Natl Acad Sci U S A. .

Abstract

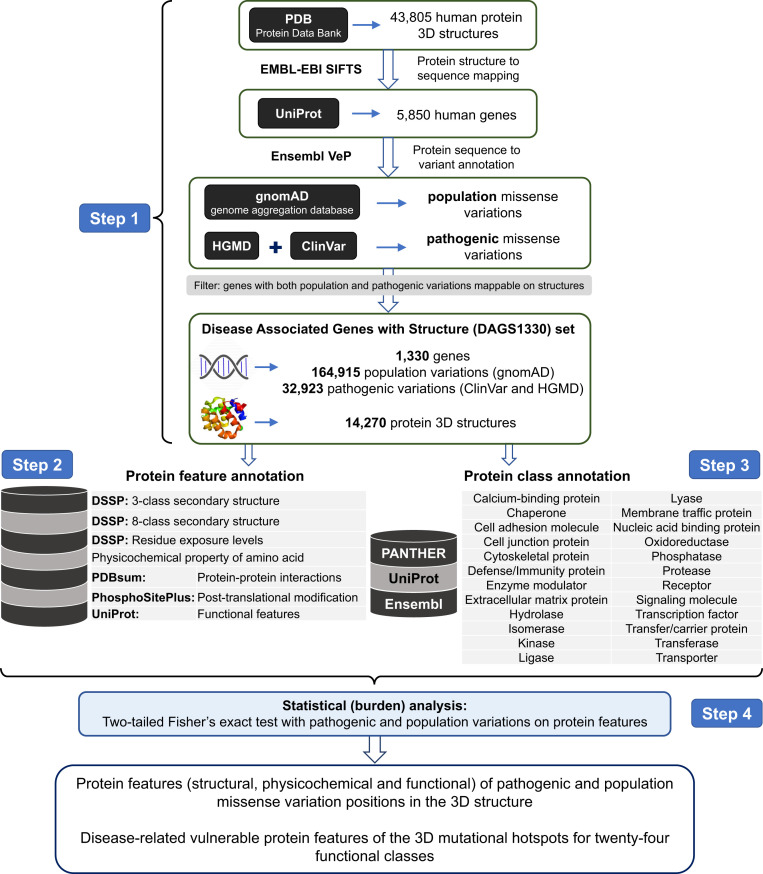
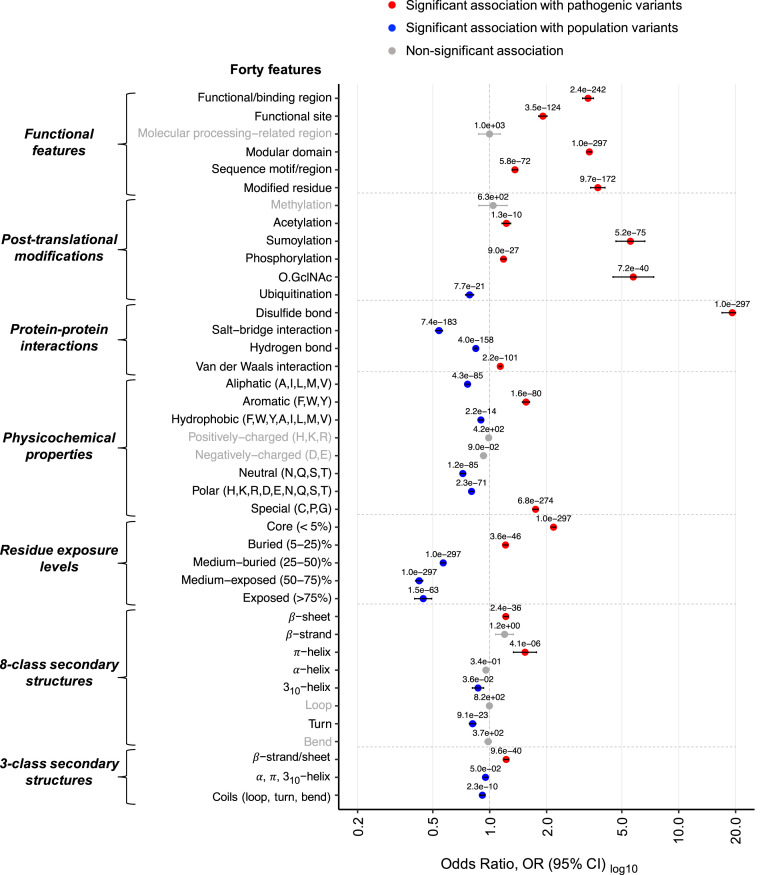
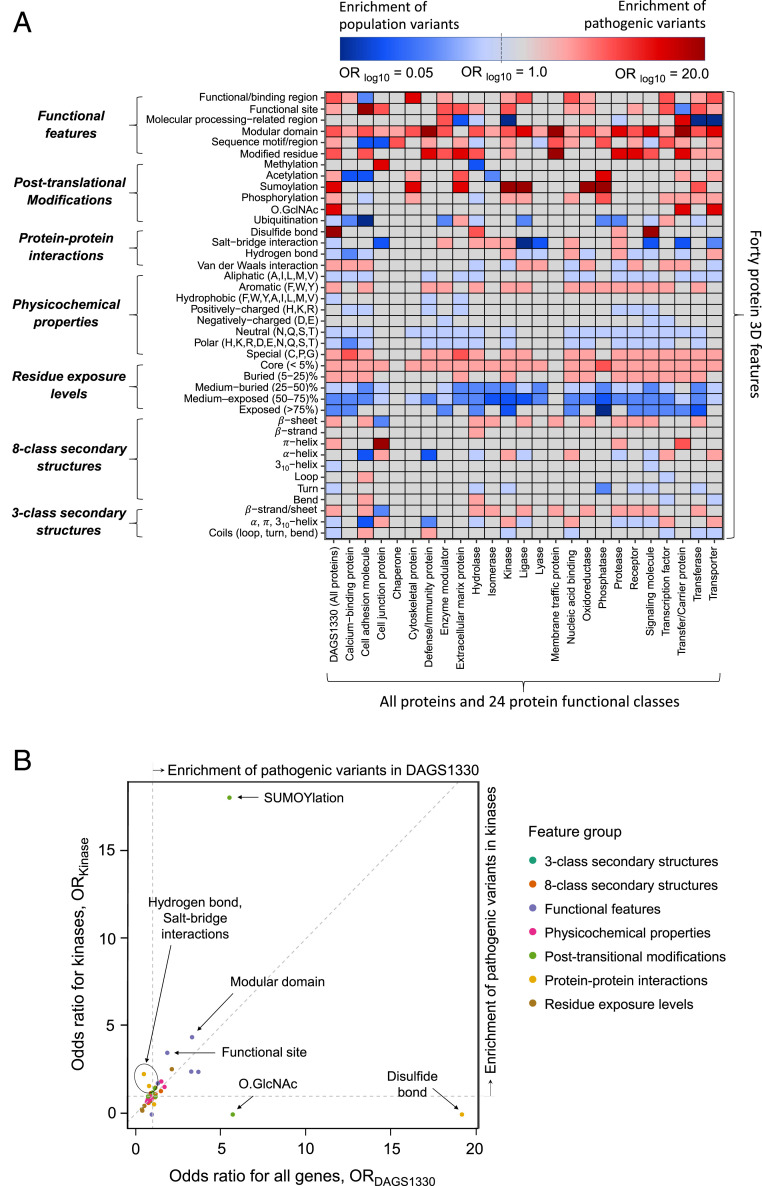
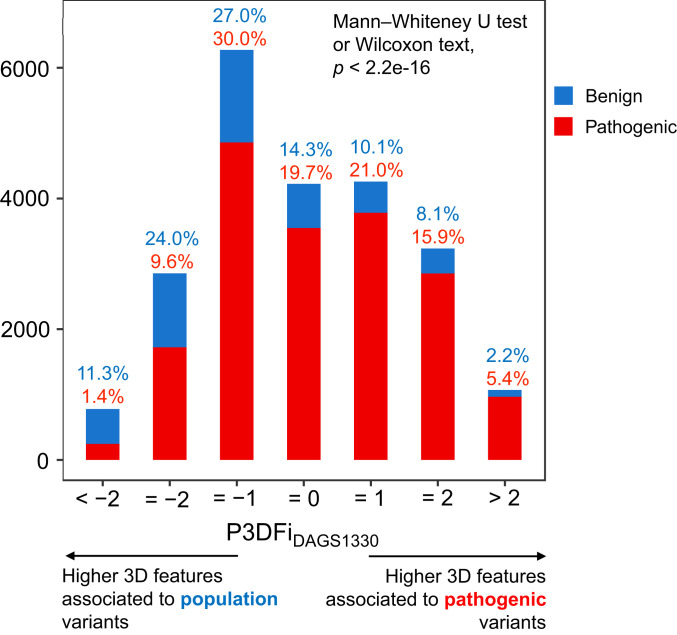
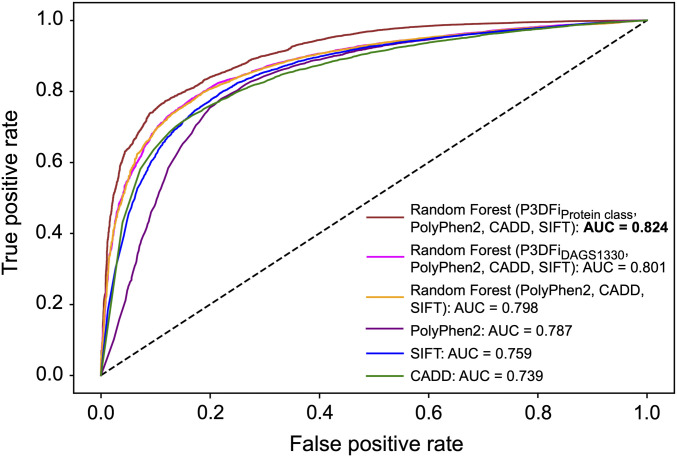
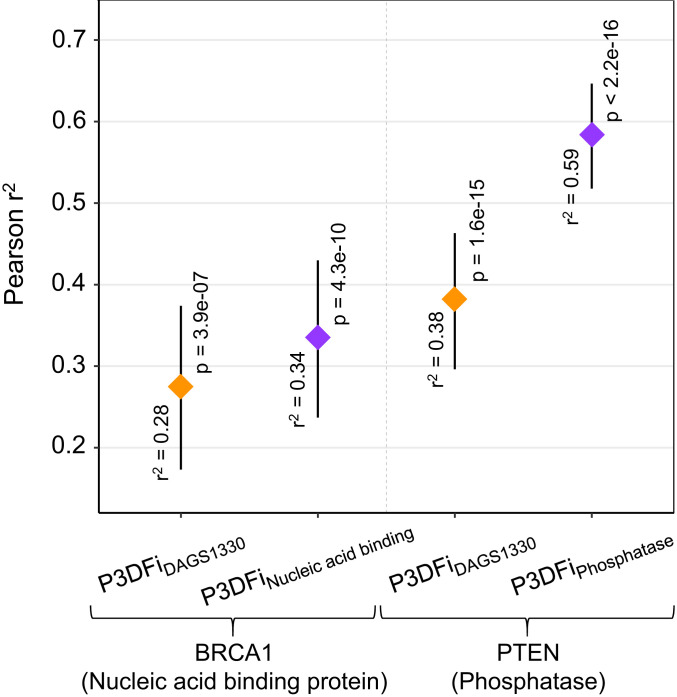
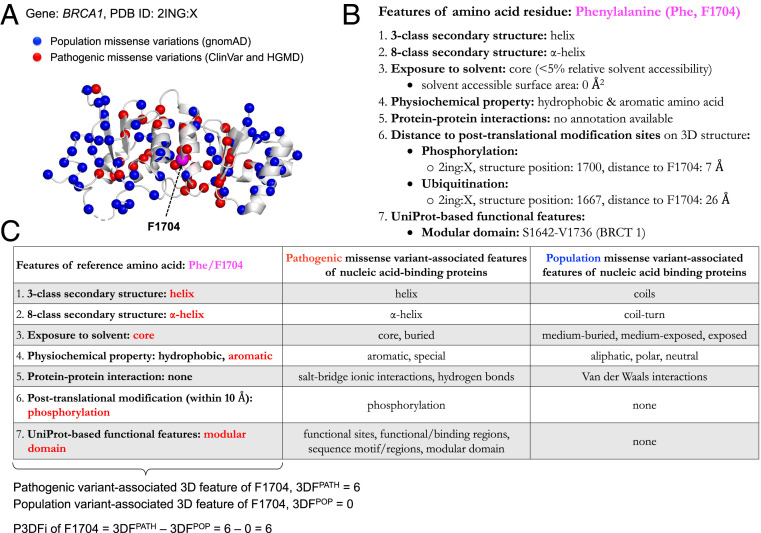
Interpretation of the colossal number of genetic variants identified from sequencing applications is one of the major bottlenecks in clinical genetics, with the inference of the effect of amino acid-substituting missense variations on protein structure and function being especially challenging. Here we characterize the three-dimensional (3D) amino acid positions affected in pathogenic and population variants from 1,330 disease-associated genes using over 14,000 experimentally solved human protein structures. By measuring the statistical burden of variations (i.e., point mutations) from all genes on 40 3D protein features, accounting for the structural, chemical, and functional context of the variations' positions, we identify features that are generally associated with pathogenic and population missense variants. We then perform the same amino acid-level analysis individually for 24 protein functional classes, which reveals unique characteristics of the positions of the altered amino acids: We observe up to 46% divergence of the class-specific features from the general characteristics obtained by the analysis on all genes, which is consistent with the structural diversity of essential regions across different protein classes. We demonstrate that the function-specific 3D features of the variants match the readouts of mutagenesis experiments for BRCA1 and PTEN, and positively correlate with an independent set of clinically interpreted pathogenic and benign missense variants. Finally, we make our results available through a web server to foster accessibility and downstream research. Our findings represent a crucial step toward translational genetics, from highlighting the impact of mutations on protein structure to rationalizing the variants' pathogenicity in terms of the perturbed molecular mechanisms.

Keywords: 3D mutational hotspot; disease variation effect; machine learning; missense variant interpretation; protein structure and function.


Conflict of interest statement

The authors declare no competing interest.

Figures

Fig. 1.
Fig. 1.
Illustration of the study design and objectives. Step 1: Dataset preparation and missense variant to protein structure mapping. Experimentally solved human protein structures are collected from the PDB (8) (in January 2018) and mapped to UniProt-defined canonical protein sequences using the SIFTS database (39). The missense variants are assembled from three databases: general population variants from gnomAD (public release 2.0.2), disease mutations from HGMD (professional release 2018.4 and 2019.2), and pathogenic and likely pathogenic variants from ClinVar (February 2018 and 2019 releases). Finally, the analysis is restricted to the 1,330 genes (DAGS1330 set) for which both population (n = 164,915) and pathogenic (n = 32,923) variations could be mapped on protein structures (n = 14,270). Step 2: Protein feature annotation. Forty protein features from seven main feature categories for the amino acid residues are collected from multiple databases, that is, DSSP (40) (version 3.0.2), PDBsum (41) (January 2018 update), PhosphoSitePlus (42) (February 2018 update), and UniProt (43) (release 2018_02). Step 3: Protein class annotation. The protein functional class annotations for genes are obtained from PANTHER (44) (release 13.1), Ensembl (version 93), and UniProt (43) (release 2018_02) databases. Step 4: Statistical analysis. Two-sided Fisher’s exact test is performed to identify the protein features that are significantly associated with pathogenic or population missense variations (after Bonferroni correction). The analysis is performed taking all variants in the DAGS1330 gene set, and then individually for groups of genes encoding proteins in 24 functional classes, to identify features of 3D mutational hotspots that are shared across all proteins as well as those that are unique to proteins performing a specific function.
Fig. 2.
Fig. 2.
Association of pathogenic and population missense variations with 40 3D features (a combination of structural, physicochemical, and functional features of amino acids on protein structure) for 1,330 disease-associated genes (DAGS1330 set). The plot shows the results of two-sided Fisher’s exact tests of association between 32,923 pathogenic and 164,915 population amino acid variations with the features. Circles show the OR and are labeled with the q values (the corrected p values; see Materials and Methods), showing the significance of the association (a value of 1.0e-297 should be read as <1.0e-297, indicating the maximum significance), and the horizontal bars show the 95% CI. The OR > 1 and OR < 1, along with q< 0.05, indicate that the corresponding feature (y axis) is enriched in pathogenic (red circle) and population (blue circle) variants, respectively. The vertical dashed line at OR = 1 indicates no association between a variant type (pathogenic or population) and a feature. To facilitate the visualization, minimum and maximum values of OR along the x axis are set to 0.2 and 20.0, respectively. For nonsignificant association (q 0.05), the circle, CI bar, and feature names are gray.
Fig. 3.
Fig. 3.
Some features of 3D mutational hotspots are conserved across different protein functional classes, whereas others are unique to specific classes. (A) Heatmap of ORs found from the burden analyses (two-sided Fisher’s exact test) on 40 3D features with pathogenic and population variants from all 1,330 disease-associated genes (full DAGS1330 dataset) and for subsets of genes grouped into 24 protein classes based on their molecular functions. To facilitate the visualization, minimum and maximum values of OR are set to 0.05 and 20.0, respectively. The red and the blue color gradients represent different degrees of association to pathogenic (1.0 < OR 20.0 and q< 0.05) and population (0.05 OR < 1.0 and q< 0.05) variants; darker color indicates stronger association. The gray cells in the heatmap represent features that are not significantly associated (q 0.05) with any variation type. Thus, the rows with only red or blue cells show the characteristic features of pathogenic or population variations that are consistent or conserved across all of the protein classes. In contrast, the rows with both red and blue cells indicate protein class-specific diverging features. (B) Scatter plot showing the correlation between the burden of pathogenic variations on different features for all genes along the x axis (ORDAGS1330) and for kinase protein class along the y axis (ORKinase). Each circle represents a protein feature (indicated by an arrow), and has a different color according to the seven main feature categories. The diagonal line represents the agreement between the burden values found for all genes and those for kinases. The features above the diagonal line and to the left of the vertical line are enriched with pathogenic variations in kinases (hydrogen bond and salt bridge interaction sites), but are depleted of pathogenic variations in the full DAGS1330 set. The features above the diagonal line and to the right of the vertical line have an elevated burden of pathogenic variations in kinases (y axis), indicating that these features are more intolerant to substitutions for this protein class compared to the general trend for all proteins (x axis). In contrast, the features below the diagonal line and the horizontal line are enriched with pathogenic variations in the DAGS1330 set (disulfide bond and O.GlcNAc), but are depleted of pathogenic variations in kinases.
Fig. 4.
Fig. 4.
Distribution of pathogenic 3D feature index (P3DFiDAGS1330) values in an independent set of 22,695 variants (17,983 pathogenic and 4,712 benign). The plot shows the count of pathogenic and benign variants (y axis) in different P3DFiDAGS1330 bins (x axis) for 1,286 genes of all protein classes. The bin labels report the fraction of pathogenic and benign variants in each bin out of the total pathogenic and benign variants. In the plot, the pathogenic and benign variants show opposing distribution trends in the positive and negative P3DFi values (Mann–Whitney U test or Wilcoxon test of significance, p< 2.2e-06).
Fig. 5.
Fig. 5.
Comparison of the receiver operating characteristic (ROC) curves. The curves are drawn using the scores generated by six methods (Table 1) in predicting 22,362 variants (17,983 pathogenic and 4,655 benign). The plot is further labeled with the area under the curve (AUC) values. The “Random forest” ensemble model trained on P3DFiProtein class (derived in this study), SIFT (11), PolyPhen2 (9), and CADD (48) scores provided the best AUC value of 0.824 (boldfaced).
Fig. 6.
Fig. 6.
Comparison of the saturation mutagenesis screening readouts and P3DFi values (derived in this study). The figure shows the output of Pearson’s product moment correlation tests between the mean fitness scores from the mutagenesis experiment per amino acid (to all possible substitutions) and both the P3DFiDAGS1330 and P3DFiProtein class values for two proteins: BRCA1 (50) and PTEN (51). The diamonds show the estimated correlation values (Pearson r2). Vertical bars show the 95% CIs and are labeled with the significance (p values) of the test result. The correlation between experimental outputs measuring the functional consequence of mutations and the protein function-specific P3DFi (P3DFiPhosphatase for PTEN and P3DFiNucleic acid binding for BRCA1) are higher than that of the P3DFiDAGS1330 values for both proteins. These results illustrate that 3D features specific to the protein function can provide a substantial advantage in correctly interpreting the consequences of missense variations.
Fig. 7.
Fig. 7.
Protein features of missense variations on 3D structure provide intuitive insights into the effect of amino acid substitutions. (A) Structure (PDB ID code 2ING, chain: X) of BRCA1 with pathogenic (red) and population (blue) variations mapped, with an additional phenylalanine (Phe/F) at position 1704 (F1704) highlighted in pink for further analysis in this overview. (B) The 3D feature annotations for F1704. (C) Comparison of features of F1704 with protein class-specific 3D features associated to pathogenic and population variants (BRCA1 is annotated as a nucleic acid binding protein). A feature is highlighted in red if it matches a pathogenic variant-associated feature, or in blue if it matches a population variant-associated feature. In this example, F1704 possesses six pathogenic (3DFPATH) and zero population (3DFPOP) variant-associated 3D features. Thus, for F1704, P3DFiNucleic acid binding is equal to 6 – 0 = 6 (a positive P3DFi value represents a 3D mutational hotspot).

References

    1. Glusman G., Clinical applications of sequencing take center stage. Genome Biol. 14, 303 (2013). - PMC - PubMed
    1. Dugger S. A., Platt A., Goldstein D. B., Drug development in the era of precision medicine. Nat. Rev. Drug Discov. 17, 183–196 (2018). - PMC - PubMed
    1. Lek M., et al. , Analysis of protein-coding genetic variation in 60,706 humans. Nature 536, 285–291 (2016). - PMC - PubMed
    1. McKusick V. A., Mendelian inheritance in man and its online version, OMIM. Am. J. Hum. Genet. 80, 588–604 (2007). - PMC - PubMed
    1. Stenson P. D., et al. , The human gene mutation database: Building a comprehensive mutation repository for clinical and molecular genetics, diagnostic testing and personalized genomic medicine. Hum. Genet. 133, 1–9 (2014). - PMC - PubMed

Publication types