. 2020 Oct 26;11(1):5386.
doi: 10.1038/s41467-020-19167-0.

Over-activation of primate subgenual cingulate cortex enhances the cardiovascular, behavioral and neural responses to threat

Affiliations

Over-activation of primate subgenual cingulate cortex enhances the cardiovascular, behavioral and neural responses to threat

Laith Alexander et al. Nat Commun. .

Abstract

Stress-related disorders such as depression and anxiety are characterized by enhanced negative emotion and physiological dysfunction. Whilst elevated activity within area 25 of the subgenual anterior cingulate cortex (sgACC/25) has been implicated in these illnesses, it is unknown whether this over-activity is causal. By combining targeted intracerebral microinfusions with cardiovascular and behavioral monitoring in marmosets, we show that over-activation of sgACC/25 reduces vagal tone and heart rate variability, alters cortisol dynamics during stress and heightens reactivity to proximal and distal threat. 18F-FDG PET imaging shows these changes are accompanied by altered activity within a network of brain regions including the amygdala, hypothalamus and dorsolateral prefrontal cortex. Ketamine, shown to have rapid antidepressant effects, fails to reverse elevated arousal to distal threat contrary to the beneficial effects we have previously demonstrated on over-activation induced reward blunting, illustrating the symptom-specificity of its actions.


Conflict of interest statement

The authors declare no competing interests.

Figures

Fig. 1
Fig. 1. Experimental timeline, task overview, and histological assessment of cannula placements.
a Experimental timeline. All marmosets (n = 7) were first habituated to the testing apparatus so the context became affectively neutral, after which sgACC/25 infusions were carried out in this neutral condition to assess basal cardiovascular changes. Next, marmosets underwent infusions on the conditioned threat and extinction (n = 4) and aversive Pavlovian discriminative conditioning (n = 7) paradigms (see Table 1 for details). Human intruder (HI) testing (n = 7) was interleaved with aversive discrimination testing. Finally, four marmosets underwent 18F-FDG PET scanning. b In the neutral condition, no CSs were presented. c In the Pavlovian conditioned threat and extinction paradigm, habituation occured over the first two days; learning of the CS (auditory cue)-US (rubber snake) association occurred over the third acquisition day; and on the subsequent extinction and extinction-recall days (days four and five), the cue was presented without the snake. d In the aversive Pavlovian discriminative conditioning paradigm, marmosets learned to distinguish between a threatening auditory cue (CS+) predicting aversive white noise and darkness (US+), and a safety auditory cue (CS−) predicting a neutral tone (US−). e Histological assessment of cannula placement using cresyl-violet staining. No damage was noted in any animals aside from the small area of gliosis used to pinpoint cannula placement. A schematic diagram, left, shows the cannula placement for all marmosets reported in the manuscript (anteroposterior [AP] extent between +12.5 and +13.8 mm from interaural line, diagram centered around +13.0mm) together with the estimated spread of infusion in gray (0.5–1.0mm). A representative cresyl-violet stained histological section is shown right, with the cannulation site indicated by an arrow.
Fig. 2
Fig. 2. sgACC/25 over-activation shifts the sympathetic-to-parasympathetic balance, increasing heart rate and reducing heart rate variability.
Gray = control, orange = over-activation. Shading and error bars represent SEM. n = 7 except cortisol where n = 3. a sgACC/25 over-activation had no effect on blood pressure (mean arterial pressure, MAP) measured across the session (two-tailed paired t-test, p = 0.626). b sgACC/25 over-activation significantly increased heart rate (HR) measured across the session (two-tailed paired t-test, p < 0.001, d = 2.27). c Analysis of second-by-second heart rate values highlighted a systematic increase across the entire session (linear mixed-model, manipulation × time, F < 1, p = 0.999; main effect of manipulation, F1,5899 = 3448, p < 0.001, d = 2.02). d sgACC/25 over-activation reduced heart rate variability (HRV) as measured by the root mean square differences of successive R-R intervals (RMSSD; two-tailed paired t-test, p = 0.001, d = 2.20). e Fractionating HRV into cardiac sympathetic (CSI) and cardiac vagal (CVI) indices revealed sgACC/25 over-activation shifted sympathetic/parasympathetic balance towards sympathetic predominance (two-tailed paired t-test, p = 0.004, d = 1.69). f sgACC/25 over-activation significantly decreased CVI (two-tailed paired t-test, p = 0.011, d = 1.38) and g significantly increased CSI (two-tailed paired t-test, p = 0.032, d = 1.07). h Cortisol levels did not change from before to after the habituation session (mean ± SEM ratio: control 0.937 ± 0.159, over-activation 0.951 ± 0.080) and did not differ between control and over-activation conditions (two-tailed paired t-test, p = 0.960). Source data are provided as a Source Data file.
Fig. 3
Fig. 3. sgACC/25 over-activation elevates threat-related arousal during threat extinction and extinction-recall.
Gray = control, orange = over-activation. Shading and error bars represent SEM. Infusions took place prior to extinction sessions, indicated by arrows above figures (a, b). n = 4. a During acquisition sessions, animals increased their vigilant scanning (VS) response from the pre-snake to post-snake phase in both the “to be saline” and “to-be overactivation” blocks (two-way repeated measures ANOVA, manipulation × phase, F1,3 = 1.4, p = 0.317; main effect of phase, F1,3 = 36.5, p = 0.009, η2 = 0.777). sgACC/25 over-activation blocked behavioral extinction (two-way repeated measures ANOVA, manipulation ×  CS pair, F4,12 = 3.6, p = 0.039, η2 = 0.087) with significant differences in scanning responses evident during the second (Sidak’s test, p = 0.039, d = 1.86), third (p = 0.007, d = 2.04) and fifth (p = 0.023, d = 1.05) CS pairs, but not the first (p = 0.974) or fourth (p = 0.0602). These effects persisted to the next day with sgACC/25 over-activation elevating VS across extinction recall (two-way repeated measures ANOVA, manipulation × CS pair, F4,12 = 4.0, p = 0.027, η2 = 0.039) evident across all CS pairs (Sidak’s test, first p < 0.001, d = 2.55; second p < 0.001, d = 1.39; third p < 0.001, d = 1.22; fourth p = 0.003, d = 1.08; fifth p = 0.026, d = 0.83). b Equally, the blood pressure (MAP) increase during acquisition was not different in the “to be saline” vs. “to be overactivation” blocks (two-way repeated measures ANOVA, manipulation × phase, F < 1, p = 0.695; main effect of phase, F1,3 = 44.5, p = 0.007, η2 = 0.503). sgACC/25 over-activation did not alter the rate of blood pressure extinction (two-way repeated measures ANOVA, manipulation × CS pair, F < 1, p = 0.668; main effect of CS pair, F4,12 = 16.0, p < 0.001, η2 = 0.069) but did elevate blood pressure responses across all CS pairs (two-way repeated measures ANOVA, main effect of manipulation, F1,3 = 11.8, p = 0.042, η2 = 0.180). Marmosets continued to extinguish their blood pressure responding during extinction recall (two-way repeated measures ANOVA, main effect of CS pair, F4,12 = 4.2, p = 0.023, η2 = 0.113) and again there was a systematic elevation in blood pressure responses following over-activation (two-way repeated measures ANOVA, main effect of infusion, F1,3 = 39.1, p = 0.008, η2 = 0.562). c Plotting second-by-second blood pressure values for all four animals during extinction revealed an increase across the entire session, not restricted to CS periods (linear mixed-model, manipulation ×  time, F < 1, p = 0.999; main effect of manipulation, F1,5330 = 1897, p < 0.001, d = 1.17). d Three out of four animals showed increased scanning during the baseline periods of the extinction session following over-activation, suggestive of a behavioral generalization response, but the increase was not significant (two-tailed paired t-test, p = 0.182). e A systematic elevation in blood pressure values was also evident for all four animals across the extinction recall session (linear mixed-model, manipulation ×  time, F < 1, p = 0.999; main effect of manipulation, F1,6547 = 720, p < 0.001, d = 1.34). f Again, three out of four animals also showed elevated baseline scanning following over-activation in the extinction recall session, but this change was not significant (two-tailed paired t-test, p = 0.087). Source data are provided as a Source Data file.
Fig. 4
Fig. 4. Intact discrimination between threat and safety cues, but elevated baseline responding and slowed stress recovery, following sgACC/25 over-activation.
Gray = control, orange = over-activation. Shading and error bars represent SEM. BL indicates baseline (20s pre-CS). n = 7. a sgACC/25 over-activation did not alter behavioral discrimination between safety (CS-1 and CS-2) cues and a threatening (CS+) cue (two-way repeated measures ANOVA, manipulation × CS, F < 1, p = 0.647; main effect of CS type, F2,12 = 32.3, p < 0.001, η2 = 0.619). b There was a trend towards flattening of the blood pressure (MAP) discrimination between safety cues and a threatening cue following over-activation (two-way repeated measures ANOVA, manipulation × CS, F2,12 = 3.8, p = 0.054; main effect of CS type, F2,12 = 19.5, p < 0.001, η2 = 0.382). c sgACC/25 over-activation elevated baseline VS (two-way repeated measures ANOVA, manipulation × CS, F < 1, p = 0.909; main effect of manipulation, F1,6 = 8.4, p = 0.027, η2 = 0.307). d sgACC/25 over-activation also elevated baseline blood pressure (two-way repeated measures ANOVA, manipulation × CS, F2,12 = 2.5, p = 0.124; main effect of manipulation, F1,6 = 22.7, p = 0.003, η2 = 0.062). e Trace showing mean blood pressure responses during the baseline, CS, US and recovery (R) phases of the CS+ trial. The recovery period was defined as the 10s period following termination of the US+. sgACC/25 over-activation slowed the decline in blood pressure (measured as a ratio of the blood pressure to the final second of the US+, inset; two-way repeated measures ANOVA, manipulation × time, F9,54 = 3.0, p = 0.005, η2 = 0.049). Source data are provided as a Source Data file.
Fig. 5
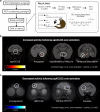
Fig. 5. Circuit-wide changes associated with sgACC/25 over-activation revealed with 18F-FDG PET imaging.
a Four marmosets had a subcutaneous port implanted into the jugular vein and were trained on a lengthened version of the aversive Pavlovian discriminative conditioning test in preparation for scanning. Saline (control) and DHK (over-activation) scans were counterbalanced. On the day of the scan (inset), animals were infused with saline or DHK and immediately injected with 18F-FDG ligand through the port. The conditioning session lasted 30 min to increase sensitivity of the ligand to perturbations in brain activity caused by the paradigm. On the day of scans, this consisted of four CS+/US+ pairings, two CS−/US− pairings and two “probe” trials of a CS+ alone to limit aversive US exposures. These were presented in a fixed order indicated on the timeline. b Contrast images calculated from standardized uptake value ratio (SUVR) maps of over-activation—control scans, showing brain regions with increased activity following over-activation. These included sgACC/25, the amygdala, the ventromedial (VMH) and lateral (LH) hypothalamic nuclei and temporal association area TH (p < 0.005, uncorrected). c Contrast images calculated from SUVR maps of control—over-activation scans, showing brain regions with reduced activity following over-activation. These included frontopolar cortex/9, dorsolateral prefrontal cortex (dlPFC)/46, central orbitofrontal cortex (OFC)/13 and the lateral caudate (p < 0.005, uncorrected). Source data are available from the corresponding author upon request.
Fig. 6
Fig. 6. Ketamine does not reverse heightened anxiety-like behavior induced by sgACC/25 over-activation on the Human Intruder (HI) test.
Gray = control, orange = over-activation. Error bars represent SEM. n = 7. a All seven animals had three HI testing sessions. The first two sessions were counterbalanced, consisting of a control (saline) infusion or over-activation using DHK. The final session consisted of over-activation 24 h following ketamine administration. In the test, marmosets are divided into a quadrant of their cage and are confronted with a novel intruder who maintains eye contact for 2 min. Marmosets display a range of behaviors including vocalizations (tsik, tsik egg, tse egg, and egg calls), bobbing (rapid side-to-side movements of head and body), and locomotion. b These behaviors—together with average height, the time spent at the back of the cage (TSAB), and the time spent at the front of the cage (TSAF)—are loaded onto a single EFA-extracted factor representing anxiety-like behavior, with weightings shown above the arrows. c Replicating a previous finding from our group, sgACC/25 over-activation alone resulted in a significant increase in anxiety-like factor scores (one-way repeated measures ANOVA, effect of manipulation, F1.6,9.7 = 13.3, p = 0.002, η2 = 0.138; control vs. over-activation, p = 0.003, d = 2.23). This effect was not reversed by ketamine (Sidak’s test, over-activation vs. over-activation + ketamine, p = 0.973): compared to control conditions, sgACC/25 over-activation following ketamine administration still resulted in elevated factor scores (Sidak’s test, control vs. over-activation + ketamine, p = 0.020, d = 1.54). Source data are provided as a Source Data file.

Comment in

  • Heightening the threat.
    Yates D. Yates D. Nat Rev Neurosci. 2021 Jan;22(1):4-5. doi: 10.1038/s41583-020-00417-5. Nat Rev Neurosci. 2021. PMID: 33262476 No abstract available.

References

    1. Drevets WC, Savitz J, Trimble M. The subgenual anterior cingulate cortex in mood disorders. CNS Spectr. 2008;13:663–681. doi: 10.1017/S1092852900013754. - DOI - PMC - PubMed
    1. Hamilton JP, et al. Default-mode and task-positive network activity in major depressive disorder: implications for adaptive and maladaptive rumination. Biol. Psychiatry. 2011;70:327–333. doi: 10.1016/j.biopsych.2011.02.003. - DOI - PMC - PubMed
    1. Harrison NA, et al. Inflammation causes mood changes through alterations in subgenual cingulate activity and mesolimbic connectivity. Biol. Psychiatry. 2009;66:407–414. doi: 10.1016/j.biopsych.2009.03.015. - DOI - PMC - PubMed
    1. Mayberg HS. Limbic-cortical dysregulation: a proposed model of depression. J. Neuropsychiatry Clin. Neurosci. 1997;9:471–481. doi: 10.1176/jnp.9.3.471. - DOI - PubMed
    1. Mayberg HS, et al. Deep brain stimulation for treatment-resistant depression. Neuron. 2005;45:651–660. doi: 10.1016/j.neuron.2005.02.014. - DOI - PubMed

Publication types