. 2020 Oct 26;11(1):5406.
doi: 10.1038/s41467-020-18961-0.

T cell-intrinsic role for Nod2 in protection against Th17-mediated uveitis

Affiliations

T cell-intrinsic role for Nod2 in protection against Th17-mediated uveitis

Ruth J Napier et al. Nat Commun. .

Abstract

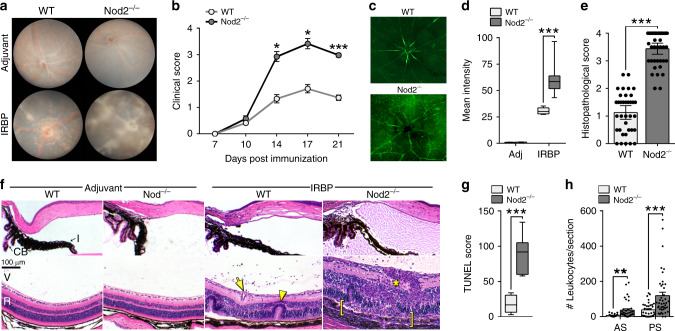
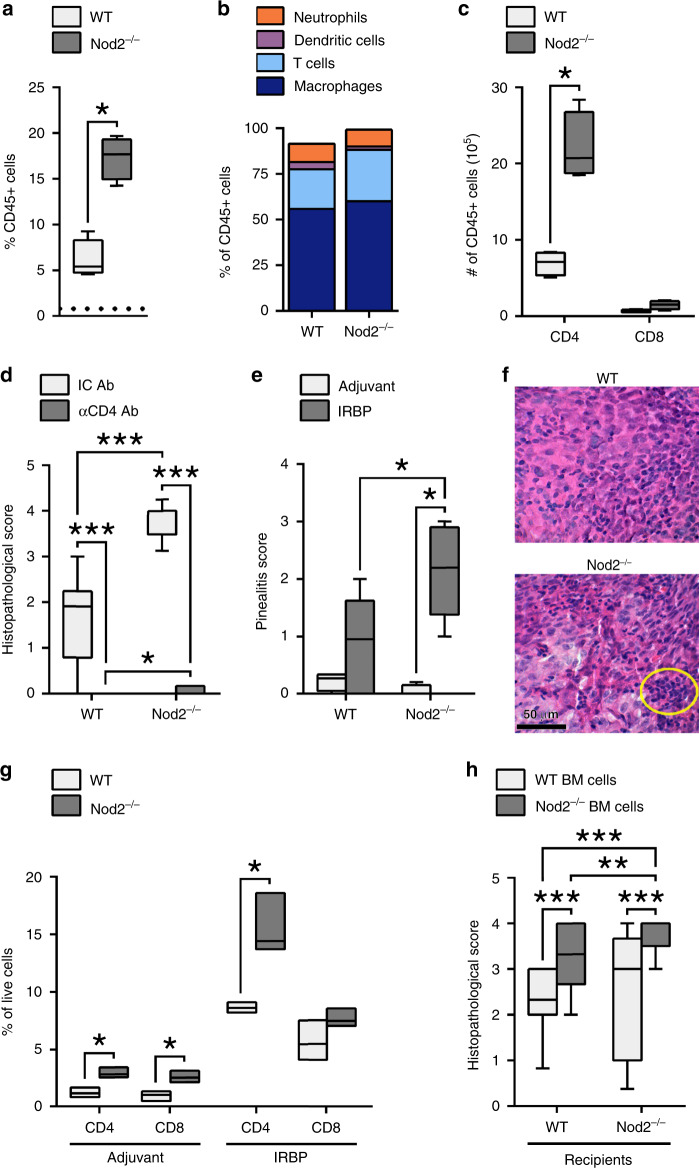
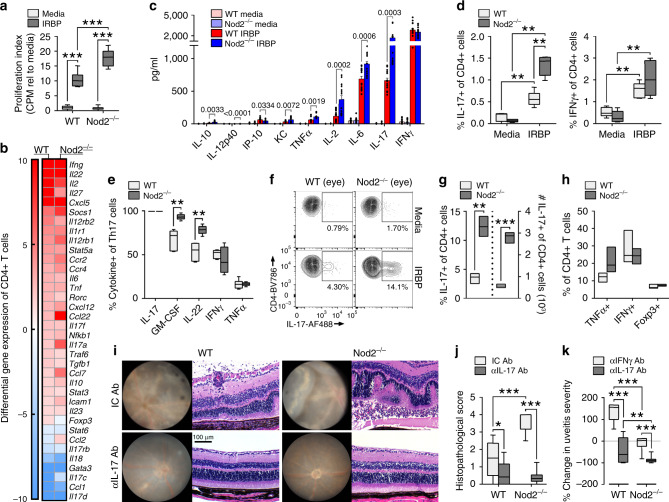
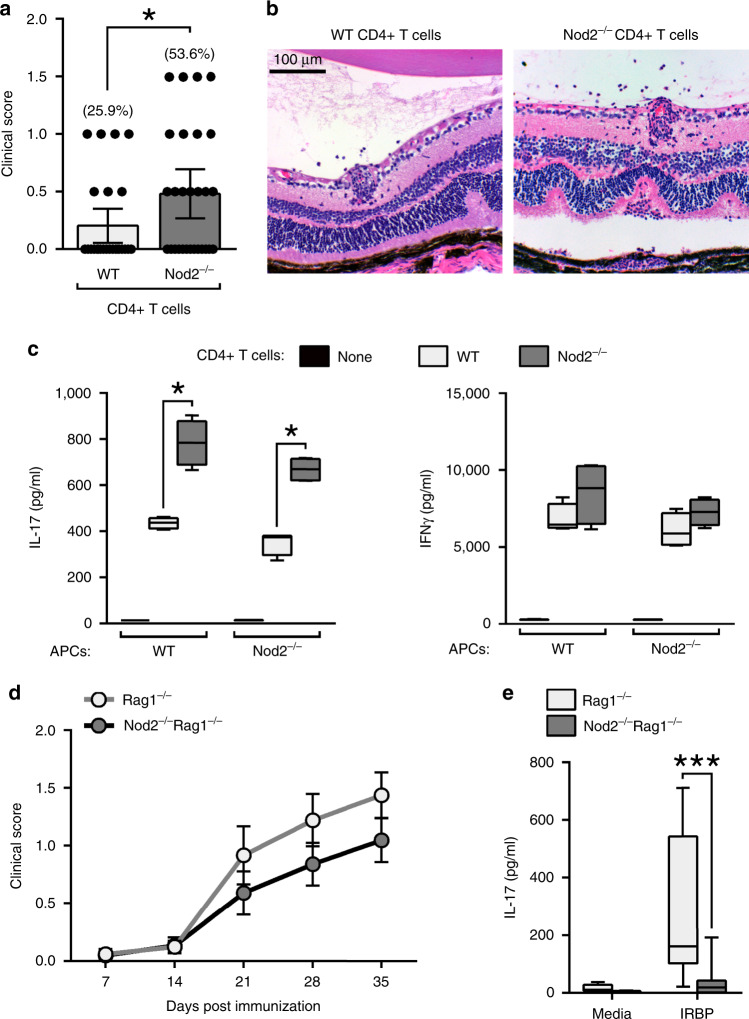
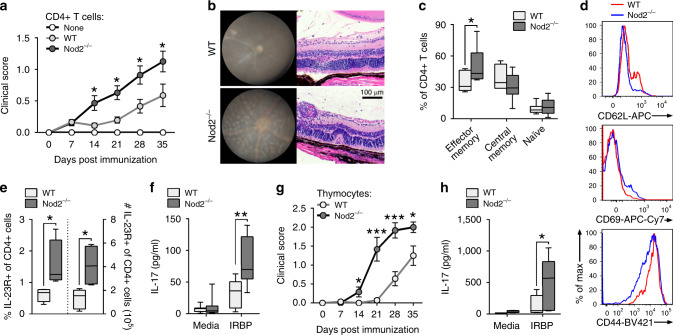
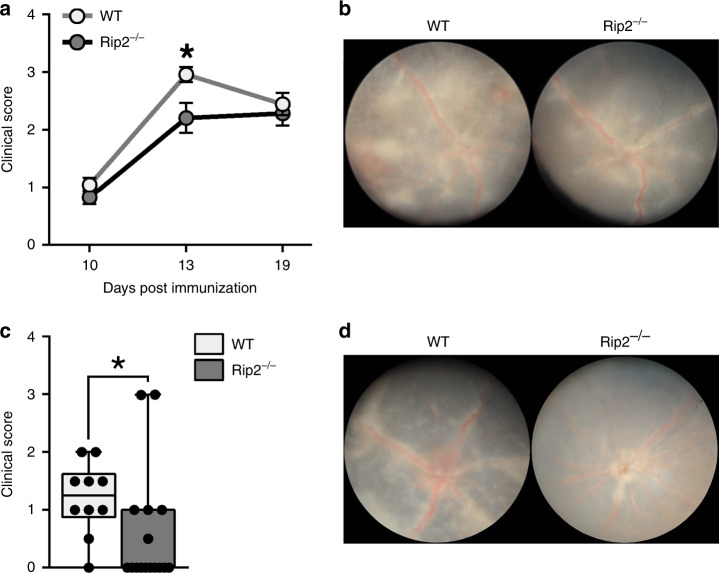
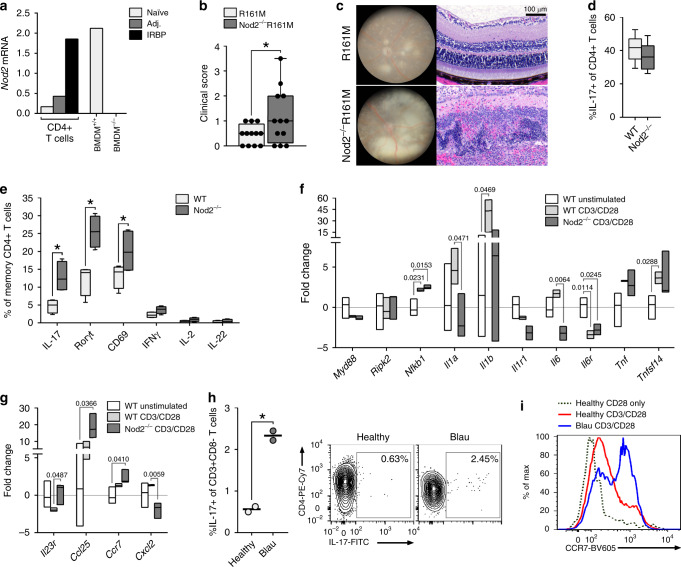
Mutations in nucleotide-binding oligomerization domain-containing protein 2 (NOD2) cause Blau syndrome, an inflammatory disorder characterized by uveitis. The antimicrobial functions of Nod2 are well-established, yet the cellular mechanisms by which dysregulated Nod2 causes uveitis remain unknown. Here, we report a non-conventional, T cell-intrinsic function for Nod2 in suppression of Th17 immunity and experimental uveitis. Reconstitution of lymphopenic hosts with Nod2-/- CD4+ T cells or retina-specific autoreactive CD4+ T cells lacking Nod2 reveals a T cell-autonomous, Rip2-independent mechanism for Nod2 in uveitis. In naive animals, Nod2 operates downstream of TCR ligation to suppress activation of memory CD4+ T cells that associate with an autoreactive-like profile involving IL-17 and Ccr7. Interestingly, CD4+ T cells from two Blau syndrome patients show elevated IL-17 and increased CCR7. Our data define Nod2 as a T cell-intrinsic rheostat of Th17 immunity, and open new avenues for T cell-based therapies for Nod2-associated disorders such as Blau syndrome.


Conflict of interest statement

The authors declare no competing interests.

Figures

Fig. 1
Fig. 1. Nod2 plays an unexpected protective role in uveitis.
Six to ten week old WT and Nod2−/− mice were immunized and assessed weekly thereafter for disease. a Representative fundus images of the posterior pole at day 21 post-immunization, and (b) clinical grading of uveitis based on fundoscopy. Data in b is combined from 6 independent experiments with an n = 12 mice/group for day 7 and day 17, n = 24 (WT) and 19 (Nod2−/−) mice/group for day 10, n = 44 (WT) and 28 (Nod2−/−) mice/group for day 14, and n = 56 (WT) and 54 (Nod2−/−) day 21; *p = 0.0177 (14 day), *p = 0.0093 (day 17), and ***p < 0.0001 (day 21). c Representative epifluorescence images and (d) quantification of blood-retinal barrier integrity 10 days post-immunization. Data is combined from 2 independent experiments where n = 9 (WT adjuvant and Nod2−/− IRBP) or 8 (WT IRBP and Nod2−/− adjuvant) mice; ***p < 0.0001. e Uveitis was scored by histopathology 21 days post-immunization. Data was combined from 6 independent experiments where n = 38 (WT) and 39 (Nod2−/−) mice; ***p < 0.0001. f Representative H&E-stained sections of the anterior segment (top) and posterior segment (bottom) of eyes day 21 post immunization. Pathological features indicated: retinal folding (arrowhead), granulomatous formation (asterisk), vasculitis (arrow), and severe photoreceptor damage (bracket). I, iris; CB, ciliary body; V, vitreous; R, retina. g Apoptosis within the retina (14 days post immunization) was determined by a TUNEL-based assay. Data was combined from 2 independent experiments where n = 8 (WT) and 7 (Nod2−/−) mice; ***p = 0.0003. h Leukocyte infiltration in the aqueous of the anterior segment (AS) and vitreous of the posterior segment (PS) were enumerated. Data are combined from 6 independent experiments where n = 35 (WT AS, WT PS), 39 (Nod2−/−AS), 42 (Nod2−/− PS) mice; **p = 0.0011 (AS) and ***p = 0.0005 (PS). Data are mean ± SEM (b, e, h) with dots representing individual values (e, h) or box-whisker plots with median, 25–75th percentile and min–max range (d, g). Source data are provided as a Source Data file.
Fig. 2
Fig. 2. Nod2 influences retinal antigen-specific cellular responses.
a The proportion of ocular CD45+ cells of WT and Nod2−/− mice 20 days post-immunization was determined by flow cytometry. Dashed line denotes baseline level for adjuvant control eyes. b Frequency of macrophages (CD45+CD11b+F4/80+), neutrophils (CD45+CD11b+GR-1+), dendritic cells (CD45+CD11c+), and T cells (CD45+CD3+CD4+) are summarized as stacked bars. c Live T cell populations of gated CD45+ cells. Data (ac) are representative of 4 independent experiments each with n = 4 mice/group; *p = 0.0286 (a, c). d Uveitis was evaluated in immunized WT or Nod2−/− mice that were depleted of CD4+ T cells with α-CD4 mAb or Isotype control Ab (IC Ab). Data are representative of 2 independent experiments with n = 12 mice/group; ***p < 0.0001 (WT IC vs. WT Ab, Nod2−/− IC vs. Nod2−/− Ab, WT IC vs. Nod2−/− IC), and *p = 0.0373 (WT Ab vs. Nod2−/− Ab). eg Pinealitis was assessed in WT and Nod2−/− mice 14 days post-immunization. e Pinealitis scores from histopathological evaluation, and (f) representative H&E-stained sections (circle denotes dense lymphocytic infiltration). Scores in e were combined from 2 independent experiments (shown left to right with n = 4, 6, 4, 5); *p = 0.0433 (WT IRBP vs. Nod2−/− IRBP), *p = 0.0159 (Nod2−/− adjuvant vs. Nod2−/− IRBP). g Frequency of CD4+ and CD8+ T cells in pineal glands was determined by flow cytometry. Data are combined from 3 independent experiments, each having 5 pooled pineal glands/genotype/treatment. For CD4+ cells: *p = 0.0111 (WT IRBP vs. Nod2−/− IRBP) and *p = 0.0081 (WT adjuvant vs. Nod2−/− adjuvant). For CD8+ cells: *p = 0.0122 (WT adjuvant vs. Nod2−/− adjuvant). h BM chimeric mice were assessed for EAU by histopathology 20 days post-immunization. Data are combined from 3 independent experiments (shown left to right with n = 31,31,30,28); **p = 0.0030 and ***p < 0.0001. Data are box-whisker plots showing median, 25th–75th percentile and min–max range (a, c–e, h), floating bars showing median with min–max range (g), or mean (b). Data were analyzed with two-tailed Mann–Whitney U test (ae, h) or unpaired, two-tailed Student’s t-test (g). Source data are provided as a Source Data file.
Fig. 3
Fig. 3. Nod2 negatively regulates hyper-pathogenic Th17 cells.
Splenocytes from immunized WT and Nod2−/− mice were stimulated in vitro with IRBP1–20 (ae). a [3H] thymidine incorporation after 72 h. Data are combined from 3 independent experiments, n = 12 mice/group; ***p < 0.0001. b Gene expression of CD4+ T cells 18 h was assessed by qPCR. Heatmap indicates expression relative to IRBP1–20-stimulated CD4+ T cells from adjuvant-control mice. c Cytokine production after 48 h was assessed by ELISA. Data are combined from 4 independent experiments, n = 16 mice/group. d Frequencies of IL-17+ or IFNγ+ of CD4+Thy1.2+ T cells was determined by flow cytometry. Data are combined from 2 independent experiments, n = 5 (unstimulated) or 6 (IRPB-stimulated) mice/group. IL-17: **p = 0.0043 (WT unstimulated vs. WT peptide, Nod2−/− unstimulated vs. Nod2−/− peptide), **p = 0.0022 (WT peptide vs. Nod2−/− peptide). IFNγ: **p = 0.0043 (WT unstimulated vs. WT peptide), **p = 0.0025 (Nod2−/− unstimulated vs. Nod2−/− peptide). e Proportion of Th17 cells (IL-17+CD4+Thy1.2+) co-producing cytokines. Data are combined from 2 independent experiments, n = 6 mice/group; **p = 0.0022. fh Ocular cells from immunized mice were stimulated in vitro with IRBP1–20 for 18 h. Data are combined from 3 independent experiments, n = 6 mice pooled/genotype. f Representative contour plot showing IL-17+CD4+ T cells. g IL-17+ cells from gated live CD4+Thy1.2+ T cells. **p = 0.0013 (%), ***p = 0.0001 (#). h CD4+Thy1.2+ T cells co-expressing TNFα, IFNγ, or Foxp3. ik The effect of cytokine neutralization on uveitis was evaluated clinically and histopathologically 21 days post-immunization. Data are combined from 3 independent experiments, n = 18 (WT IC, WT αIL-17), 19 (WT αIFNγ, Nod2−/− IC), 17 (Nod2−/− αIL-1, or 23 (Nod2−/− αIFNγ) mice. i Representative images of fundi and H&E-stained retinal sections 21 days post-immunization. j Uveitis scores from histopathology. *p = 0.0095 (WT IC vs. WT IL-17 Ab), ***p < 0.0001 (Nod2−/− IC vs. Nod2−/− IL-17 Ab, WT IC vs. Nod2−/− IC). k Uveitis scores (from j) were normalized to the IC Ab group within each genotype (baseline = 0); **p = 0.0035, ***p < 0.0001. Data are box-whisker plots showing median with 25th–75th percentile and min–max range (a, de, j, k), floating bars showing median with min–max range (g, h), or mean ± SEM (dots represent individual values) (c). Data were analyzed by two-tailed Mann–Whitney U test (a, de, h, j) or unpaired, two-tailed Student’s t-test (c, g, k). Source data are provided as a Source Data file.
Fig. 4
Fig. 4. Nod2 suppresses uveitis through a non-conventional cellular mechanism.
ab CD4+ T cells from IRBP-immunized donor WT or Nod2−/− mice were adoptively transferred into naïve WT recipients. a Clinical uveitis scores and incidence 20 days post-transfer. Data are from 6 independent experiments with n = 27 (WT) and 28 (Nod2−/−) mice; *p = 0.0336. b Representative photos of WT recipients of WT or Nod2−/− CD4+ T cells 20 days post-transfer. c IL-17 and IFN-γ were measured by ELISA following 18 h stimulation with IRBP1–20 (20 µg/ml) of co-cultured APCs (isolated from naïve WT or Nod2−/− mice) and CD4+ T cells (isolated from WT or Nod2−/− immunized mice). Control APCs without the addition of T cells (“none”) were stimulated with IRBP. Data are combined from 4 independent experiments. For each experiment, APCs or T cell populations were isolated from n = 3 pooled mice/genotype; *p = 0.0286 for comparisons with both APC conditions. de Rag1−/− or Nod2−/−Rag1−/−mice were reconstituted with WT CD4+ T cells and immunized with IRBP 24 h later. d Clinical uveitis was evaluated weekly. Data is combined from 3 independent experiments. For Rag1−/− recipients n = 16 (7 days), 20 (14 days), 18 (21 and 28 days), 16 (35 days). For Nod2−/−Rag1−/− recipients n = 20 (7 days), 22 (14, 21, and 28 days), 20 (35 days). e Splenocytes were stimulated 18 h in vitro with IRBP1–20 and IL-17 in culture supernatants was measured by ELISA. Data are combined from 3 independent experiments with n = 12 (Rag1−/− media), 18 (Nod2−/−Rag1−/− media), 13 (Rag1−/− IRBP), 15 (Nod2−/−Rag1−/− IRBP) mice; ***p = 0.0001. Data are mean ± SEM (a, d) with dots representing individual values (a) or box-whisker plots with median, 25–75th percentile and min–max range (c, e). Statistical differences between groups were calculated using unpaired, two tailed Student’s t-test (a), two-tailed Mann–Whitney U test (c, d, e). Source data are provided as a Source Data file.
Fig. 5
Fig. 5. Nod2 inhibition of Th17-mediated uveitis is T cell-intrinsic.
Rag1−/− mice were reconstituted with CD4+ T cells from naïve WT or Nod2−/− mice and immunized 1 day later (af). a Clinical uveitis was evaluated weekly by fundoscopy after immunization. Data is combined from 6 independent experiments and (from left to right), n = 43, 40, 38, 24, 17 (WT) and n = 30, 46, 46, 28, 12 (Nod2−/−) mice; *p = 0.0275 (14 day), *p = 0.0160 (21 day), *p = 0.0216 (28 day), *p = 0.0232 (35 day). b Images of fundus and H&E-stained retinal sections 35 days post-immunization. Splenocytes harvested 35 days post-immunization were analyzed by flow cytometry (ce) or ELISA (f). c Frequencies of effector memory (CD62LloCD44mid), central memory (CD62LloCD44hi), and naïve CD4+ T cells (CD62LhiCD44lo). Data are combined from 2 independent experiments for n = 7 (WT) and 9 (Nod2−/−); *p = 0.0418. d Cell surface expression of CD62L, CD69, and CD44 on CD4+ T cells, and (e) frequency and total number of CD4+ T cells expressing IL-23R recovered from spleens of IRBP-immunized Rag1−/− recipients. Data are combined from 2 independently performed experiments with n = 5 (WT) and n = 4 (Nod2-/-) mice; *p = 0.0159 (% and #). f IL-17 production was measured by ELISA following 18 h in vitro stimulation with IRBP1–20. Data are combined from 2 independent experiments. For WT, n = 10 (media) and 9 (peptide) and for Nod2−/−, n = 11(media) and 10 (peptide) mice; **p = 0.0030. (g-h) Rag1−/− mice were reconstituted with thymocytes derived from naïve WT or Nod2−/− mice and immunized with IRBP 8 days later. g Clinical uveitis was evaluated weekly by fundoscopy. Data is combined from 2 independent experiments. For WT, n = 14 (7, 14, 21, 35 day), 13 (28 day) and for Nod2−/−, n = 12 mice; *p = 0.0331 (14 day), ***p < 0.0001 (21 day), ***p = 0.0002 (28 day), *p = 0.0347 (35 day). h IL-17 production was measured with ELISA following 18 h in vitro stimulation of splenocytes with IRBP1–20. Data are combined from 2 independent experiments with n = 9 (WT media) and 8 (all other conditions) mice; *p = 0.0281. Data are mean ± SEM (a, g), box-whisker plots showing median, 25–75th percentile and min-max range (c, f), or box-whisker plots showing median, 10–90th percentile and min-max (e, h). Statistical differences between groups were calculated using two-tailed Mann–Whitney U test. Source data are provided as a Source Data file.
Fig. 6
Fig. 6. Nod2 functions independent of Rip2-signaling in T cells.
ab EAU was induced in WT and Rip2−/− mice. Data are combined from 3 independent experiments. For WT, n = 10 (10 and 19 day) and 24 (13 day). For Rip2−/−, n = 9 (10 day), 21 (13 day), 12 (19 day). a Clinical uveitis was evaluated weekly by fundoscopy; *p = 0.0320. b Representative fundus photographs 13 days post-immunization. cd Rag1−/− mice were reconstituted with thymocytes from naïve WT or Rip2−/− mice and immunized with IRBP 8 days later. Data are combined from 2 independent experiments with n = 10 (WT recipients) and n = 18 (Rip2−/− recipients). c Clinical uveitis was evaluated by fundoscopy 28 days post-immunization; *p = 0.0074. d Representative fundus photographs are shown. Data are mean ± SEM (a) or box-whisker plots showing median, 25–75th percentile, and min–max range (with dots representing individual values) (c). Statistical differences between groups were calculated using two-tailed Mann–Whitney U test (a, c). Source data are provided as a Source Data file.
Fig. 7
Fig. 7. Nod2 controls Th17 immunity in naïve mice and Blau syndrome.
a Nod2 expression in IRBP1–20–stimulated CD4+ T cells of naïve, adjuvant-only, or immunized WT mice relative to unstimulated CD4+ T cells from naïve WT mice was measured by qPCR. Controls include IFNγ-stimulated WT BMDM and Nod2−/− BMDM cells. Data are representative of 2 independent experiments, each with n = 5 spleens pooled/genotype. bc Rag2−/− hosts reconstituted with CD4+ T cells from naïve R161M or Nod2−/−R161M mice were assessed for uveitis 7 days post-transfer. Data are combined from 3 independent experiments with n = 12 mice/group. b Clinical uveitis was scored, *p = 0.0500. c Representative fundus and histopathology photographs. dg T cell responses in naïve WT and Nod2−/− (C57BL/6 J) mice. d Naïve CD4+ T cells (CD62LhiCD44-) from WT and Nod2−/− mice were differentiated under Th17-polarizing conditions and frequency of IL-17-producing CD4+ T cells (CD4+CD8-Thy1.2+IL-17+) was determined by flow cytometry. Data are combined from 2 independent experiments for n = 8 mice/genotype. e Frequency of memory (CD62L-CD44+) CD4+ T cells from naïve WT or Nod2−/− mice expressing indicated factors was determined by flow cytometry 5 days post-stimulation with anti-CD3/anti-CD28 mAb. Data is representative of 3 independently performed experiments, each with n = 4 mice/genotype; *p = 0.0286 for all indicated comparisons. fg Memory CD4+ T cells from naive WT or Nod2−/− mice stimulated 16 h with anti-CD3/anti-CD28 mAb were analyzed by multiplex-qPCR. Transcripts are relative to unstimulated control memory CD4+ T cells of WT mice (horizontal line), with n = 3 mice/condition. hi PBMCs of two healthy controls or two Blau syndrome patients were stimulated with anti-CD3/anti-CD28 mAb for 5 days then with PMA/ionomycin for 4 h. Experiment was repeated twice. h Frequency of IL-17-producing CD4+ T cells (CD3+CD4+CD19-IL-17+)(*p = 0.0055) and representative contour plot. i Representative histogram showing MFI of CCR7 by CD4+ T cells (CCR7+CD3+CD4+CD19-). Data are box-whisker plots showing median with 25–75th percentile and min–max range (b, d), box-whisker plots showing median with 10–90th percentile (e), or floating bars showing median and min–max range (f, g). Dots represent individual values (b, h). Statistical differences were calculated using two-tailed Mann–Whitney U test (d, e) or unpaired, two-tailed Student’s t-test (b, fh). Source data are provided as a Source Data file.+.

References

    1. de Smet MD, et al. Understanding uveitis: the impact of research on visual outcomes. Prog. Retinal Eye Res. 2011;30:452–470. doi: 10.1016/j.preteyeres.2011.06.005. - DOI - PubMed
    1. Havnaer A, Han G. Autoinflammatory disorders: a review and update on pathogenesis and treatment. Am. J. Clin. Dermatol. 2019;20:539–564. doi: 10.1007/s40257-019-00440-y. - DOI - PubMed
    1. Philpott DJ, Sorbara MT, Robertson SJ, Croitoru K, Girardin SE. NOD proteins: regulators of inflammation in health and disease. Nat. Rev. Immunol. 2014;14:9–23. doi: 10.1038/nri3565. - DOI - PubMed
    1. Miceli-Richard C, et al. CARD15 mutations in Blau syndrome. Nat. Genet. 2001;29:19–20. doi: 10.1038/ng720. - DOI - PubMed
    1. Sarens, I. L. et al. Blau syndrome-associated uveitis: preliminary results from an international prospective interventional case series. Am. J. Ophthalmol.187, 158–166 (2017). - PubMed

Publication types

MeSH terms

Supplementary concepts