. 2020 Oct 26;6(1):34.
doi: 10.1038/s41540-020-00150-w.

ROS networks: designs, aging, Parkinson's disease and precision therapies

Affiliations

ROS networks: designs, aging, Parkinson's disease and precision therapies

Alexey N Kolodkin et al. NPJ Syst Biol Appl. .

Abstract

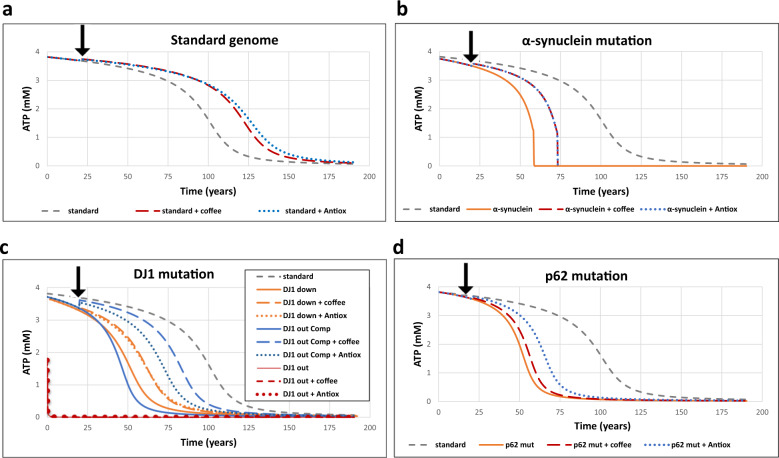
How the network around ROS protects against oxidative stress and Parkinson's disease (PD), and how processes at the minutes timescale cause disease and aging after decades, remains enigmatic. Challenging whether the ROS network is as complex as it seems, we built a fairly comprehensive version thereof which we disentangled into a hierarchy of only five simpler subnetworks each delivering one type of robustness. The comprehensive dynamic model described in vitro data sets from two independent laboratories. Notwithstanding its five-fold robustness, it exhibited a relatively sudden breakdown, after some 80 years of virtually steady performance: it predicted aging. PD-related conditions such as lack of DJ-1 protein or increased α-synuclein accelerated the collapse, while antioxidants or caffeine retarded it. Introducing a new concept (aging-time-control coefficient), we found that as many as 25 out of 57 molecular processes controlled aging. We identified new targets for "life-extending interventions": mitochondrial synthesis, KEAP1 degradation, and p62 metabolism.


Conflict of interest statement

The authors declare no competing interests.

Figures

Fig. 1
Fig. 1. Network diagrams describing five ROS-management designs.
Design 1 is comprised in Design 2 and in Design 3, Design 3 in Design 4, and Design 4 in Design 5, thereby forming a hierarchy of networks and corresponding models. a Design 1: Steady but not yet robust. Healthy mitochondria present at a fixed concentration are damaged by ROS and thereby converted into impaired mitochondria by reaction 2 (re2). Impaired mitochondria produce ROS (re4). Impaired mitochondria and ROS hereby constitute a positive feedback loop. The node called Antiox comprises the total pool of all antioxidant response elements, i.e., both metabolites (e.g. glutathione) and enzymes (e.g. superoxide dismutase) catalyzing ROS removal (re5). p62 and parkin are required for mitophagy (removal of impaired mitochondria, re3) and are removed together with impaired mitochondria in the process (re3). b Design 2: Robust but not yet homeostatic. Here, healthy mitochondria occur at a variable rather than fixed concentration (substances at variable concentrations are shown in non-gray boxes; also Antiox and p62 were made variable here, but without effect in this design) and a reaction where they are synthesized at a constant rate (re1) has been added to Design 1. c Design 3: Homeostatic yet potentially oscillatory. Three negative feedback loops have been added to Design 2 (ROS species on the diagram). The new variables Keap1 and Nrf2, in both active an inactive form, involve the Antiox, p62, but not (yet) parkin, which was made variable, i.e., subject to synthesis and degradation reactions, but is not colored in this figure because this had no effect as these reactions were not affected by the rest of the network. ROS oxidize and thereby inactivate Keap1 (re12), which is slowly re-reduced (re13). Active Keap1 shifts the Nrf2 balance towards inactive Nrf2 (re14). When active, Nrf2 activates the synthesis of both p62 (re6) and Antiox (re8), which causes breakdown of ROS (re5). Thus, ROS activates Nrf2, Antiox, and p62, and inactivates Keap1 and itself: this forms a dual ROS-regulating negative feedback loop. Removal of damaged mitochondria causes a reduction in parkin levels, which reduces the removal rate of impaired mitochondria, which constitutes another negative feedback loop. d Design 4: Dynamically robust yet fragile vis-à-vis repeated challenges. Mitochondrial repair via the NFκB signaling system (violet species on the diagram) has been added to Design 3: Parkin activates NFκB signaling via IKK (re16). NFκB signal activates the synthesis of Bclxl (re18) and p62 (re6). Bclxl activates the protection of mitochondria by salvaging impaired mitochondria (re20). e Design 5: Robust against repeated dynamic challenges. The DJ-1 module (red species on the diagram) has been added to Design 4 as a ROS sensor. DJ-1 is a protein that may be present in two conformations: active (oxidized) and non-active (reduced). DJ-1 activation is catalyzed by ROS (re21). When active, DJ1 inhibits removal of NFκB signal (re17) in sub-design 5.1, inhibits inactivation of Nrf2 (re14) in sub-design 5.2, or regulates both NFκB and Nrf2 signaling pathways in sub-design 5.3. Sub-design 5.3 is the complete version of Design 5, where, upon an increase of ROS concentration, DJ-1 simultaneously activates both the antioxidant response and mitophagy (via Nrf2 and p62) and mitochondrial repair (via NFκB and BclXl).
Fig. 2
Fig. 2. Robustness properties emerging from the five network designs.
a The table summarizing added features and new emergent properties gained at every design. b The response to perturbations of ROS concentration in Design 1 (model B1), and Design 2 (model B2B). ROS concentration (in nM) is shown for the case of “no design” (solid blue line), which increases rapidly from 0 at time zero to over 100nM within 1h. For numerical reasons, then the simulations was stopped, Design 1 (dotted red line) and Design 2 (solid green line). Both ROS injection (doubling of the initial ROS concentration at day −1, or a decrease in ROS level (the ROS concentration was decreased to 20nM at day −3 was applied. All models are described in detail in Supplementary Information (Sections B1 and B2B). c The response to perturbations of ROS generation in Design 1 (model B1) and Design 2 (model B2B). ROS concentration (in nM) is shown for the case of “no design” (solid blue line), Design 1 (red lines), and Design 2 (green lines). The ROS generation rate constant was either increased twofold on day 1 (responses are shown in solid lines: solid red line for design 1; solid green line for design 2) or first decreased twofold on day 1 and then returned back to the initial value on day 3 (responses are shown in dashed lines: dashed red line for design 1; dashed green line for design 2). All models are described in detail in Supplementary Information (Sections B1 and B2B). d Emergence of homeostasis in Design 3 (model B3). The steady-state concentration of ROS (in nM) is shown against the fold change of the rate constant of ROS generation for Designs 2A (dashed gray line), Design 2B (solid red line), Design 3 (solid green line), Design 4 (dashed yellow line), and Design 5 (purple line). Homeostasis coefficients (H) for each design (shown in boxes) were computed at the point where ROS synthesis fold change was equal to 1. Model is described in Supplementary Information (Section B3). e Emergence of dynamic robustness in Design 4 (model B4). The concentration of healthy mitochondria (in nM) is shown for Designs 3 (dashed gray line) and Design 4 (solid green line). The initial ROS concentration was perturbed (transient increase from 10 to 11nM) at day 1. Dashed red line shows a hypothetical viability that corresponds to the threshold line dissecting 20% (i.e. 10nM) of the initial concentration of healthy mitochondria (i.e. 50 nM). Model is described in Supplementary Information (Section B4). f Emergence of dynamic robustness vis-à-vis with respect to the second pulse of ROS in Design 5 (model B5). The concentration of healthy mitochondria (in nM) is shown for Designs 4 (dashed gray line) and Design 5 (solid green line). The ROS generation rate constant was increased 15-fold on day 1, but, 3h before the increase of ROS generation, the NFκB signaling was increased 15-fold and the system reached a new steady state. On day 8 the ROS generation rate constant was decreased 15-fold causing the growth of healthy mitochondria. At the time point when the concentration of healthy mitochondria was near its peak value, the ROS generation rate constant was increased 15-fold for the second time. Model is described in Supplementary Information (Section B5).
Fig. 3
Fig. 3. Network diagram of the comprehensive model (“Model D”) of ROS management.
The resolution of model C (Supplementary Fig. C.1) was increased, i.e., the nucleus and cytoplasm compartments, an mRNA layer for several proteins, and several additional species and interactions were added as follows. ATP module: A constant source of reductive equivalents (RE) in the form of reduced NAD+ (i.e. NADH+H+), and a constant source of O2 drive three reactions: (i) in the reaction catalyzed by healthy mitochondria (re8), reduction of O2 to H2O is coupled to phosphorylation of ADP into ATP; (ii) in the reaction catalyzed by impaired mitochondria (re41), reductive equivalents are only used as a source of incompletely reduced oxygen species (ROS); (iii) in the reaction activated by uncoupling proteins (re51), O2 is reduced to H2O without phosphorylation of ADP into ATP. ATP is dephosphorylated back to ADP in reaction re29, which represents the overall net reaction of all ATP consuming reactions. Uncoupling proteins: The expression of uncoupling proteins is activated by active DJ-1 in the “bipartite” irreversible reaction (re21). Genes coding uncoupling proteins are present in active (transcribed) and inactive (silent) forms. The higher is the concentration of DJ-1, the higher is the transcription of uncoupling proteins (re22). In turn, the higher is the concentration of uncoupling proteins mRNA, the higher is the rate of its translation into uncoupling proteins (re24). Uncoupling proteins inhibit the production of both ATP (re8) and ROS (re41) and activate the uncoupled respiration (re51). Since the concentrations of all its substrates (O2 and reductive equivalents) and products (H2O) are fixed, the reaction of respiration was omitted in the COPASI version of the models. A strategy similar to the modeling of “uncoupling proteins” expression was used for the modeling of antioxidant response and p62, for which active (transcribed) and inactive (silent) forms of genes were considered too. Activation of transcription would mean an activation of the “bipartite” irreversible transition of a silent gene into its transcribed gene (re9 and re18). Binding of the active (localized in the nucleus) fraction of Nrf2 transcription factor, which shuttles between the nucleus and cytoplasm (re17 and re52), facilitates the transition of a silent gene to its actively transcribed counterpart. When the gene is active, it catalyzes the transcription (production of mRNA in re10 and re20). When the concentration of mRNA increases, translation is activated (the production of proteins in re7 and re12). More detailed mitophagy mechanism: Pink1 binds to parkin in a “bipartite” irreversible reaction (re26) and facilitates ubiquitination of VDAC1 in another “bipartite” irreversible reaction (re1). The latter interacts with p62 (re16) to form a complex that, like ROS, facilitates the formation of apoptotic machinery (re39). This apoptotic machinery (called AP) catalyzes the reaction re35 in which impaired mitochondria are degraded. Cyt C and NFκB: Impaired mitochondria release Cyt C (re49). Apart from activating mitochondrial recovery (re50), Bclxl inhibits Cyt C release. When Cyt C exceeds a threshold, it induces cell death (not shown on diagram). Keap1 module: Keap1 transiently binds and then ubiquitinates and thereby facilitates degradation of both Nrf2 (reaction chain re2, re4, and re5) and p62 (re6 and re28; p62 is not released back; it is not a catalytic factor but a co-substrate). In these diagrams SBGN notation was used, i.e. –o for stimulation, -| for inhibition and – for co-reaction. ↔ refers to reaction, which can be reversible [black double headed arrows], → irreversible [black arrows], “bipartite” irreversible [green arrows] (this is specified in the Copasi files). “Bipartite” irreversible refers to any case where a process has a forward and a reverse reaction that are not each other’s microscopic reversal, the one being affected by a third agent while the other is not. Reaction numbers are positioned at the origins of reaction arrows. The species with constant concentration (e.g. a constant source of substrate or a constant sink of product) are shown in gray color.
Fig. 4
Fig. 4. Validation of the comprehensive model D in terms of response to menadione and hydrogen peroxide.
a, b Validation in terms of response to menadione. These data were taken from the study reported on by Deferme et al.. a Change in the concentration of reduced DMPO (used as a sensor of ROS) upon addition at time zero of menadione (100 μM) in model D as compared to the response of HepG2 cells, starting from 0 at the steady state before the addition of menadione. b Fold change (relative to initial) in concentrations of mRNAs upon an addition at time zero of menadione (100 μM) in model D as compared to the response of HepG2 cells, starting from 1 at the steady state before the addition of menadione. A time delay of 35 min was taken into account in the modeling. c, d Changes in relative concentrations of ATP upon addition at time zero of H2O2 (50, 150, or 300 μM) to PC12 cells. c The concentration of ATP (% of its initial value) after one single addition to PC12 cells (at t = 0) of H2O2: 50 μM (blue), 150 μM (red), or 300 μM (green). This single treatment was either a continuous or a pulse treatment. In the pulse treatment, H2O2 was washed away after 30 min by replacing the medium. In the continuous treatment, no such action was taken. Separate experiments (Supplementary Fig. D.2A) showed that peroxide degrades much faster than the time before washing. Thus, we did not differentiate between pulse and continued treatment during model fitting. d The concentration of ATP (% of its initial value) during periodic treatment with different concentrations of peroxide. H2O2 50 μM (blue), 150 μM (red), or 300 μM (green) was added once per hour throughout the experiment, starting at t = 0 h. In all cases model D (corresponding to Fig. 3) was used to calculate model predictions (see also Methods and Supplementary Information, Section D). The perturbations by menadione and H2O2 were modeled as follows. Both menadione and H2O2 are transported to the cell in reversible reactions, and degraded both in the extracellular media and in the cell. Their rate of degradation in the cell is higher than in the extracellular media. In the cell, menadione induced ROS generation (re41 in Fig. 3), which corresponds to the menadione-induced inhibition of mitochondrial complex I, enhancing electrons leakage for ROS generation. H2O2 catalyzes the production of other species, so-called “damage”, which correspond to .OH radical formation and the accumulation of cellular damage done by the hydroxyl radical (such as DNA mutation, lipids oxidation, etc.). “Damage” is also removed (damage reparation). Similar to menadione, “damage” causes an increase of ROS generation (re41 in Fig. 3). When replacing this menadione module (a, b) with an H2O2 module (c, d), all parameters in the model were kept the same, except for those relating to ROS induction by menadione or H2O2, or the transport and degradation of menadione and H2O2. The model is publicly available at FAIRDOMHub. The calibrated version is available at 10.15490/FAIRDOMHUB.1.MODEL.643.1. The model can be simulated online for FAIRDOMHub registered users, or the COPASI version of the model can be downloaded.
Fig. 5
Fig. 5. Personalized aging and medicine.
The detailed model D (Fig. 3) was used for the simulations. Species representing ROS-induced damage accumulated in the model, which enhanced ROS production by impaired mitochondria. The treatment with coffee started at 20 years and was simulated by the 1.1-fold activation of Nrf2 nuclear import. The treatment by antioxidant started at 20 years as well and was simulated as the 1.2-fold activation of the synthesis of antioxidant proteins. Aging (represented as the decline of ATP concentration thought to represent generalized failure of energetics) was simulated for four scenarios (ad). a Simulated ATP(t) in a healthy cell without any treatment (dashed gray line), and when treated with antioxidants, starting at 20 years as well, and simulated as the activation of antioxidant proteins synthesis (1.2-fold, dotted blue line), or with caffeine, started at 20 years and simulated by activation of the Nrf2 nuclear import (1.1-fold, dashed red line). b Aging when α-synuclein source and thereby the rate constant of α-synuclein “aggregates” formation (re36) is increased twofold without any treatment (solid orange line), or when being treated (like treatments in a) with either antioxidants (dotted blue line) or coffee (dashed red line), is compared with the standard aging of a healthy cell (dashed gray line). c Aging in the presence of DJ-1 mutations, without any treatment (solid lines), or when being treated (like treatments in a) with either antioxidants (dotted lines) or coffee (dashed lines) is compared with the standard aging in a healthy cell (dashed gray line). Three mutated sub-versions were modeled: (i) DJ-1 mutation (“DJ1 down”: orange lines), where DJ-1 activity is decreased twofold, (ii) DJ-1 mutation (“DJ1 out”: red lines), where the concentration of total DJ-1 protein is kept at almost 0, and (iii) DJ1 mutation compensated with the increased activity of Keap1–Nrf2 signaling, modeled by a fourfold increase of the rate constant of Nrf2 production (“DJ-1 out Comp”: blue lines). Dashed lines refer to the corresponding cases treated as in c. d Aging in the presence of a p62 mutation in which p62 mRNA level is fixed and is not regulated by ROS, without any treatment (solid orange line), and when being treated (like treatments in a) with either antioxidants (dotted blue line) or coffee (dashed red line). All cases are compared with the standard aging in a healthy cell (dashed gray line). The mutation of α-synuclein was simulated by increasing the fixed concentration of α-synuclein twice. The mutation of “DJ-1 down”, which means “DJ-1 knockdown”, was simulated by decreasing the total DJ-1 concentration twice. The mutation of “DJ-1 out”, which refers to a DJ-1 knockout, was simulated by decreasing the total DJ-1 concentration 500 times. The mutation of “DJ-1 out com”, meaning a DJ-1 knockout compensated by Nrf2, was simulated by taking the model with the DJ-1 knockout mutation and increasing the rate constant of NR2 synthesis fourfold. The mutation “p62 mut” was simulated by fixing the concentration of p62 mRNA at the initial steady-state value; thus, the transcription p62 was no longer regulated by Nrf2.

Similar articles

Cited by

References

    1. Quinlan CL, Perevoshchikova IV, Hey-Mogensen M, Orr AL, Brand MD. Sites of reactive oxygen species generation by mitochondria oxidizing different substrates. Redox Biol. 2013;1:304–312. doi: 10.1016/j.redox.2013.04.005. - DOI - PMC - PubMed
    1. Holmstrom KM, Finkel T. Cellular mechanisms and physiological consequences of redox-dependent signalling. Nat. Rev. Mol. Cell Biol. 2014;15:411–421. doi: 10.1038/nrm3801. - DOI - PubMed
    1. Li X, et al. Targeting mitochondrial reactive oxygen species as novel therapy for inflammatory diseases and cancers. J. Hematol. Oncol. 2013;6:19. doi: 10.1186/1756-8722-6-19. - DOI - PMC - PubMed
    1. Afonso V, Champy R, Mitrovic D, Collin P, Lomri A. Reactive oxygen species and superoxide dismutases: role in joint diseases. Joint Bone Spine. 2007;74:324–329. doi: 10.1016/j.jbspin.2007.02.002. - DOI - PubMed
    1. Oyewole AO, Birch-Machin MA. Mitochondrial-targeted antioxidants. FASEB J. 2015;29:4766–4771. doi: 10.1096/fj.15-275404. - DOI - PubMed

Publication types

Substances