. 2020 Oct 26;10(1):18228.
doi: 10.1038/s41598-020-75349-2.

Morphological and physiological responses of two willow species from different habitats to salt stress

Affiliations

Morphological and physiological responses of two willow species from different habitats to salt stress

Shuang Feng et al. Sci Rep. .

Abstract

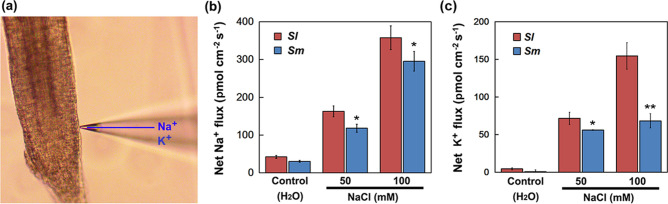
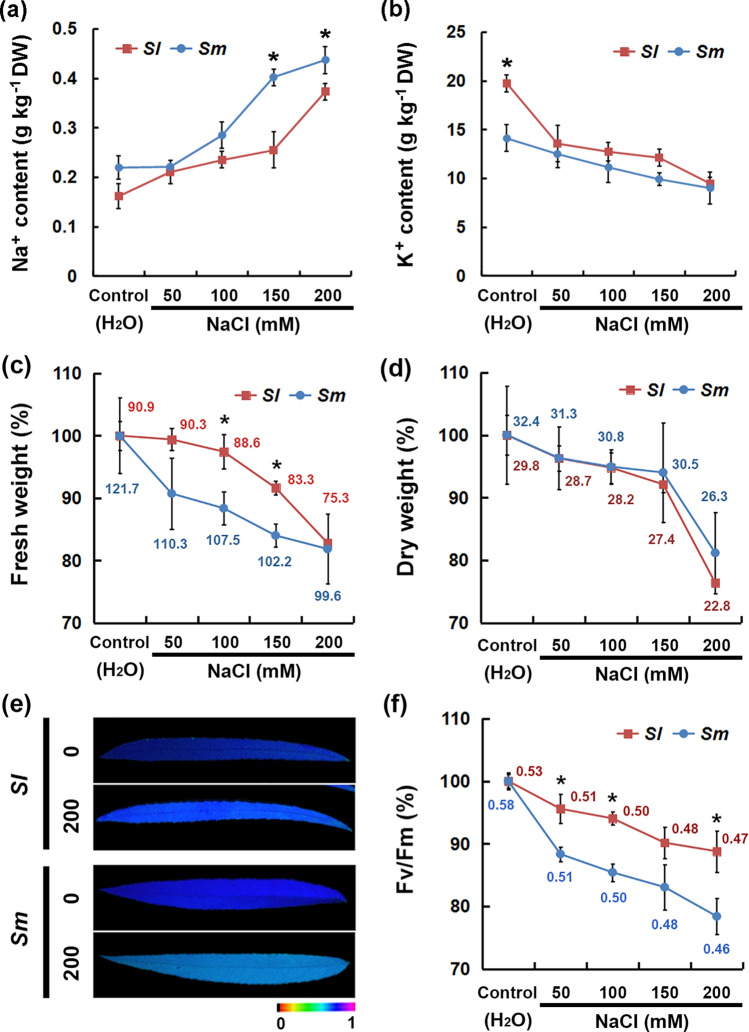
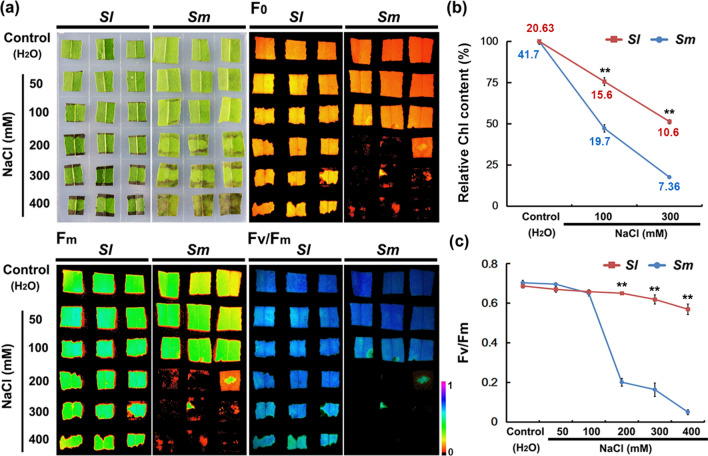
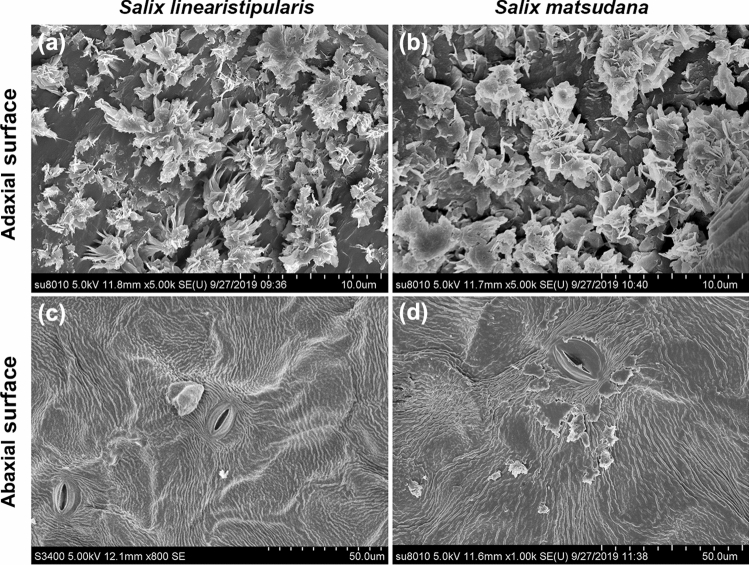
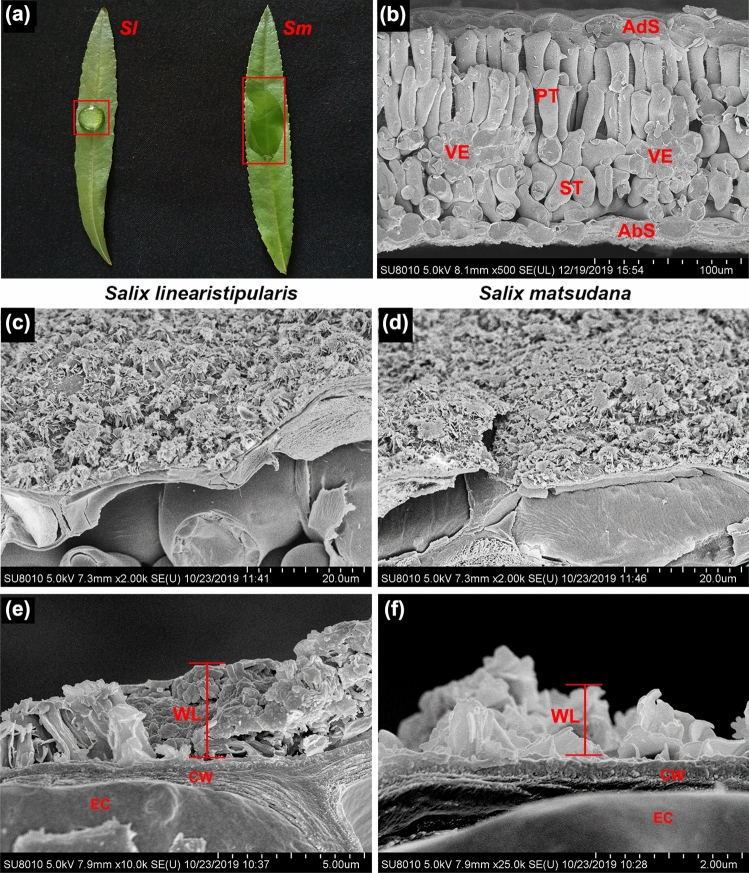
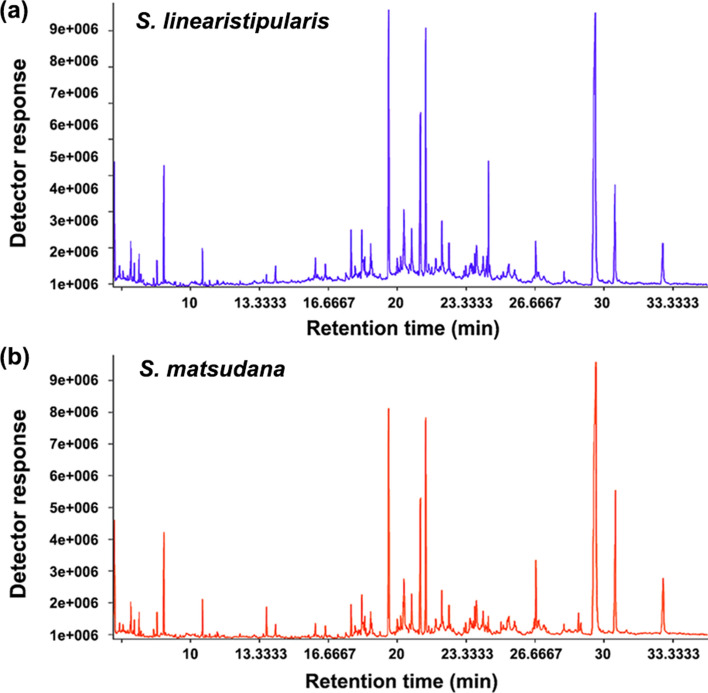
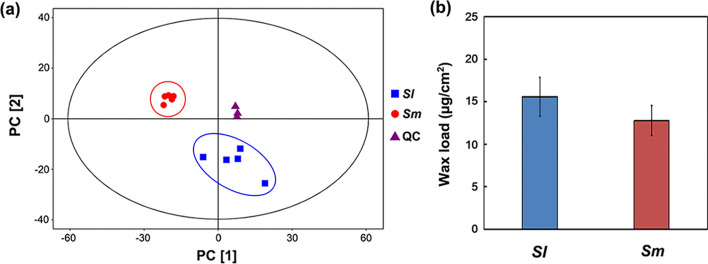
Plant salt tolerance is a complex mechanism, and different plant species have different strategies for surviving salt stress. In the present study, we analyzed and compared the morphological and physiological responses of two willow species (Salix linearistipularis and Salix matsudana) from different habitats to salt stress. S. linearistipularis exhibited higher seed germination rates and seedling root Na+ efflux than S. matsudana under salt stress. After salt treatment, S. linearistipularis leaves exhibited less Na+ accumulation, loss of water and chlorophyll, reduction in photosynthetic capacity, and damage to leaf cell structure than leaves of S. matsudana. Scanning electron microscopy combined with gas chromatography mass spectrometry showed that S. linearistipularis leaves had higher cuticular wax loads than S. matsudana leaves. Overall, our results showed that S. linearistipularis had higher salt tolerance than S. matsudana, which was associated with different morphological and physiological responses to salt stress. Furthermore, our study suggested that S. linearistipularis could be a promising tree species for saline-alkali land greening and improvement.


Conflict of interest statement

The authors declare no competing interests.

Figures

Figure 1
Figure 1
Comparison of seed germination rates between S. linearistipularis (Sl) and S. matsudana (Sm) under normal and salt stress conditions. (a) Seeds of Sl and Sm were germinated on filter paper containing aseptic water (control) or NaCl solution (100, 150, and 200 mM) for 4 days, and their germination rate (8 days) (b), germination energy (3 days) (c), and germination index (8 days) (d) were calculated. The asterisk indicates significant difference (**p < 0.01; Student’s t test). The error bar indicates SE (n = 6).
Figure 2
Figure 2
Comparison of root Na+ and K+ efflux rate between S. linearistipularis (Sl) and S. matsudana (Sm) seedling under normal and salt stress conditions. (a) Morphology and site of root monitored by NMT. Mean Na+ (b) and K+ (c) efflux rate from the roots of Sl and Sm seedlings (7-day-olds) after 12 h of incubation in aseptic water (control) or NaCl solutions (50 and 100 mM). The asterisk represents a significant difference (*p < 0.05; Student’s t test). The error bar indicates SE (n = 6).
Figure 3
Figure 3
Comparison of seedling phenotypes between S. linearistipularis (Sl) and S. matsudana (Sm) under normal and salt stress conditions. Na+ (a) and K+ (b) content, fresh (c) and dry (d) weight, and maximal photochemical efficiency (Fv/Fm) (e,f) from the leaves of Sl and Sm seedlings (2-month-olds) treated with aseptic water (control) or NaCl solutions (50, 100, 150, and 200 mM) for 3 days. In (c,d,f), red and blue numbers indicate the actual measured value of Sl and Sm leaves, respectively. The asterisk represents a significant difference (*p < 0.05; Student’s t test). The error bar indicates SE (n = 6).
Figure 4
Figure 4
Comparison of leaf morphology and photosynthetic parameters between S. linearistipularis (Sl) and S. matsudana (Sm) under normal and salt stress conditions. The leaf discs (1–1.5 cm2) were immersed in aseptic water (control) or NaCl solution at different concentrations (50 to 400 mM) for 48 h. (a) The morphology of leaf discs, and their minimum Chl fluorescence (F0), maximal Chl fluorescence (Fm), and maximal photochemical efficiency (Fv/Fm) images. The colored bar at the bottom indicates the panel range from 0 (black) to 1.0 (purple). (b) Relative chlorophyll (Chl) content. (c) Fv/Fm values. In (b), red and blue numbers indicate the actual measured chlorophyll content of Sl and Sm leaves, respectively. The asterisk represents a significant difference (**p < 0.01; Student’s t test). Error bars represent SE (n = 9).
Figure 5
Figure 5
Comparison of TEM images of leaf cell ultrastructure between S. linearistipularis and S. matsudana under (ad) control and (eh) salt stress conditions (300 mM NaCl for 48 h) CW cell wall, Chl chloroplast, CE chloroplast envelope, TM thylakoid membrane, P plastoglobulus, SG starch granule. Error bar = 1 μm (c,e,g), 500 nm (a), and 200 nm (b,d,f,g).
Figure 6
Figure 6
Comparison of cuticular wax crystal patterns on the leaf surfaces between S. linearistipularis and S. matsudana. SEM images of (a,b) the adaxial and (c,d) abaxial surfaces of Sl and Sm leaves. Error bar = 10 μm (a,b), 50 μm (c,d).
Figure 7
Figure 7
Comparison of cuticular wax layer thickness on the leaf surfaces of S. linearistipularis (Sl) and S. matsudana (Sm). (a) Water adhesive phenotype of Sl and Sm leaves. (b) Cryo-SEM image of leaf cross sections. (cf) Cryo-SEM images of the cuticular wax layers of Sl (c,e) and Sm (d,f) on leaf adaxial surface. Red bars indicate the thickness of the cuticular wax layer. AdS adaxial surface, AbS abaxial surface, PT palisade tissue, ST spongy tissue, VE vein, WL wax layer, EC epidermal cell, CW cell wall. Error bar = 100 μm (a), 20 μm (c,d), 5 μm (e), and 2 μm (f).
Figure 8
Figure 8
Total ion chromatograms (TIC) of cuticular wax components of (a) S. linearistipularis and (b) S. matsudana (Sm) leaves.
Figure 9
Figure 9
Comparison of cuticular wax loads on the leaf surfaces of S. linearistipularis (Sl) and S. matsudana (Sm). (a) Results of the principal component analysis of the wax components of Sl and Sm leaves. QC quality control. The 95% confidence interval region according to Hotelling’s T2 statistic. (b) Cuticular wax loads of Sl and Sm leaves. Error bars represent SE (n = 5).

References

    1. Argus GW. Infrageneric classification of Salix (Salicaceae) in the new world. Syst. Bot. Monogr. 1997;52:1–121. doi: 10.2307/25096638. - DOI
    1. Argus GW. Salix (Salicaceae) distribution maps and a synopsis of their classification in North America, north of Mexico. Harv. Pap. Bot. 2007;12:335–368. doi: 10.3100/1043-4534(2007)12[335:SSDMAA]2.0.CO;2. - DOI
    1. Greger M, Landberg T. Use of willow in phytoextraction. Int. J. Phytoremediat. 1999;1:115–123. doi: 10.1080/15226519908500010. - DOI
    1. Karp A, et al. Genetic improvement of willow for bioenergy and biofuels. J. Integr. Plant Biol. 2011;53:151–165. doi: 10.1111/j.1744-7909.2010.01015.x. - DOI - PubMed
    1. Tozser D, Magura T, Simon E. Heavy metal uptake by plant parts of willow species: A meta-analysis. J. Hazard. Mater. 2017;336:101–109. doi: 10.1016/j.jhazmat.2017.03.068. - DOI - PubMed

Publication types