. 2020 Oct 26;10(1):18219.
doi: 10.1038/s41598-020-75088-4.

Disentangling etiologies of CNS infections in Singapore using multiple correspondence analysis and random forest

Affiliations

Disentangling etiologies of CNS infections in Singapore using multiple correspondence analysis and random forest

Raphaël M Zellweger et al. Sci Rep. .

Abstract

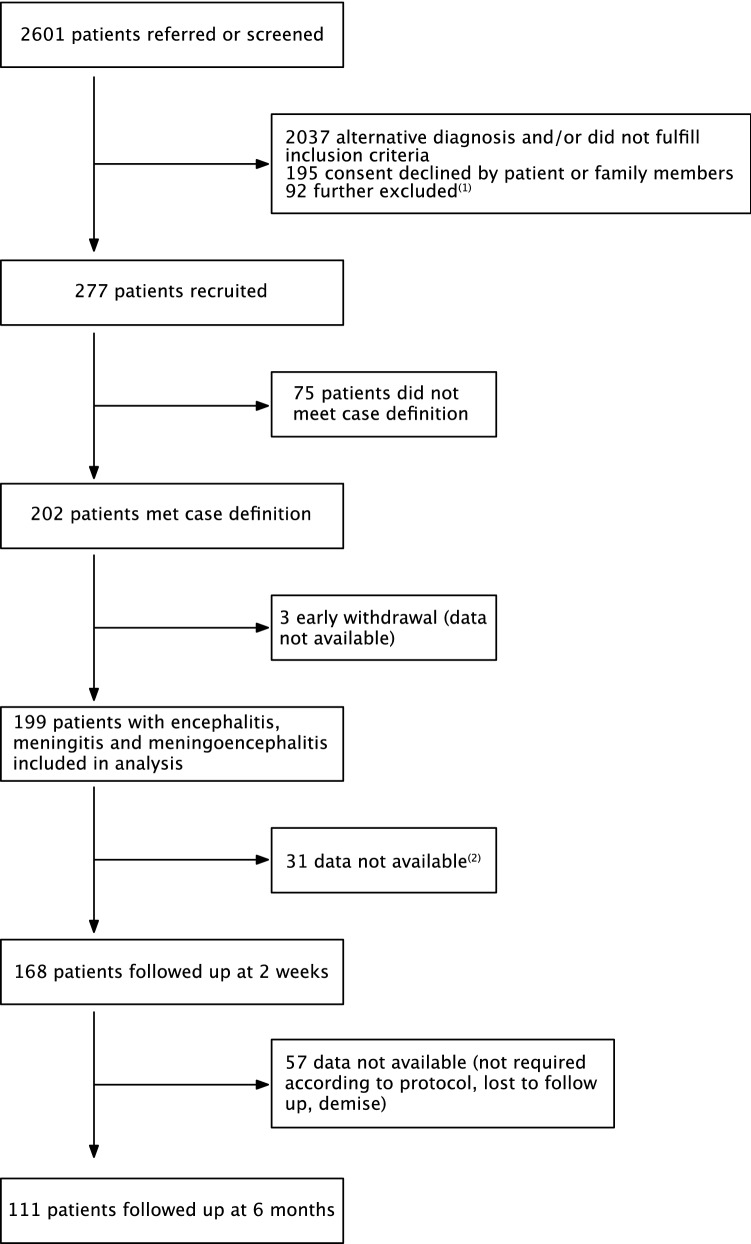
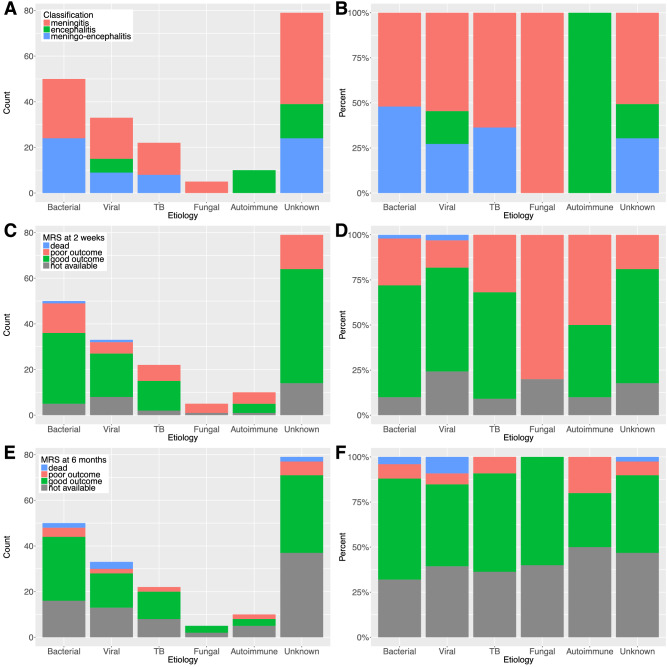
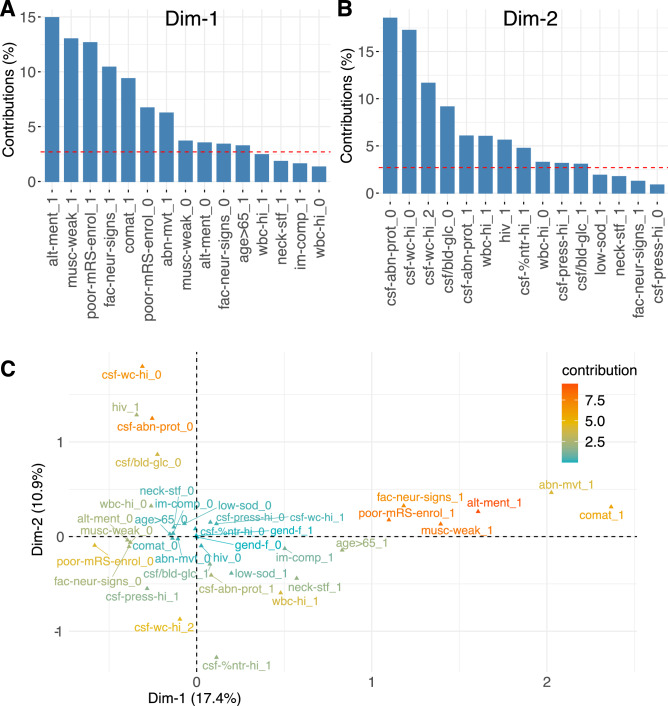
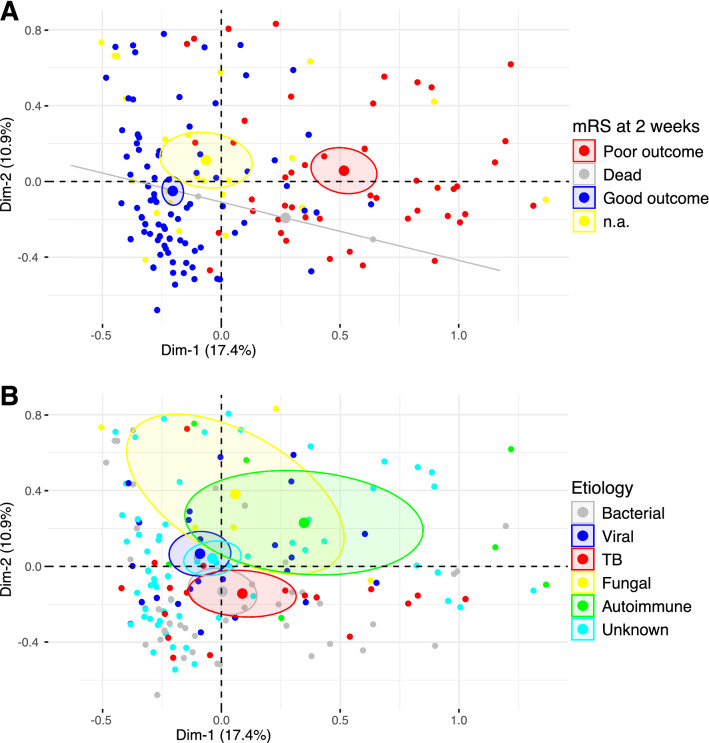
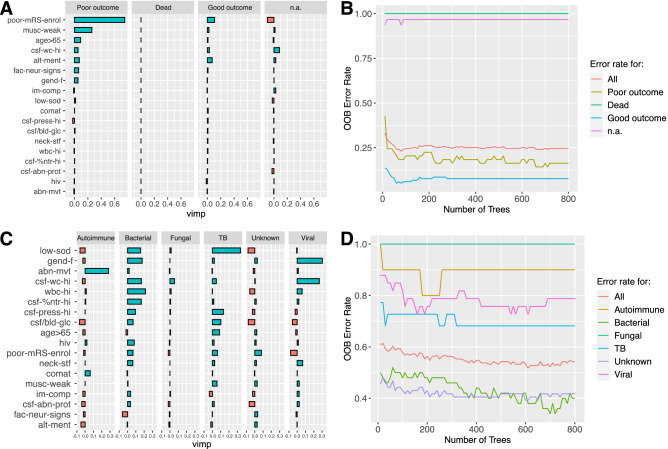
Central nervous system (CNS) infections cause substantial morbidity and mortality worldwide, with mounting concern about new and emerging neurologic infections. Stratifying etiologies based on initial clinical and laboratory data would facilitate etiology-based treatment rather than relying on empirical treatment. Here, we report the epidemiology and clinical outcomes of patients with CNS infections from a prospective surveillance study that took place between 2013 and 2016 in Singapore. Using multiple correspondence analysis and random forest, we analyzed the link between clinical presentation, laboratory results, outcome and etiology. Of 199 patients, etiology was identified as infectious in 110 (55.3%, 95%-CI 48.3-62.0), immune-mediated in 10 (5.0%, 95%-CI 2.8-9.0), and unknown in 79 patients (39.7%, 95%-CI 33.2-46.6). The initial presenting clinical features were associated with the prognosis at 2 weeks, while laboratory-related parameters were related to the etiology of CNS disease. The parameters measured were helpful to stratify etiologies in broad categories, but were not able to discriminate completely between all the etiologies. Our results suggest that while prognosis of CNS is clearly related to the initial clinical presentation, pinpointing etiology remains challenging. Bio-computational methods which identify patterns in complex datasets may help to supplement CNS infection diagnostic and prognostic decisions.


Conflict of interest statement

K.T. has received travel grants and compensation from Novartis, Merck, Sanofi, Eisai and Viela Bio for consulting services. The University of Oxford and A.V. hold patents for MuSK, LGI1 and CASPR2 antibody assays, licensed to Athena Diagnostics and Euroimmun AG. A.V. receives a proportion of royalties. All other authors declare no competing interests.

Figures

Figure 1
Figure 1
Study schematic. Notes: (1) These patients might or might not have fulfilled the study criteria; those who were missed either died or were not able to take consent because no legally acceptable representative was available or they were transferred out of hospital before taking consent or primary team doctors were not agreeable to recruit patients who are in serious condition or prisoners. (2) Patients may have been recruited on the discharge date or overlooked or patient withdrew from the study or declined to be followed up upon recruitment or demise.
Figure 2
Figure 2
Distribution of diagnosis (A,B) and clinical outcomes (CF) stratified by etiology. Absolute counts (A) and percentages (B) of cases with diagnoses of meningitis, encephalitis or meningo-encephalitis, stratified by etiology. Absolute counts and percentages of cases with different clinical outcomes at 2 weeks (C,D) and 6 months (E,F), stratified by etiology.
Figure 3
Figure 3
Variables of the MCA—contribution to the first 2 dimensions and correlation. Contribution of variables (expressed in %) to the first (A) and second (B) dimension of the MCA. The dotted red line denotes the average value expected if all variables contributed equally to the dimensions. Presence or absence of a variable is denoted by 1 or 0 after the name, except for the CSF white cell count where 0, 1 and 2 denote ≤ 4, 5–200 and > 200 cells/ul, respectively. Dimension 1 is related to the initial clinical presentation, dimension 2 is related to laboratory measurements (see text for details). On the correlation plot of the variables (C), variable contribution to the dimensions of the MCA is indicated in color and distance is inversely proportional to the correlation between variables. Variable abbreviations: "poor-mRS-enrol": poor mRS score at enrolment, "im-comp": immunocompromised, "hiv": HIV-status, "alt-ment": altered mental status, "comat": comatose, "neck-stf": neck stiffness, "fac-neur-signs": facial focal neurological signs, "musc-weak": muscle weakness, "abn-mvt": abnormal movements, "csf-abn-prot": abnormal level of protein in the CSF, "csf/bld-glc" low CSF to blood glucose ratio, "csf-wc-hi": elevated CSF white cell count, "csf-%ntr-hi": elevated percentage of neutrophils in the CSF, "gend-f": female gender, "wbc-hi": elevated white blood cells, "low-sod": low sodium, "csf-press-hi": elevated opening pressure, "age > 65": age over 65.
Figure 4
Figure 4
Individuals on the MCA plane, colored by clinical outcome (A) or etiology (B). Representation of the individuals on the plane defined by dimensions 1 and 2 of the MCA, stratified by mRS score at 2 weeks (A) or by etiology (B). The larger dot and the ellipse represent the barycenter of the cloud of points, and the 95% confidence interval of the barycenter. Dimension 1 is related to the initial clinical presentation, dimension 2 is related to laboratory measurements (see text for details).
Figure 5
Figure 5
Random forest (RF) analysis for clinical outcome at 2 weeks (A,B) and etiology (C,D). A random forest analysis was performed with the clinical outcome at 2 weeks as classifier (A,B) or the etiology as classifier (C,D). (A) Variable importance for each of the possible outcomes (poor outcome, dead, good outcome, n.a.). (B) Error rate (based on out-of-the-bag cross-validation) as a function of the number of trees generated. (C) Variable importance for each of the possible etiologies (autoimmune, bacterial, fungal, TB, unknown, viral). (D) Error rate (based on out-of-the-bag cross-validation) as a function of the number of trees generated.

References

    1. Erdem H, et al. The burden and epidemiology of community-acquired central nervous system infections: a multinational study. Eur. J. Clin. Microbiol. Infect. Dis. 2017;36:1595–1611. doi: 10.1007/s10096-017-2973-0. - DOI - PubMed
    1. Granerod J, et al. Challenge of the unknown. A systematic review of acute encephalitis in non-outbreak situations. Neurology. 2010;75:924–932. doi: 10.1212/WNL.0b013e3181f11d65. - DOI - PubMed
    1. He T, Kaplan S, Kamboj M, Tang YW. Laboratory diagnosis of central nervous system infection. Curr. Infect. Dis. Rep. 2016;18:35. doi: 10.1007/s11908-016-0545-6. - DOI - PMC - PubMed
    1. Venkatesan A. Epidemiology and outcomes of acute encephalitis. Curr. Opin. Neurol. 2015;28:277–282. doi: 10.1097/WCO.0000000000000199. - DOI - PubMed
    1. Graus F, et al. A clinical approach to diagnosis of autoimmune encephalitis. Lancet Neurol. 2016;15:391–404. doi: 10.1016/S1474-4422(15)00401-9. - DOI - PMC - PubMed

Publication types

MeSH terms